
Filtering logs with log patterns
Log patterns let you work with groups of similar log lines. You can hide log patterns that are noisy, or focus only on the patterns that are most useful.
Grafana Logs Drilldown proactively visualizes your log volume data per detected pattern, broken down in various ways. At a glance you can immediately spot spikes or other changes.
To filter the logs with log patterns, perform the following steps:
- To start your filters from scratch, remove all filter selections above the Logs tab.
- Click the Patterns tab to show the log patterns that Logs Drilldown automatically detected.
- Identify a pattern that matches the type of logs you’re interested in viewing.
Click the Include button for the pattern.
Using the example from the previous milestone, the pattern
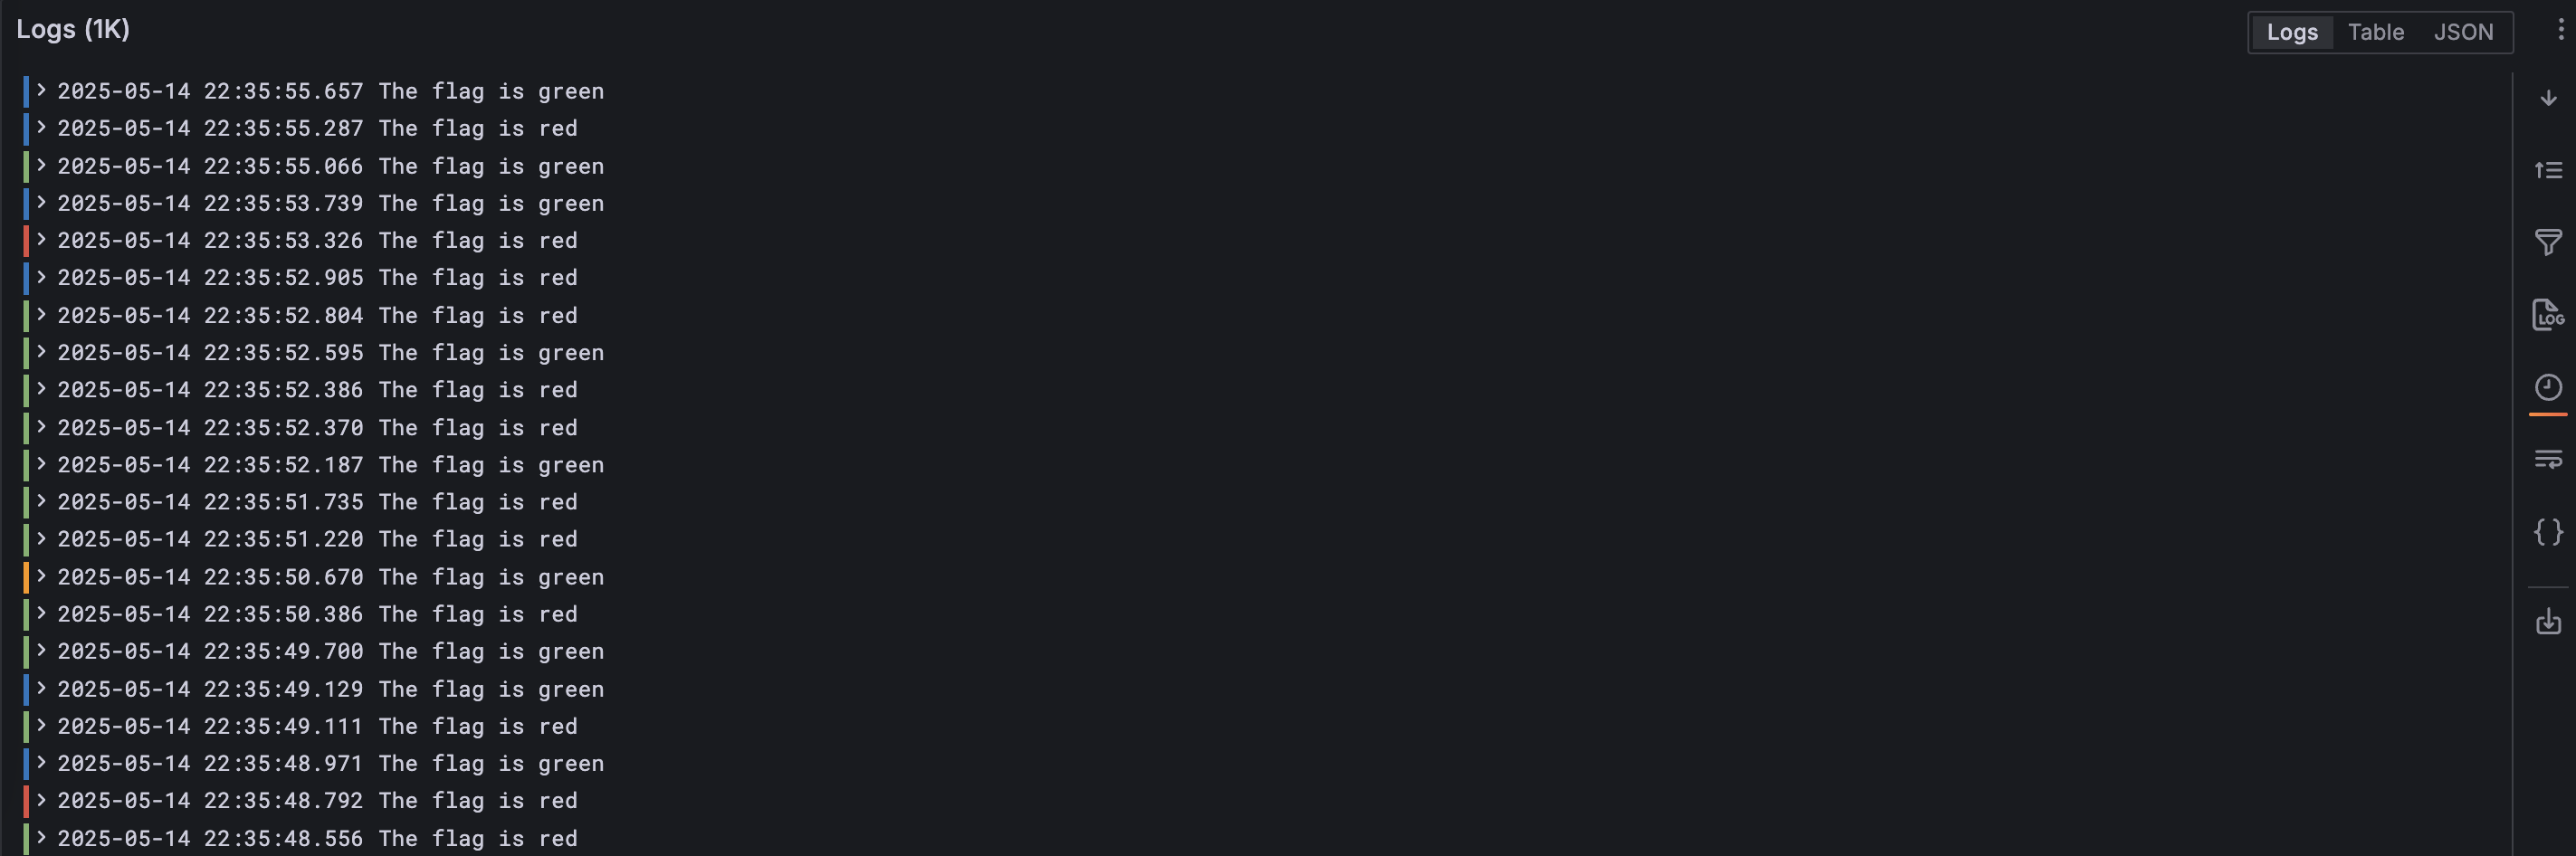
The flag is <_>is selected.Click the Logs tab again and investigate the log entries related to the log pattern you set.
Since the example pattern included has a regex expression, the log entries both include
The flag is greenandThe flag is red.
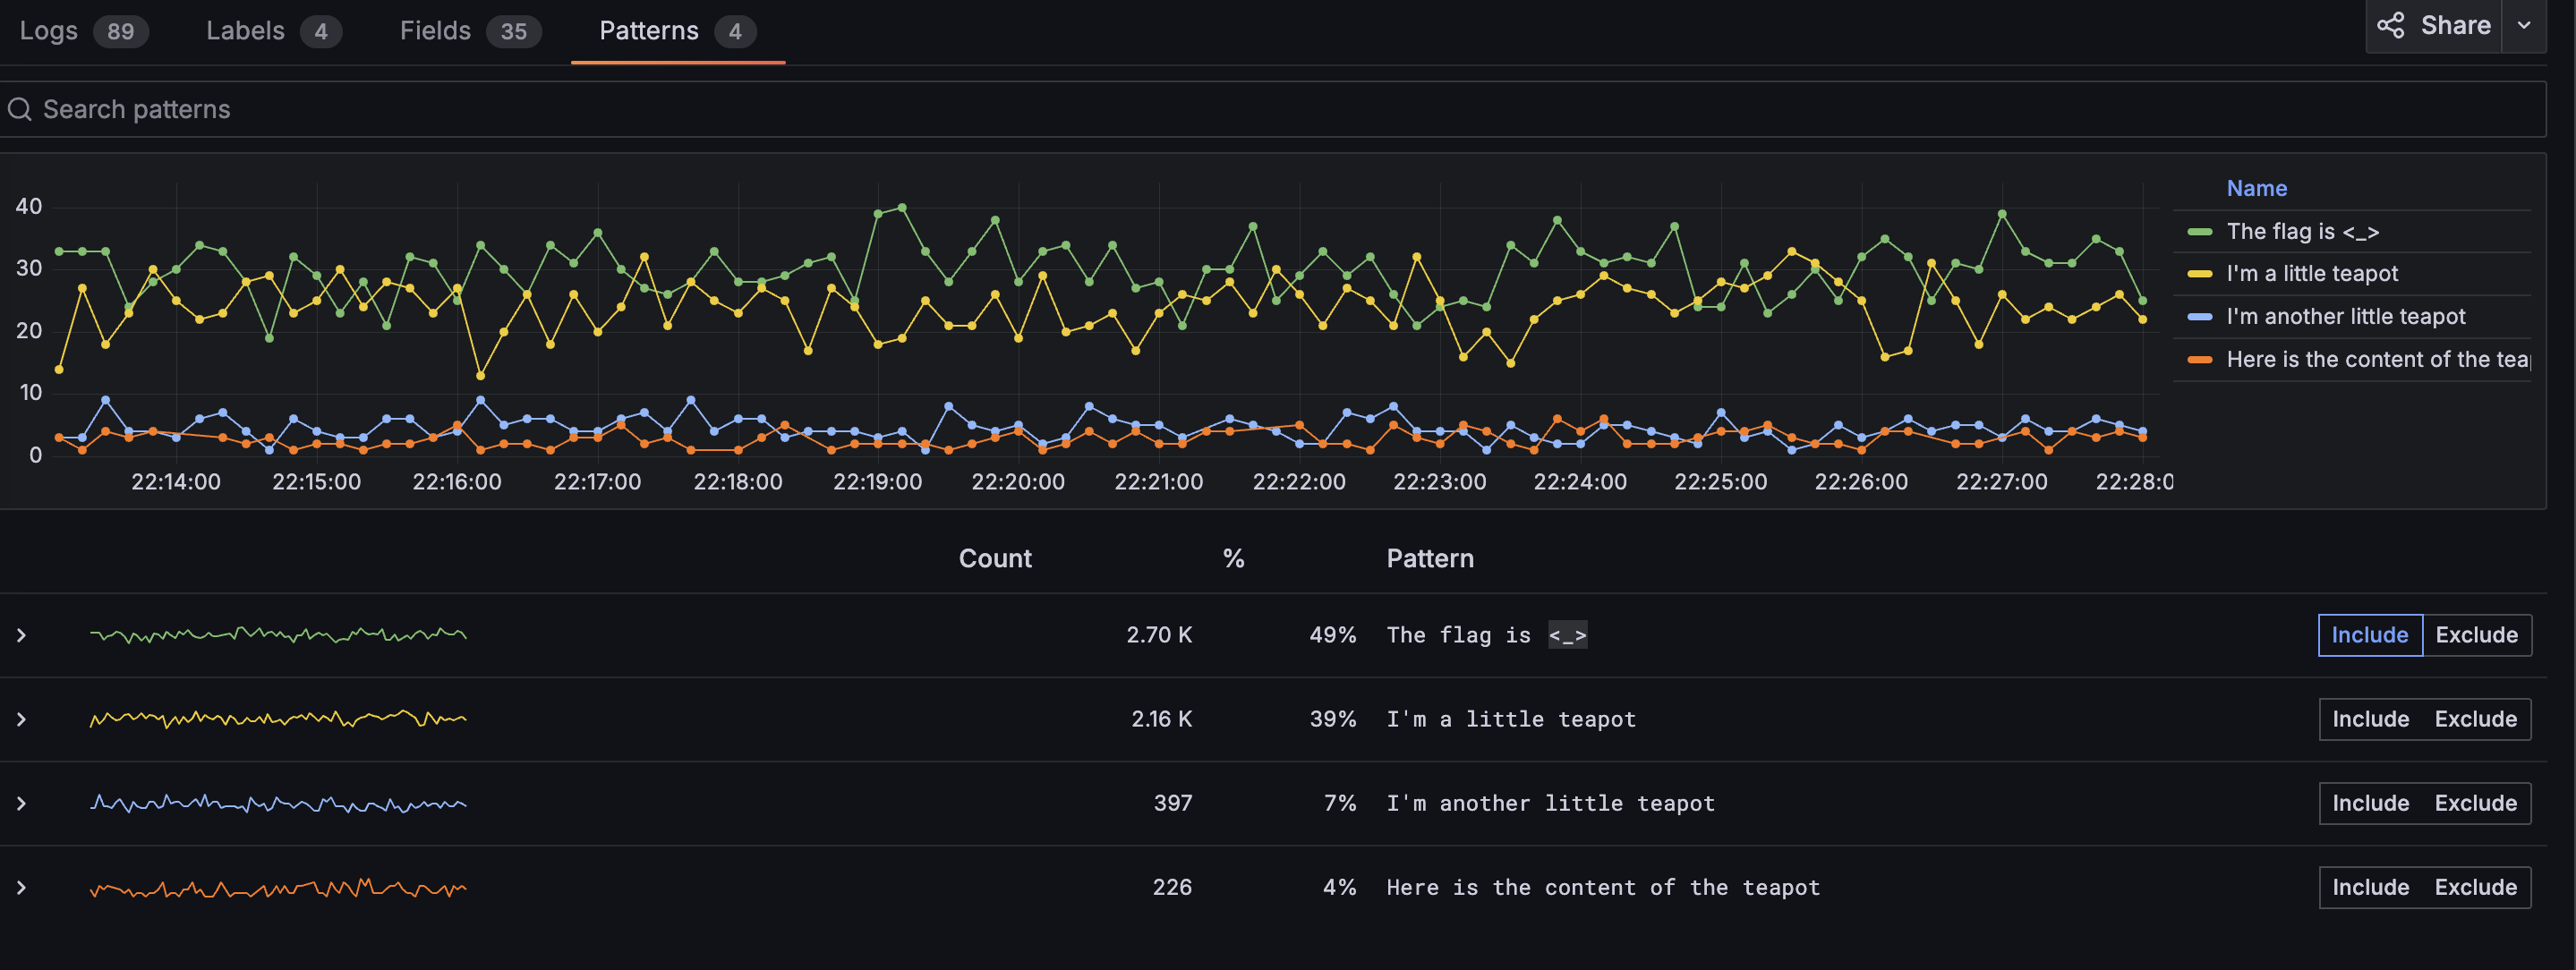
By using log patterns, you can filter logs beyond simple string matching or filtering. In this example, if more flag colors are logged in the future, the log pattern will automatically include the new color.
In your next milestone, you’ll open the logs in Explore view and see the query that generates the log visualization.
Please tell us what didn't work:
At this point in your journey, you can explore the following paths: