View service logs
Logs form one of the pillars of observability, along with metrics, traces, and profiles. In its simplest definition, logs let you know what’s happening to your application.
In this milestone, you’re going to view service logs stored in Loki.
To view logs for a service, complete the following steps:
On the Grafana Cloud home page, open the navigation menu and click Drilldown > Logs.
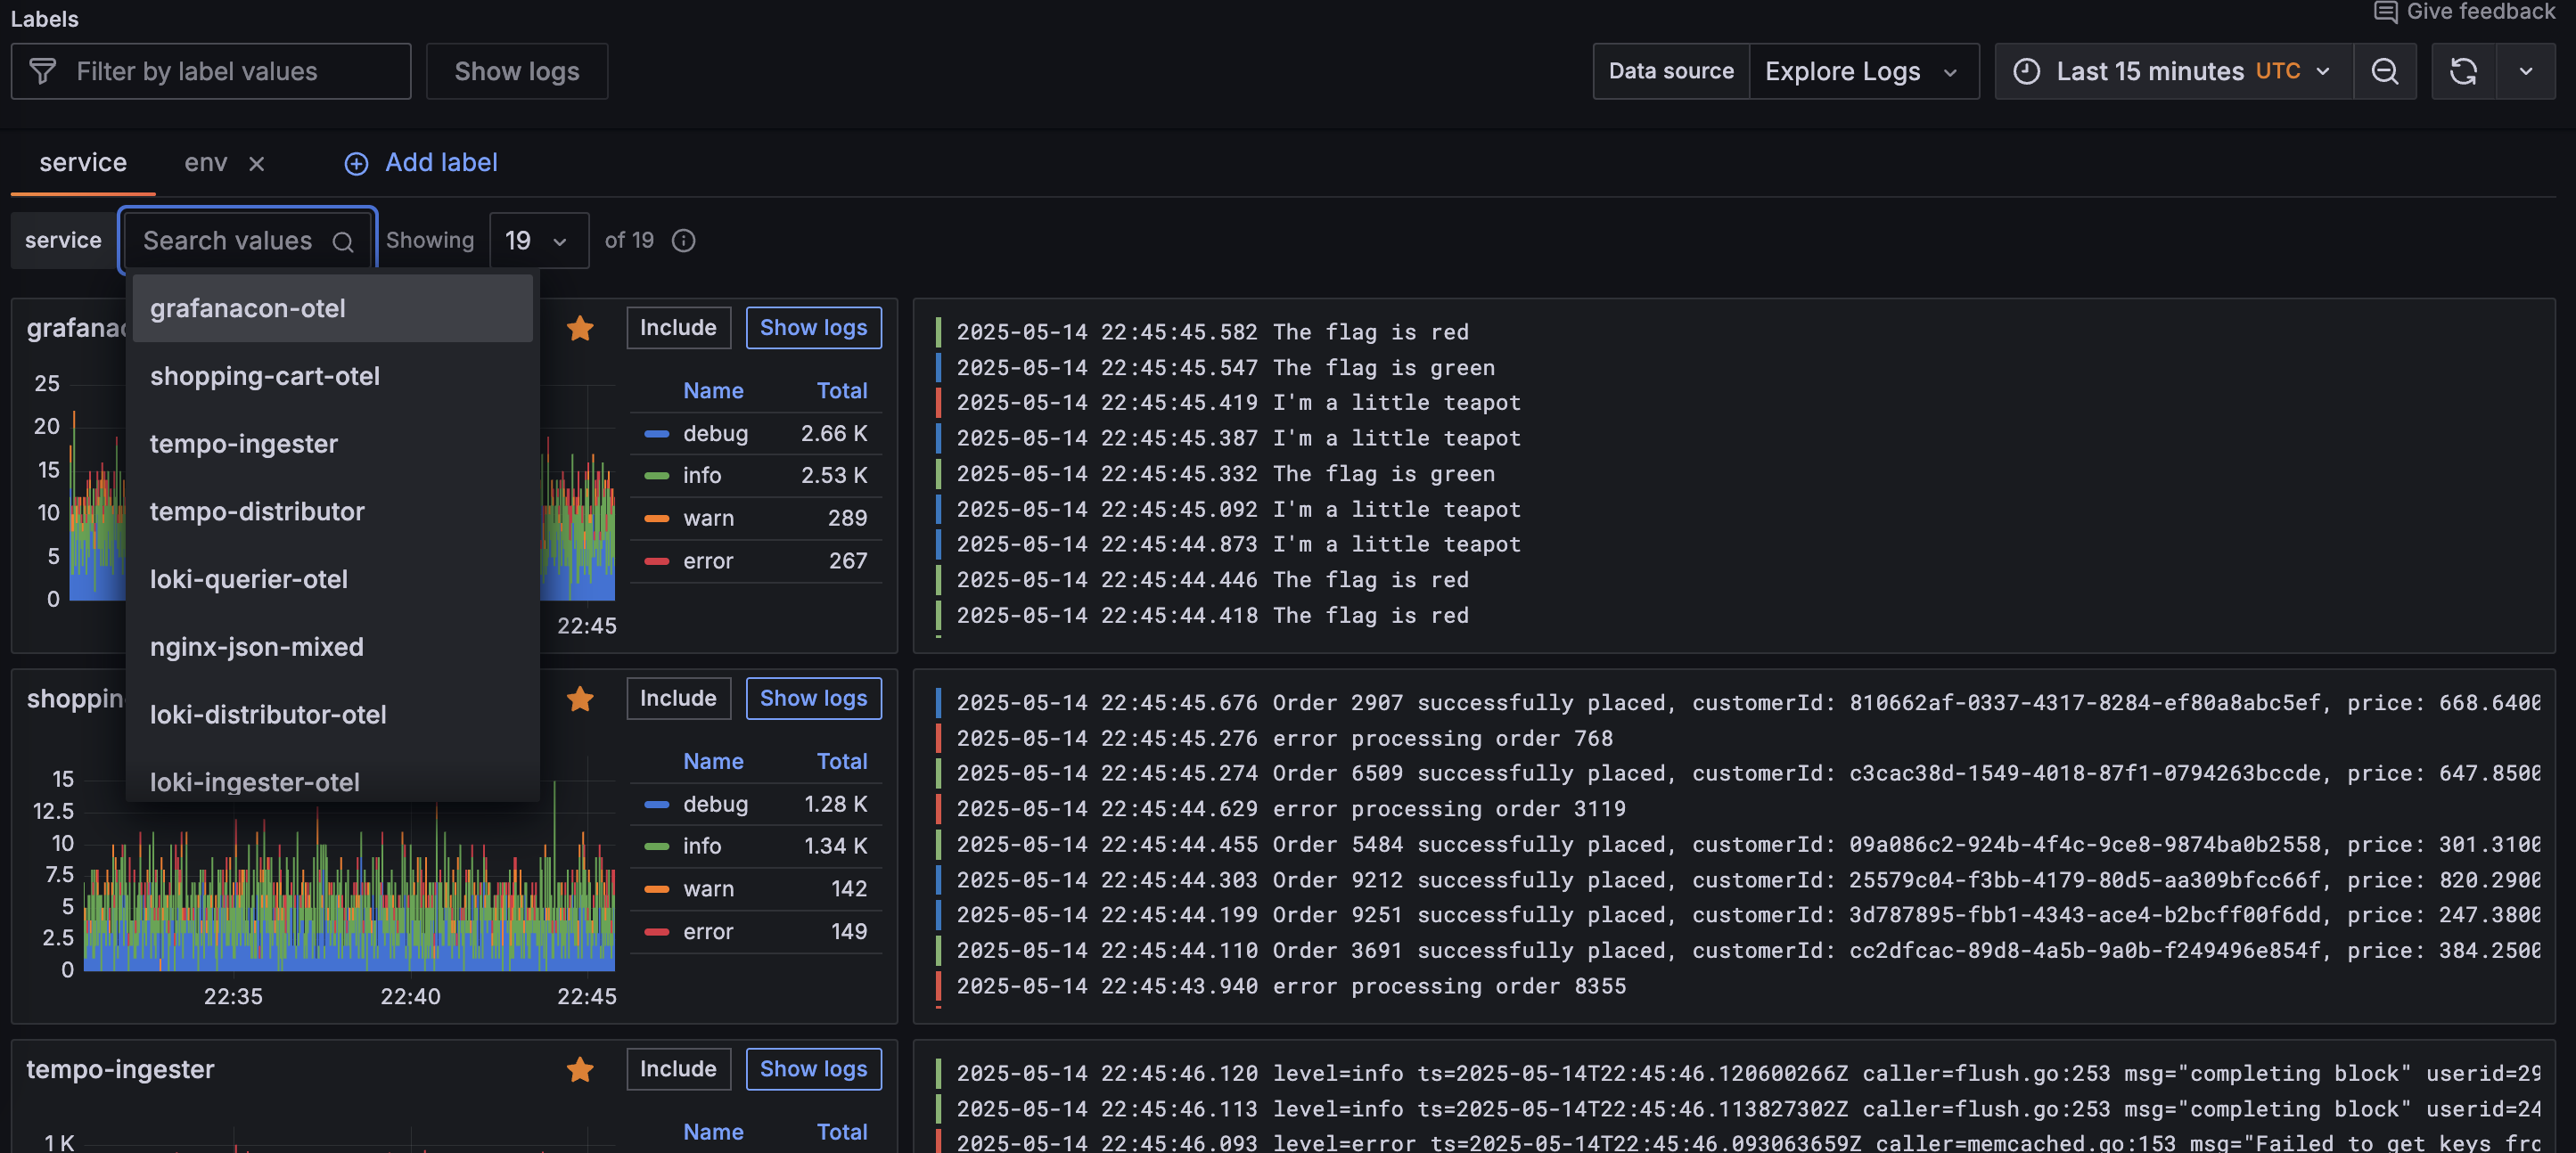
The Logs Drilldown Overview page shows log visualizations and log samples for all the services in your selected Loki instance.
If you have multiple Loki data sources, click the Data source dropdown menu at the top of the page and select the data source you want to query.
If you have multiple services, you can view logs per service by using the service dropdown field to search for the service by name.
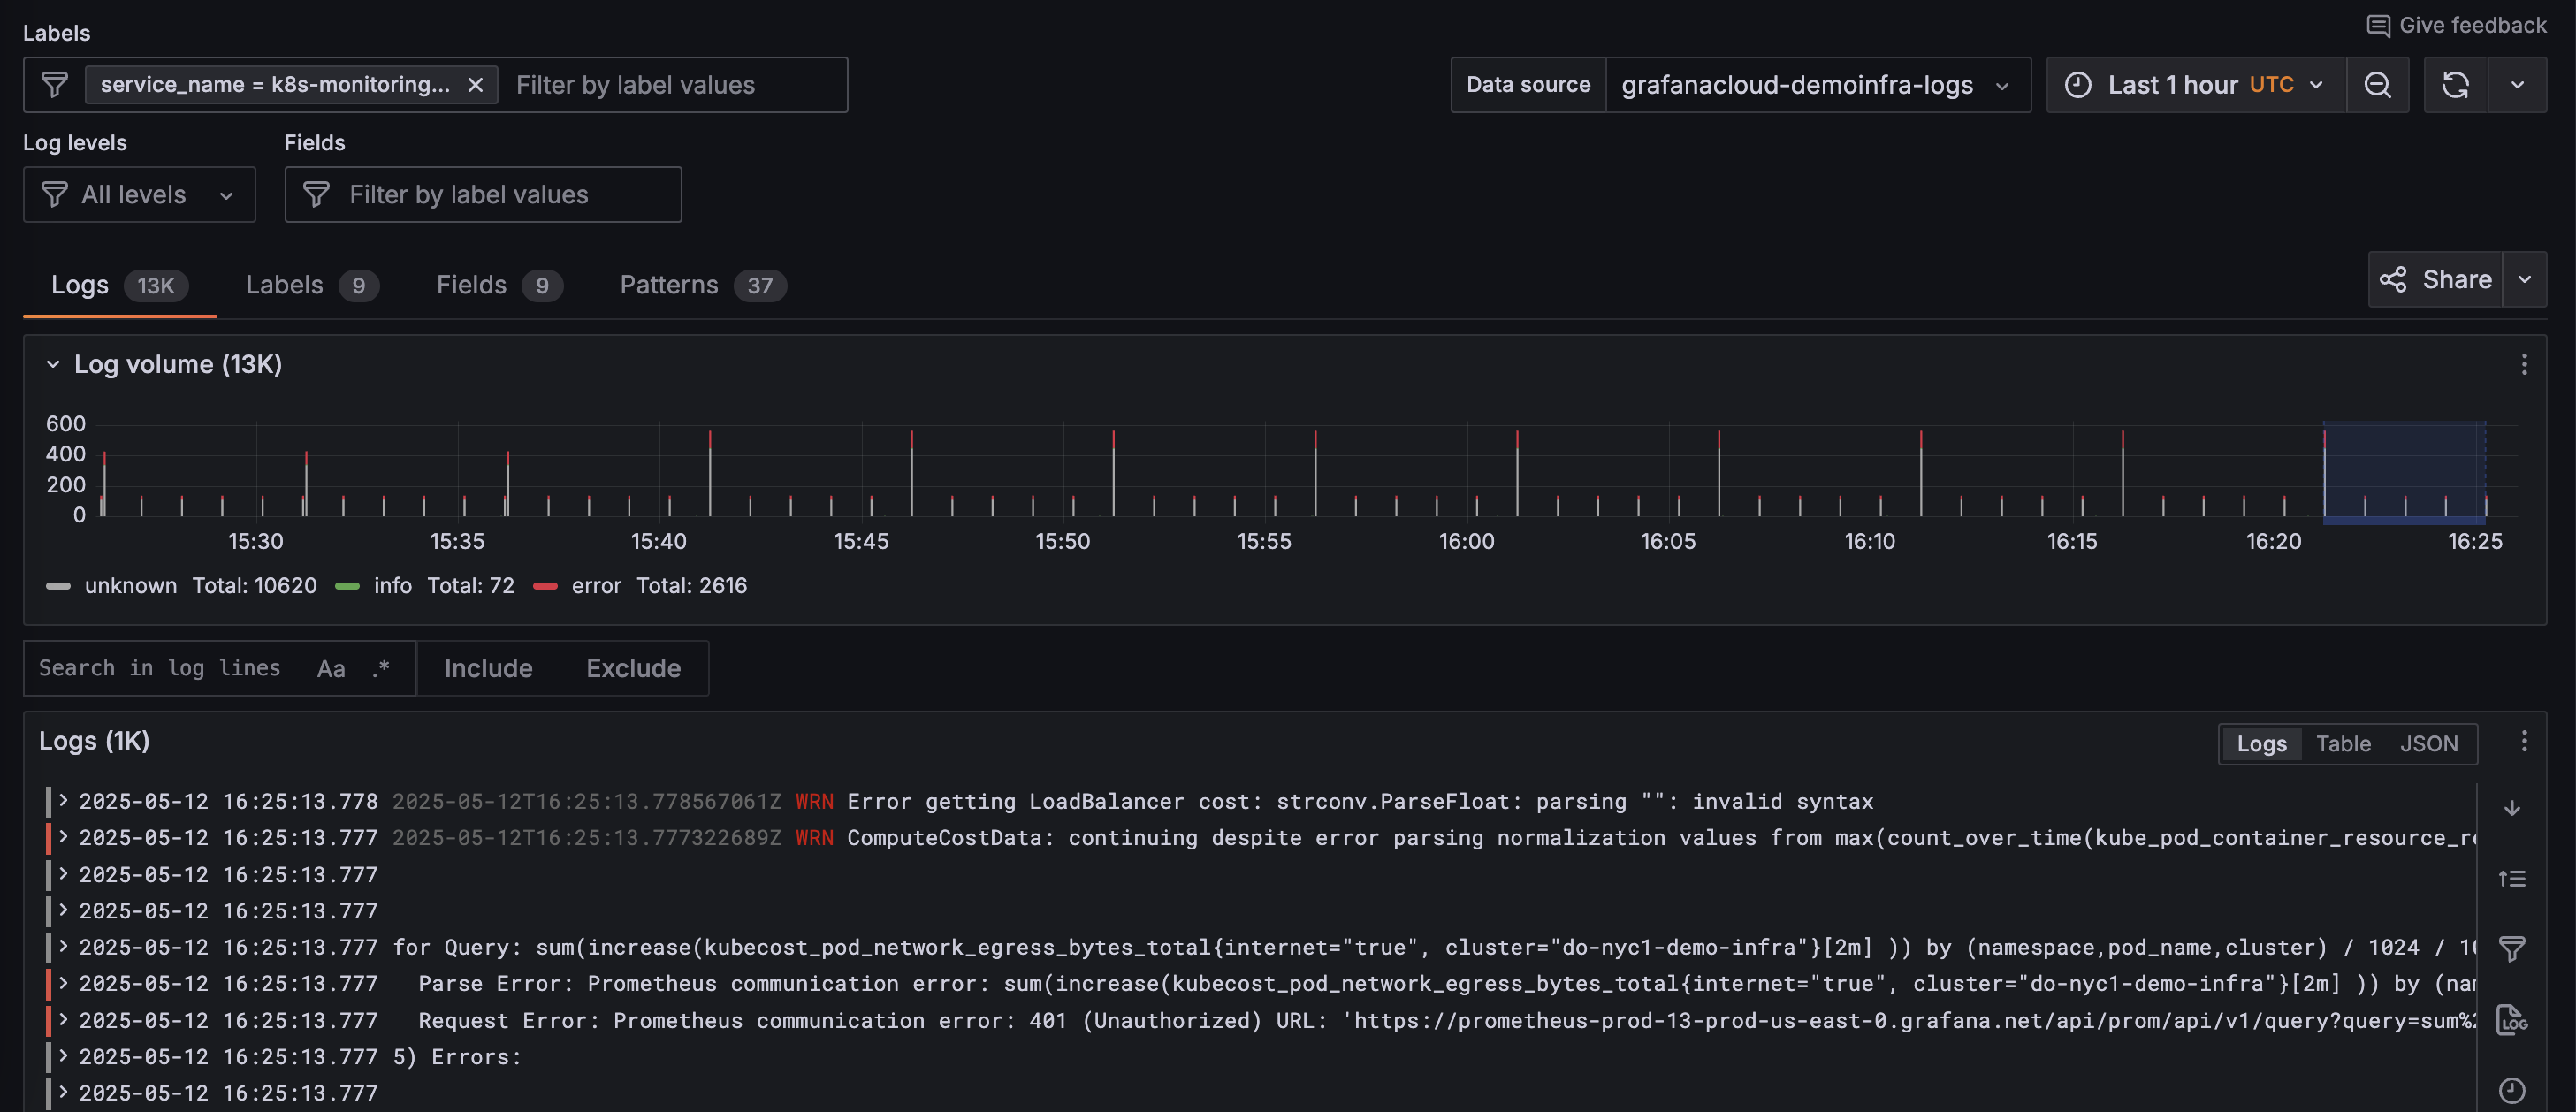
Select the service you want to view by clicking Show logs.
Grafana displays the Logs tab of the service details page.
In the next milestone, you’ll search the logs for your selected service.
Troubleshooting
Explore the following troubleshooting topics if you need help:
Please tell us what didn't work: