Important: This documentation is about an older version. It's relevant only to the release noted, many of the features and functions have been updated or replaced. Please view the current version.
Grafana Cloud Prometheus
Caution
This page includes instructions for running a local test that sends the test results to a Prometheus instance in Grafana Cloud.
For running and managing cloud tests in Grafana Cloud, check out Grafana Cloud k6.
With Grafana Cloud Prometheus and the k6 output for Prometheus remote write, you can send your k6 results output to Grafana Cloud to visualize your testing results. With k6 metrics in Grafana, you can correlate k6 metrics with other metrics of your observability stack.
While this topic uses Grafana Cloud as an example, this approach is compatible with any remote write capable Prometheus installation.
Set up Grafana Cloud Prometheus
Before you start, you need the following:
- A Grafana Cloud account (sign up). The free plan includes 10,000 Prometheus series.
- The URL, username, and password of your Grafana Cloud Prometheus instance to configure the integration.
After you’ve set up your account, follow these steps:
Log in to
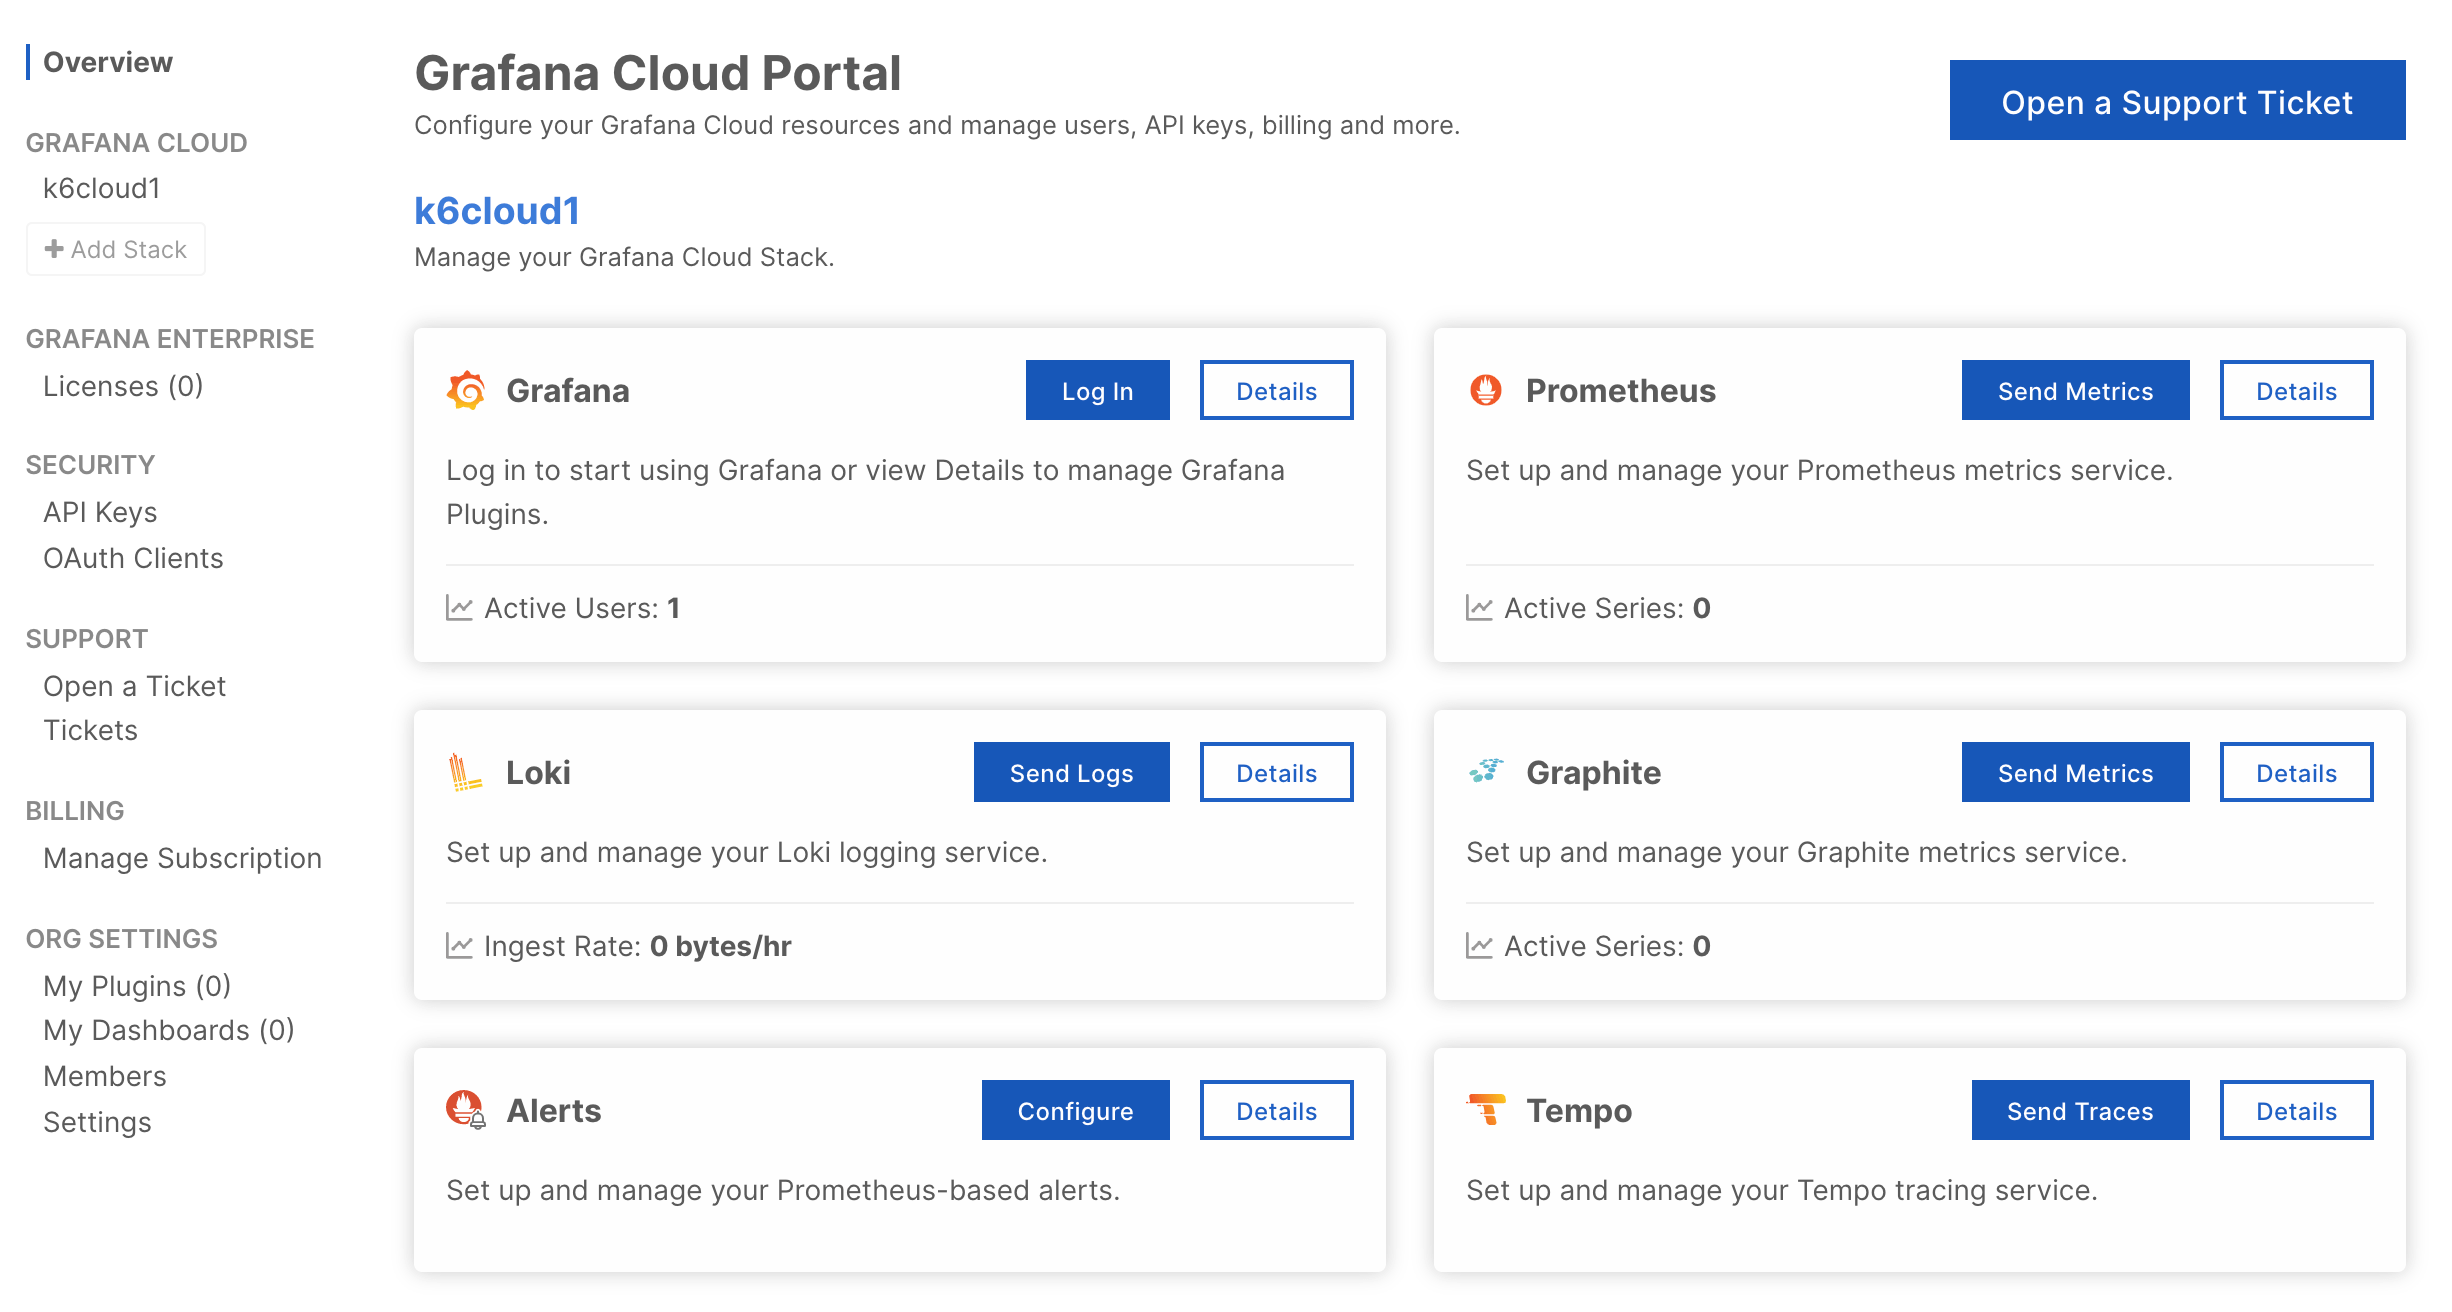
Grafana.comand visit the Cloud Portal. Select the Details of your Prometheus service.![Grafana Cloud Portal]()
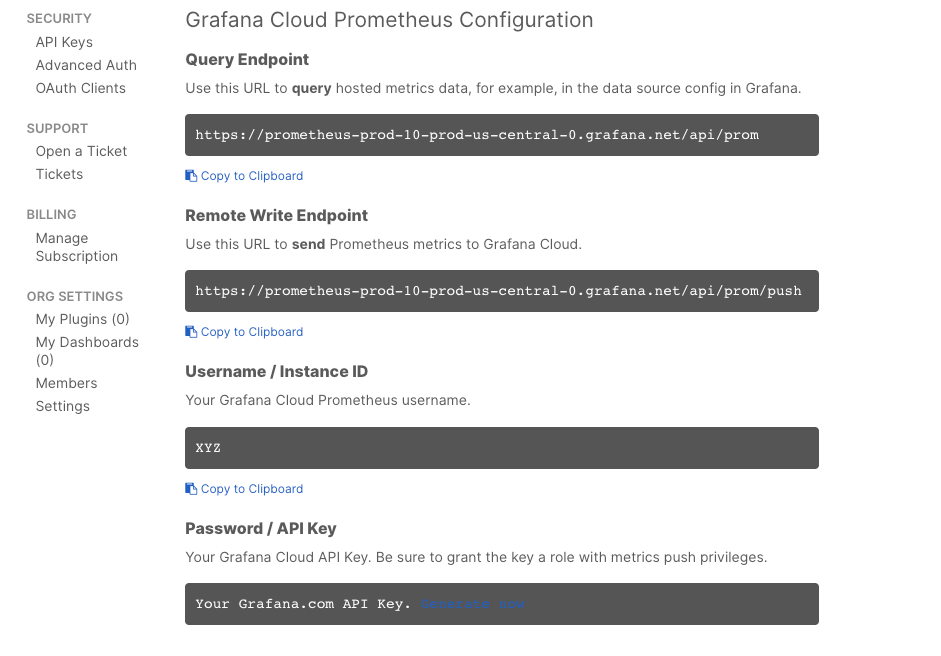
Copy the URL of the Remote Write Endpoint, along with the Username and Instance ID.
![Grafana Cloud Prometheus Configuration]()
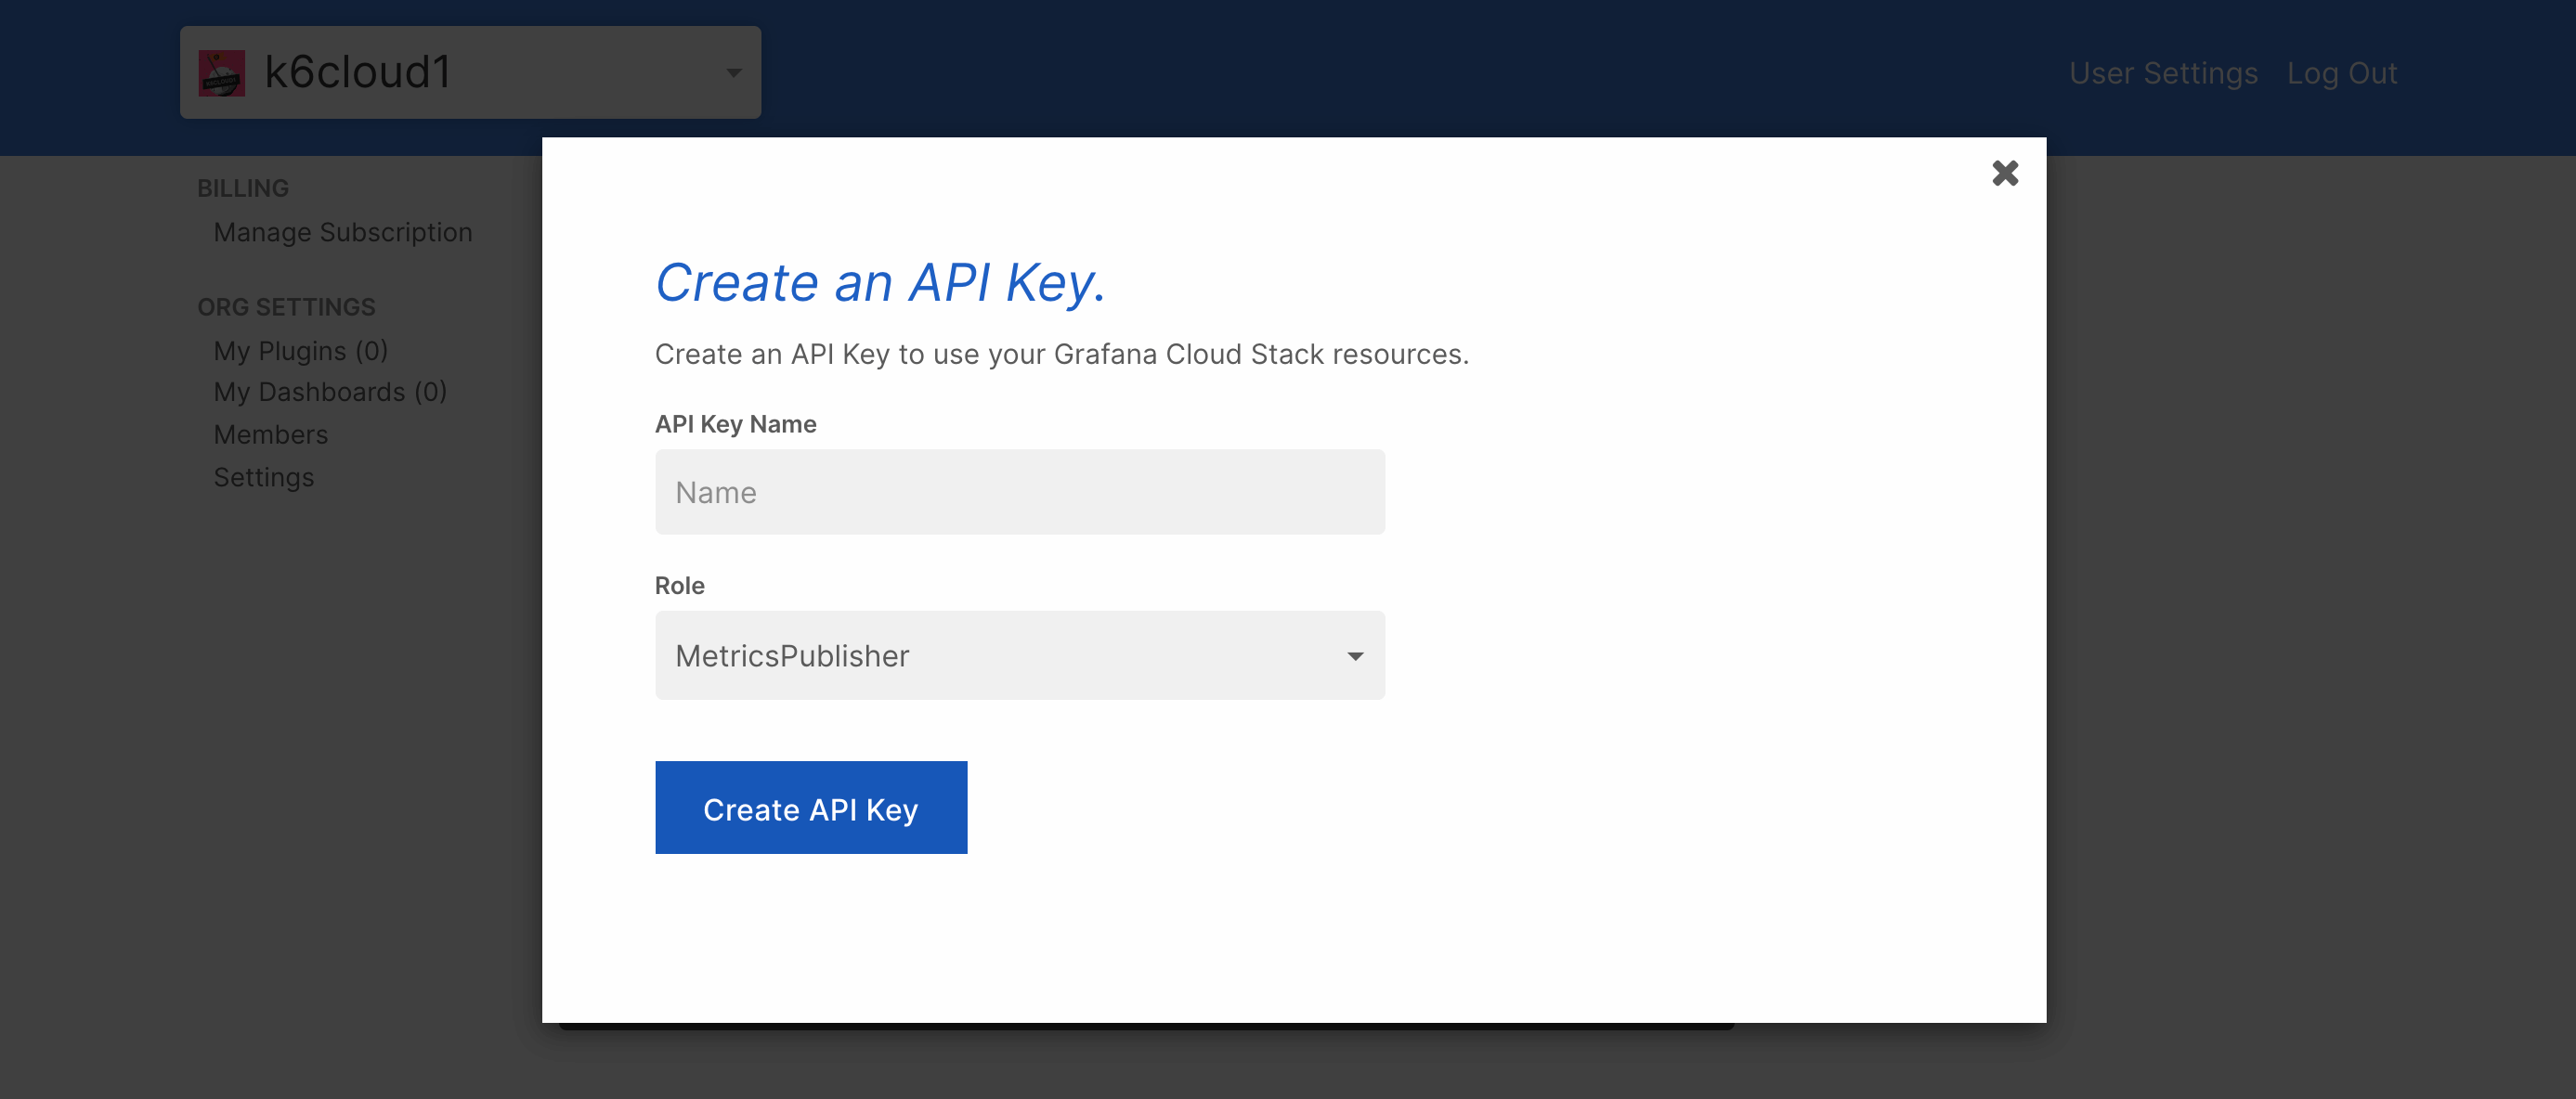
In the Password / API Key section, create and copy an API key of the
MetricsPublisherrole. This will be used as a password.![Create API Key]()
Run the test
Now, pass the Username, API key, and Remote Write Endpoint of the Grafana Cloud Prometheus Configuration to the k6 binary:
K6_PROMETHEUS_RW_USERNAME=USERNAME \
K6_PROMETHEUS_RW_PASSWORD=API_KEY \
K6_PROMETHEUS_RW_SERVER_URL=REMOTE_WRITE_ENDPOINT \
k6 run -o experimental-prometheus-rw script.js
Visualize test results
To visualize test results with Grafana, you can import the k6 Prometheus dashboard by Grafana k6.
On the Dashboards UI:
- Click
Newand selectImport. - Paste the Grafana URL or ID of the dashboard, and click
Load. - Select the Prometheus data source, and click
Import.
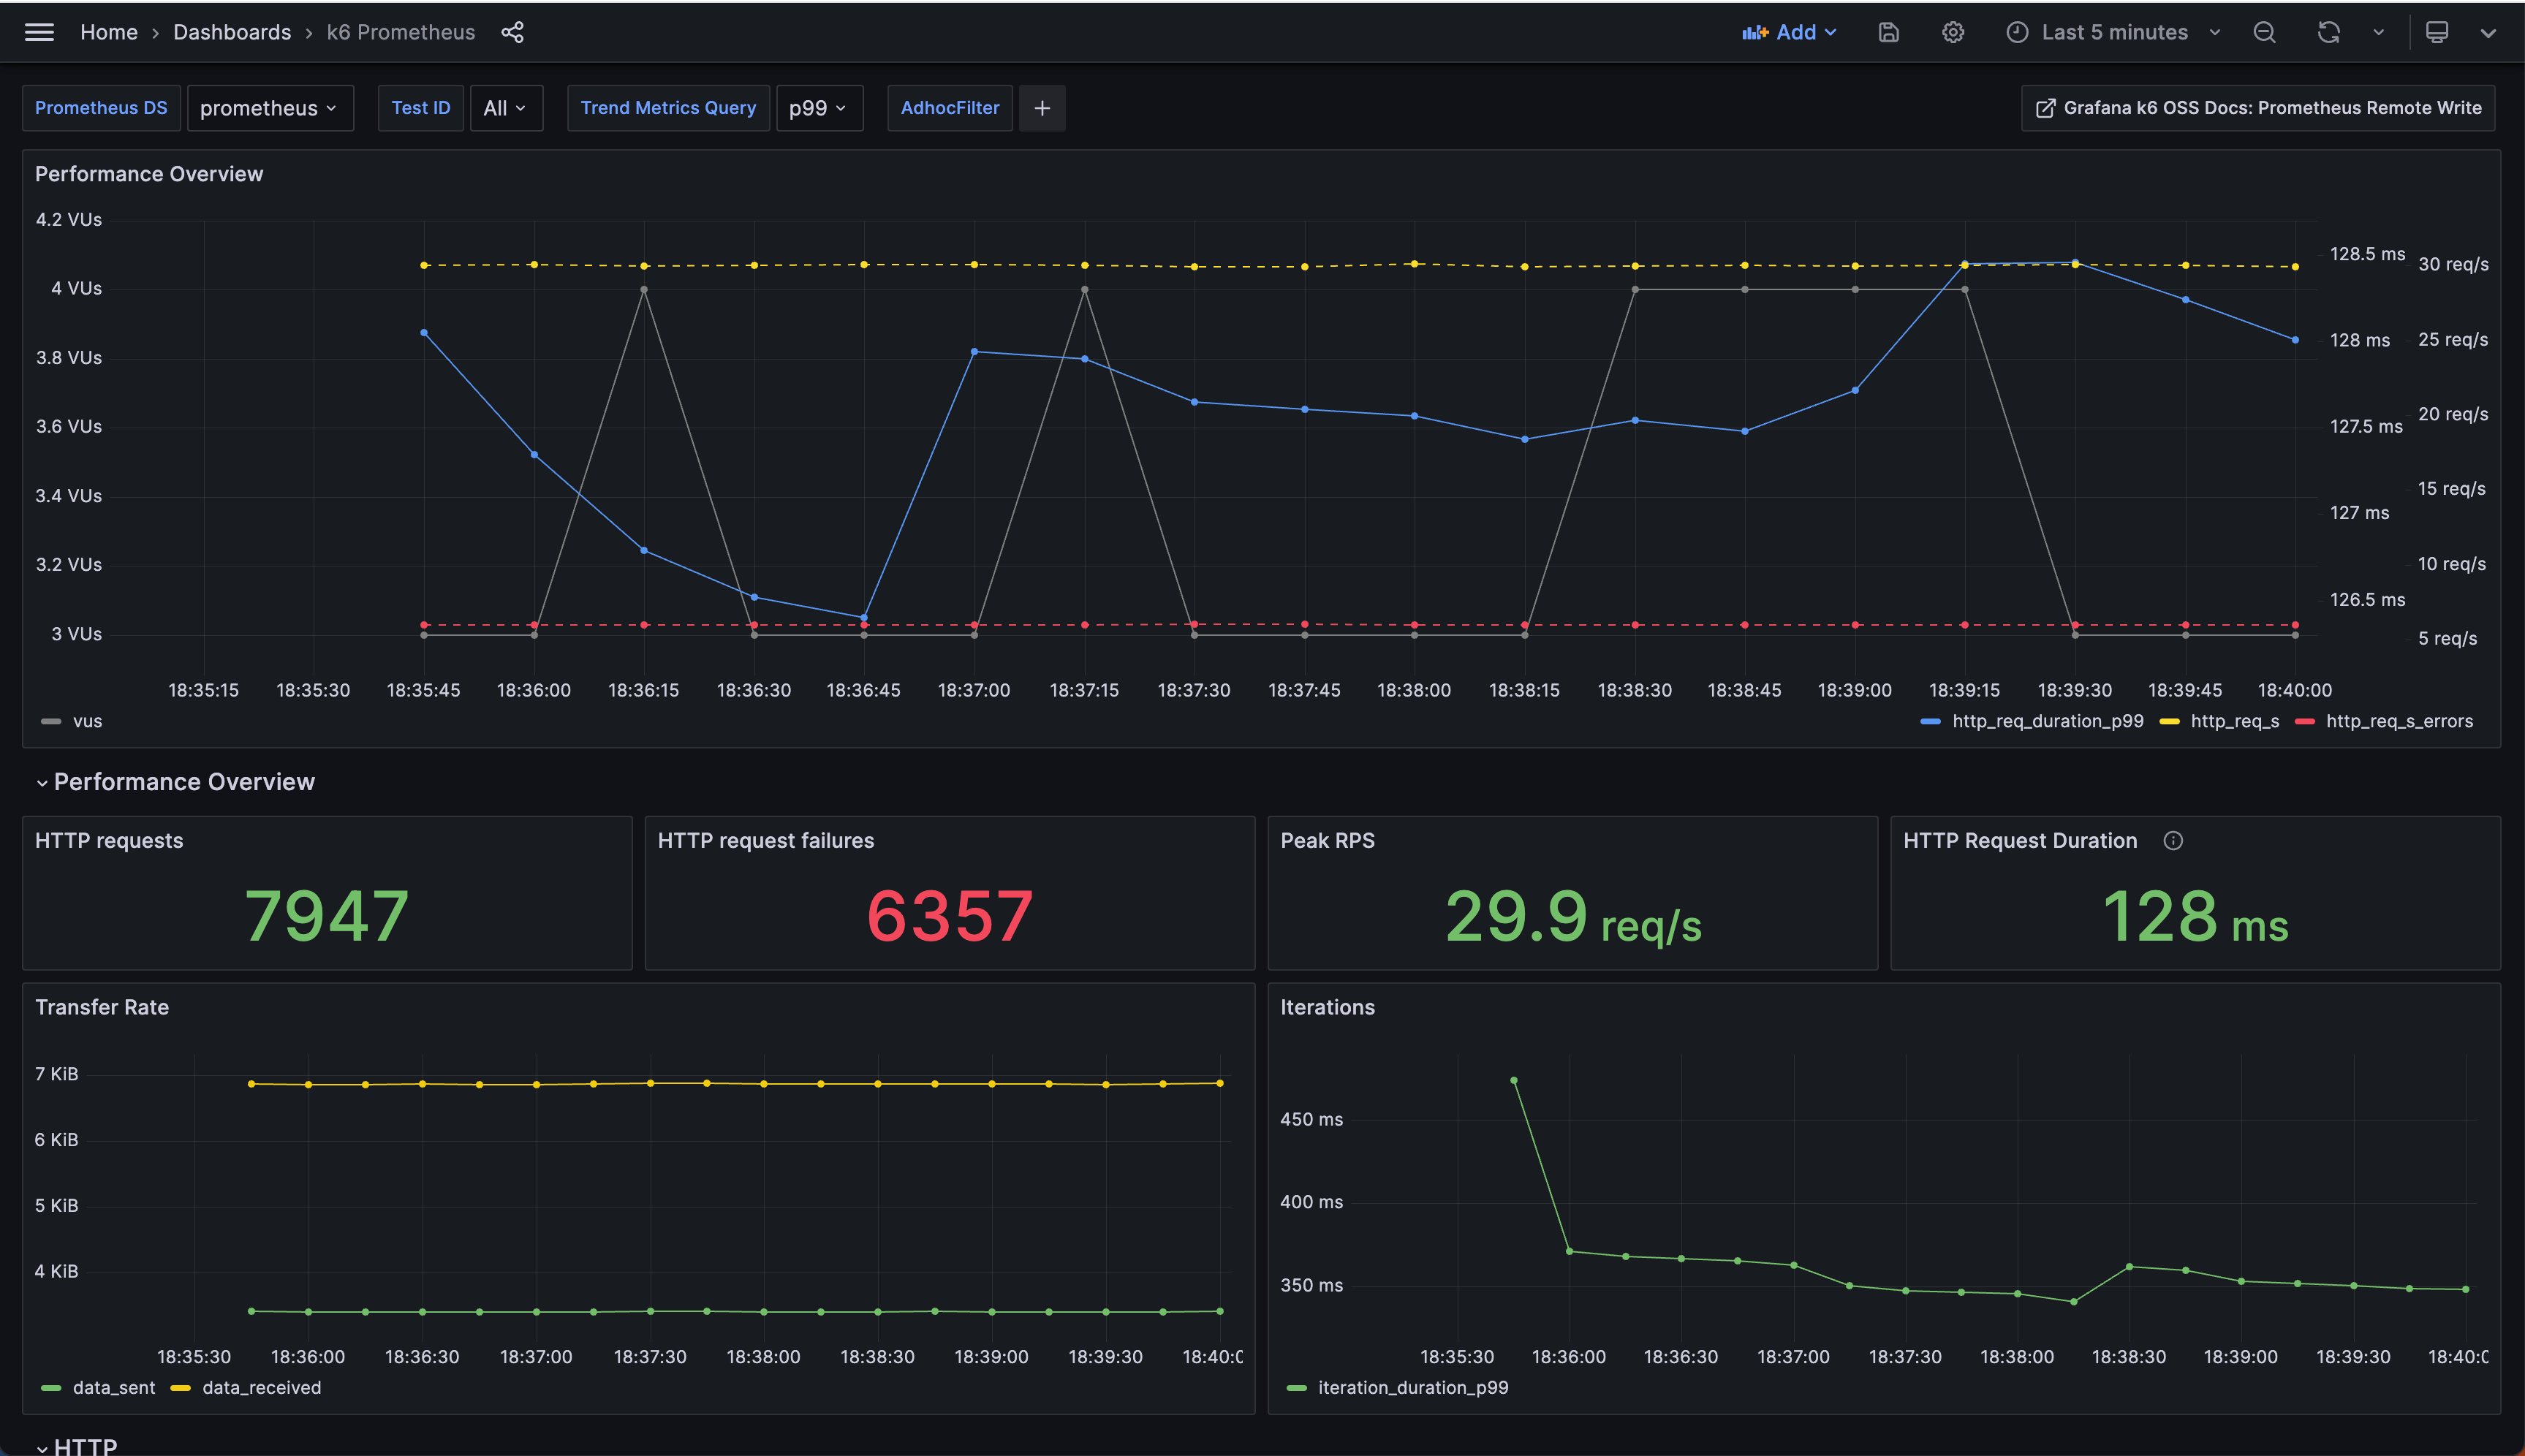
Optionally, when running the test, you can set the testid tag as a wide test tag to filter results of a particular test run on this dashboard (or in PromQL queries). testid can be any unique string that allows you to identify the test run.
K6_PROMETHEUS_RW_USERNAME=USERNAME \
K6_PROMETHEUS_RW_PASSWORD=API_KEY \
K6_PROMETHEUS_RW_SERVER_URL=REMOTE_WRITE_ENDPOINT \
k6 run -o experimental-prometheus-rw --tag testid=TEST_ID script.js
Additionally, you can also use the Explore UI to query k6 time series, design your visualization panels, and add them to any of your existing dashboards.
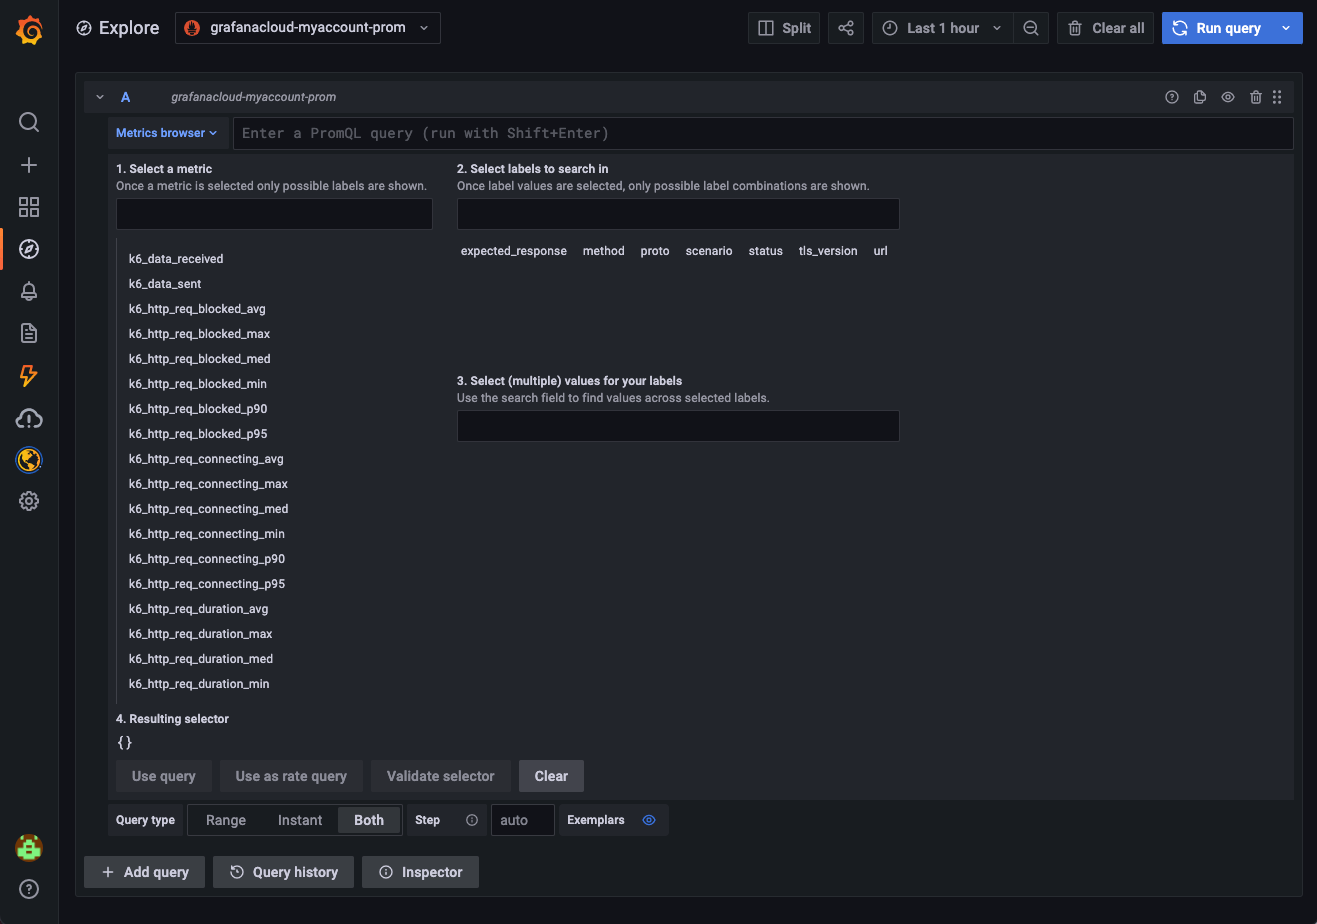
All the k6 time series have a k6_ prefix. For more details, refer to the documentation on the mapping of k6 metrics with Prometheus metrics.
It’s also important to understand the default
Trend metric conversion process and the format and querying limitations. The
K6_PROMETHEUS_RW_TREND_STATS option allows you to convert trend metrics to multiple Prometheus time series. For instance, K6_PROMETHEUS_RW_TREND_STATS=p(95),p(99),max,min transforms each k6 trend metric into four Prometheus metrics as follows:
k6_*_p95k6_*_p99k6_*_maxk6_*_min

