Important: This documentation is about an older version. It's relevant only to the release noted, many of the features and functions have been updated or replaced. Please view the current version.
Jaeger data source
Grafana ships with built-in support for Jaeger, which provides open source, end-to-end distributed tracing. This topic explains configuration and queries specific to the Jaeger data source.
For instructions on how to add a data source to Grafana, refer to the administration documentation. Only users with the organization administrator role can add data sources. Administrators can also configure the data source via YAML with Grafana’s provisioning system.
You can also upload a JSON trace file, and link a trace ID from logs in Loki.
Configure the data source
To access the data source configuration page:
- Hover the cursor over the Configuration (gear) icon.
- Select Data Sources.
- Select the Jaeger data source.
Set the data source’s basic configuration options carefully:
You can also configure settings specific to the Jaeger data source:
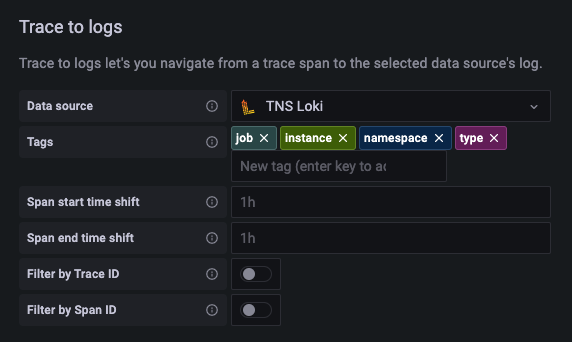
Configure trace to logs

Note: Available in Grafana v7.4 and higher.
The Trace to logs setting configures the trace to logs feature that is available when you integrate Grafana with Jaeger.
To configure trace to logs:
- Select the target data source.
- Select which tags to use in the logs query. The tags you configure must be present in the spans attributes or resources for a trace to logs span link to appear.
- Single tag
- Configuring
jobas a tag and clicking on a span link will take you to your configured logs datasource with the query{job='value from clicked span'}.
- Configuring
- Multiple tags
- If multiple tags are used they will be concatenated so the logs query would look like
{job='value from clicked span', service='value from clicked span'}.
- If multiple tags are used they will be concatenated so the logs query would look like
- Mapped tags
- For a mapped tag
service.namewith valueservice, clicking on a span link will take you to your configured logs datasource with the query{service='value from clicked span'}instead of{service.name='value from clicked span'}. - This is useful for instances where your tracing datasource tags and your logs datasource tags don’t match one-to-one.
- For a mapped tag
- Single tag
The following table describes the ways in which you can configure your trace to logs settings:
Configure trace to metrics
Note: This feature is behind the
traceToMetricsfeature toggle.
The Trace to metrics section configures the trace to metrics feature.
Use the settings to select the target Prometheus data source, and create any desired linked queries.
Each linked query consists of:
- Link Label: (Optional) Descriptive label for the linked query.
- Query: The query ran when navigating from a trace to the metrics data source.
Interpolate tags using the
$__tagskeyword. For example, when you configure the queryrequests_total{$__tags}with the tagsk8s.pod=podandcluster, the result looks likerequests_total{pod="nginx-554b9", cluster="us-east-1"}.
Enable Node Graph
The Node Graph setting enables the Node Graph visualization, which is disabled by default.
Once enabled, Grafana displays the Node Graph after loading the trace view.
Configure the span bar label
The Span bar label section helps you display additional information in the span bar row.
You can choose one of three options:
Provision the data source
You can define and configure the data source in YAML files as part of Grafana’s provisioning system. For more information about provisioning, and for available configuration options, refer to Provisioning Grafana.
Provisioning examples
Using basic auth and the trace-to-logs field:
apiVersion: 1

datasources:
  - name: Jaeger
    type: jaeger
    uid: jaeger-spectra
    access: proxy
    url: http://localhost:16686/
    basicAuth: true
    basicAuthUser: my_user
    editable: true
    isDefault: false
    jsonData:
      tracesToLogs:
        # Field with internal link pointing to a logs data source in Grafana.
        # datasourceUid value must match the datasourceUid value of the logs data source.
        datasourceUid: 'loki'
        tags: ['job', 'instance', 'pod', 'namespace']
        mappedTags: [{ key: 'service.name', value: 'service' }]
        mapTagNamesEnabled: false
        spanStartTimeShift: '1h'
        spanEndTimeShift: '1h'
        filterByTraceID: false
        filterBySpanID: false
      tracesToMetrics:
        datasourceUid: 'prom'
        tags: [{ key: 'service.name', value: 'service' }, { key: 'job' }]
        queries:
          - name: 'Sample query'
            query: 'sum(rate(traces_spanmetrics_latency_bucket{$__tags}[5m]))'
    secureJsonData:
      basicAuthPassword: my_password
Query traces
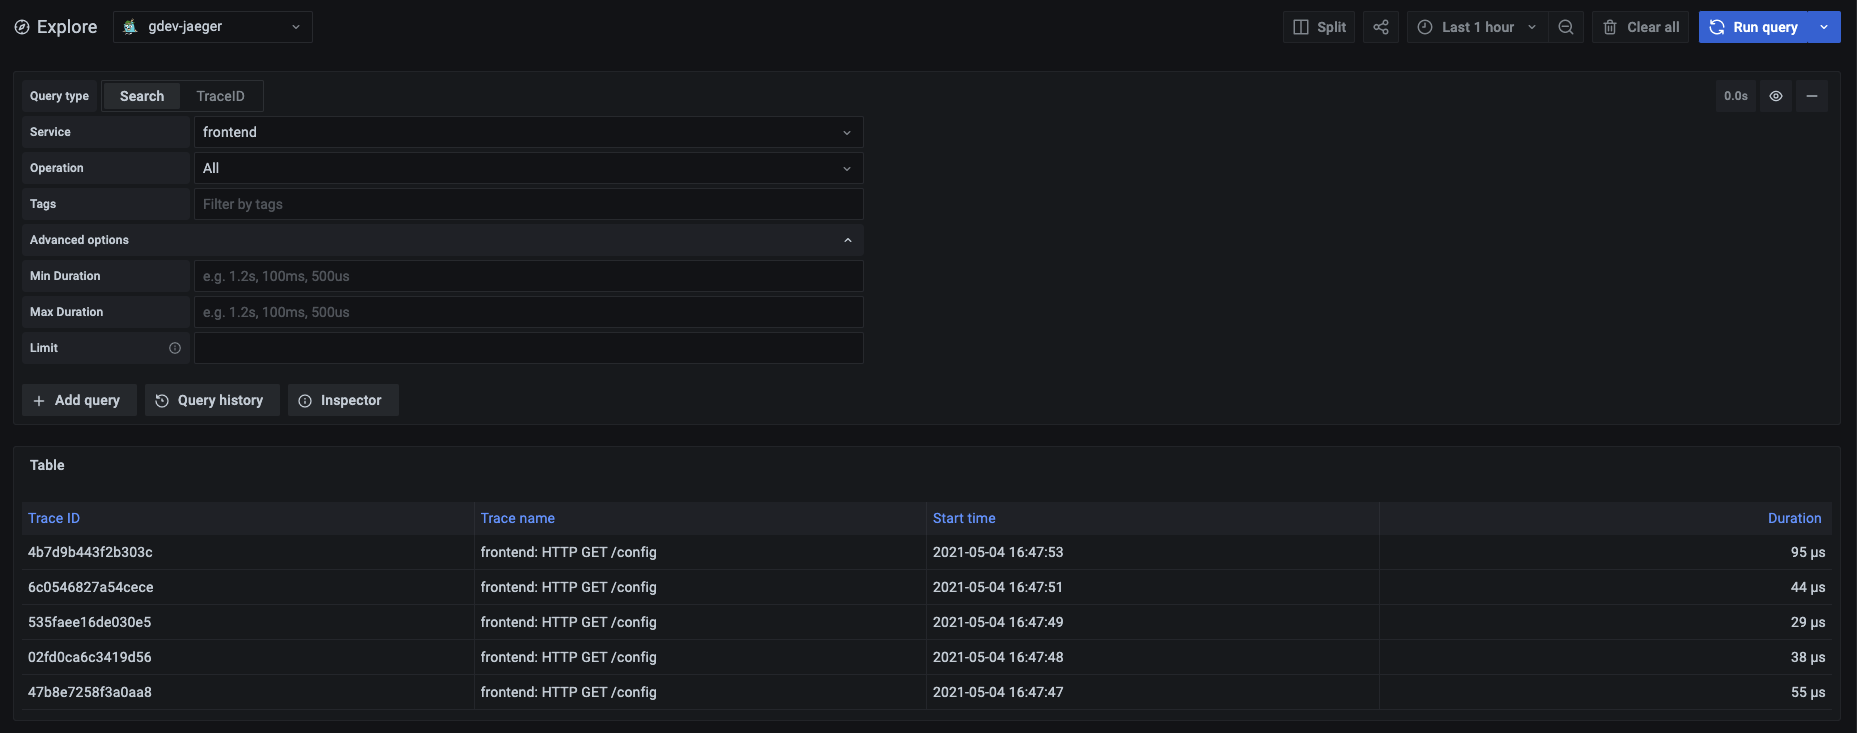
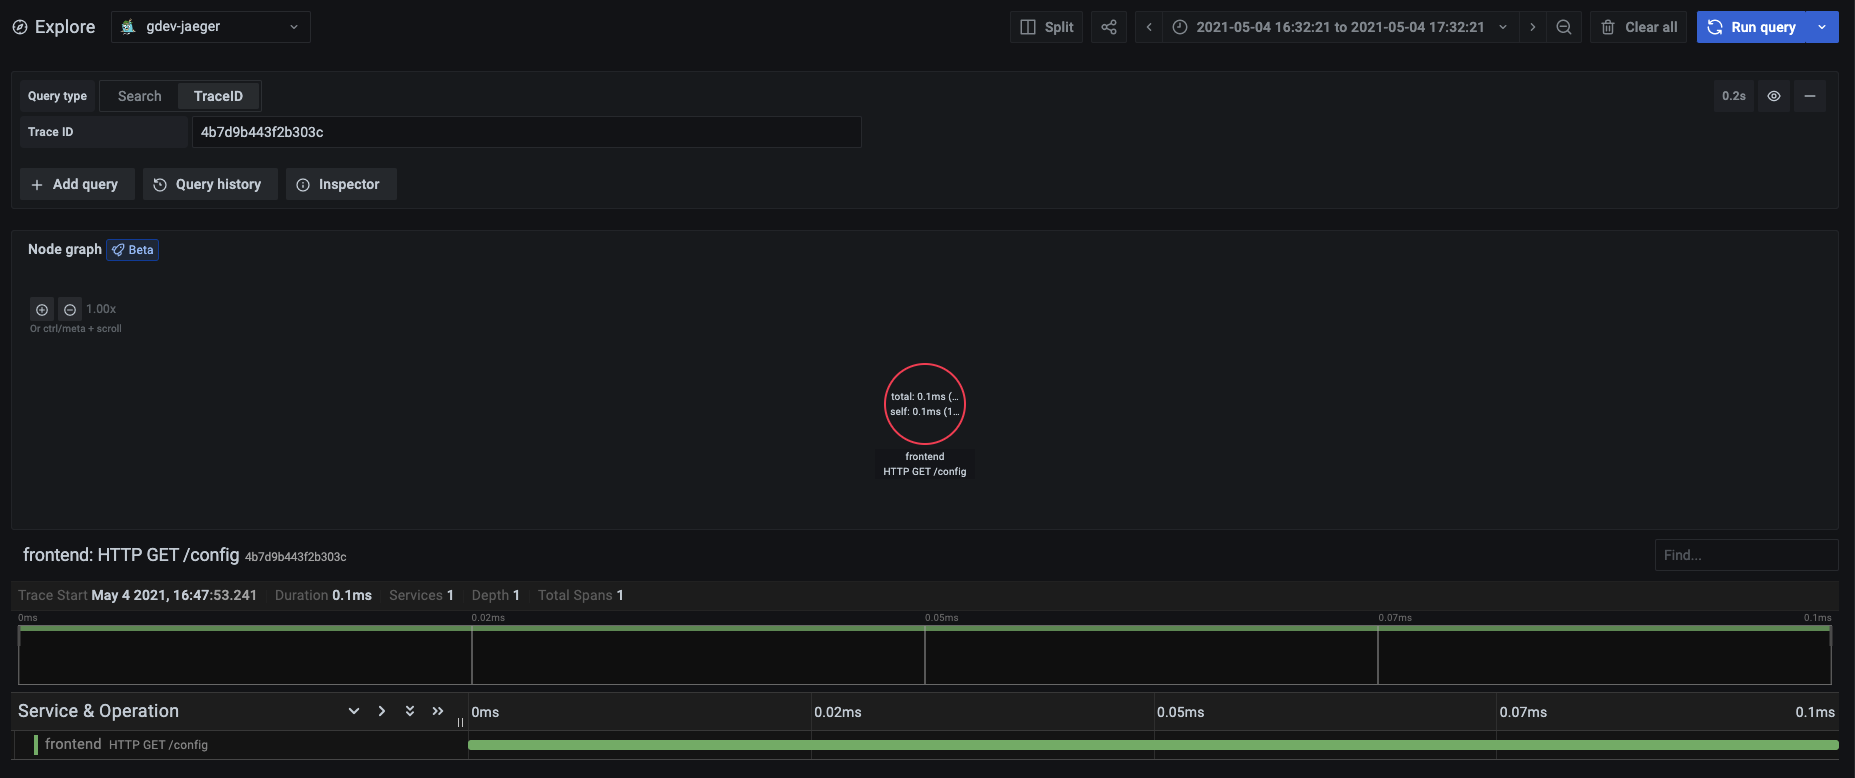
You can query and display traces from Jaeger via Explore.

You can query by trace ID, or use the search form to find traces.
Query by trace ID

To query by trace ID:
- Select TraceID from the Query type selector.
- Insert the ID into the text input.
Query by search
To search for traces:
- Select Search from the Query type selector.
- Fill out the search form:
Upload a JSON trace file
You can upload a JSON file that contains a single trace and visualize it. If the file has multiple traces, Grafana visualizes its first trace.

Trace JSON example
{
  "data": [
    {
      "traceID": "2ee9739529395e31",
      "spans": [
        {
          "traceID": "2ee9739529395e31",
          "spanID": "2ee9739529395e31",
          "flags": 1,
          "operationName": "CAS",
          "references": [],
          "startTime": 1616095319593196,
          "duration": 1004,
          "tags": [
            {
              "key": "sampler.type",
              "type": "string",
              "value": "const"
            }
          ],
          "logs": [],
          "processID": "p1",
          "warnings": null
        }
      ],
      "processes": {
        "p1": {
          "serviceName": "loki-all",
          "tags": [
            {
              "key": "jaeger.version",
              "type": "string",
              "value": "Go-2.25.0"
            }
          ]
        }
      },
      "warnings": null
    }
  ],
  "total": 0,
  "limit": 0,
  "offset": 0,
  "errors": null
}
Link a trace ID from logs
You can link to a Jaeger trace from logs in Loki by configuring a derived field with an internal link.
For details, refer to Derived fields section of the Loki data source documentation.


