Important: This documentation is about an older version. It's relevant only to the release noted, many of the features and functions have been updated or replaced. Please view the current version.
InfluxDB query editor
This topic explains querying specific to the InfluxDB data source. For general documentation on querying data sources in Grafana, see Query and transform data.
Choose a query editing mode
The InfluxDB data source’s query editor has two modes depending on your choice of query language in the data source configuration:
You also use the query editor to retrieve log data and annotate visualizations.
InfluxQL query editor
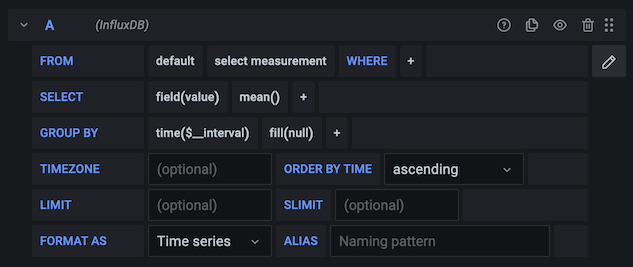
The InfluxQL query editor helps you select metrics and tags to create InfluxQL queries.
To enter edit mode:
- Click the panel title.
- Click Edit.

Filter data (WHERE)
To add a tag filter, click the plus icon to the right of the WHERE condition.
To remove tag filters, click the tag key, then select –remove tag filter–.
Match by regular expressions
You can enter regular expressions for metric names or tag filter values.
Wrap the regex pattern in forward slashes (/).
Grafana automatically adjusts the filter tag condition to use the InfluxDB regex match condition operator (=~).
Field and aggregation functions
In the SELECT row, you can specify which fields and functions to use.
If you have a group by time, you must have an aggregation function.
Some functions like derivative also require an aggregation function.
The editor helps you build this part of the query. For example:
![]()
This query editor input generates an InfluxDB SELECT clause:
SELECT derivative(mean("value"), 10s) /10 AS "REQ/s" FROM ....To select multiple fields:
Click the plus button.
Select Field > field to add another
SELECTclause.You can also
SELECTan asterisk (*) to select all fields.
Group query results
To group results by a tag, define it in a “Group By”.
To group by a tag:
- Click the plus icon at the end of the GROUP BY row.
- Select a tag from the dropdown that appears.
To remove the “Group By”:
- Click the tag.
- Click the “x” icon.
Text editor mode (RAW)
You can write raw InfluxQL queries by switching the editor mode. However, be careful when writing queries manually.
If you use raw query mode, your query must include at least WHERE $timeFilter.
Also, always provide a group by time and an aggregation function. Otherwise, InfluxDB can easily return hundreds of thousands of data points that can hang your browser.
To switch to raw query mode:
- Click the hamburger icon.
- Toggle Switch editor mode.
Alias patterns
You can also use [[tag_hostname]] pattern replacement syntax.
For example, entering the value Host: [[tag_hostname]] in the ALIAS BY field replaces it with the hostname tag value for each legend value.
An example legend value would be Host: server1.
Flux query editor
Grafana supports Flux when running InfluxDB v1.8 and higher. If your data source is configured for Flux, you can use the Flux query and scripting language in the query editor, which serves as a text editor for raw Flux queries with macro support.
For more information and connection details, refer to 1.8 compatibility.
Use macros
You can enter macros in the query to replace them with values from Grafana’s context. Macros support copying and pasting from Chronograf.
For example, the query editor interpolates this query:
from(bucket: v.defaultBucket)
  |> range(start: v.timeRangeStart, stop: v.timeRangeStop)
  |> filter(fn: (r) => r["_measurement"] == "cpu" or r["_measurement"] == "swap")
  |> filter(fn: (r) => r["_field"] == "usage_system" or r["_field"] == "free")
  |> aggregateWindow(every: v.windowPeriod, fn: mean)
  |> yield(name: "mean")
Into this query to send to InfluxDB, with interval and time period values changing according to the active time selection:
from(bucket: "grafana")
  |> range(start: 2020-06-11T13:59:07Z, stop: 2020-06-11T14:59:07Z)
  |> filter(fn: (r) => r["_measurement"] == "cpu" or r["_measurement"] == "swap")
  |> filter(fn: (r) => r["_field"] == "usage_system" or r["_field"] == "free")
  |> aggregateWindow(every: 2s, fn: mean)
  |> yield(name: "mean")
To view the interpolated version of a query with the query inspector, refer to Panel Inspector.
Query logs
You can query and display log data from InfluxDB in Explore and with the Logs panel for dashboards.
Select the InfluxDB data source, then enter a query to display your logs.
Create log queries
The Logs Explorer next to the query field, accessed by the Measurements/Fields button, lists measurements and fields. Choose the desired measurement that contains your log data, then choose which field to use to display the log message.
Once InfluxDB returns the result, the log panel lists log rows and displays a bar chart, where the x axis represents the time and the y axis represents the frequency/count.
Filter search
To add a filter, click the plus icon to the right of the Measurements/Fields button, or next to a condition.
To remove tag filters, click the first select, then choose –remove filter–.
Apply annotations
Annotations overlay rich event information on top of graphs. You can add annotation queries in the Dashboard menu’s Annotations view.
For InfluxDB, your query must include WHERE $timeFilter.
If you select only one column, you don’t need to enter anything in the column mapping fields.
The Tags field’s value can be a comma-separated string.
Annotation query example
SELECT title, description from events WHERE $timeFilter ORDER BY time ASC

