
Important: This documentation is about an older version. It's relevant only to the release noted, many of the features and functions have been updated or replaced. Please view the current version.
Geomap
The Geomap panel visualization allows you to view and customize the world map using geospatial data. You can configure various overlay styles and map view settings to easily focus on the important location-based characteristics of the data.

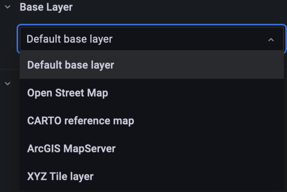
Base layer
The base layer loads in a blank world map from the tile server to the Grafana panel. Several base layer options are available each with specific configuration options to style the base map. The default base layer is CartoDB base map. Custom default base layers can be defined in the .ini configuration file.
Configure the default base layer with provisioning
You can configure the default base map using config files with Grafana’s provisioning system. For more information on all the settings, refer to the provisioning docs page.
Use the JSON configuration option default_baselayer_config to define the default base map. There are currently four base map options to choose from: carto, esri-xyz, osm-standard, xyz. Here are some provisioning examples for each base map option.
- carto loads the CartoDB tile server. You can choose from
auto,dark, andlighttheme for the base map and can be set as shown below. TheshowLabelstag determines whether or not Grafana shows the Country details on top of the map. Here is an example:
geomap_default_baselayer = `{
  "type": "carto",
  "config": {
    "theme": "auto",
    "showLabels": true
  }
}`- esri-xyz loads the ESRI tile server. There are already multiple server instances implemented to show the various map styles:
world-imagery,world-physical,topo,usa-topo, andocean. Thecustomserver option allows you to configure your own ArcGIS map server. Here are some examples:
geomap_default_baselayer = `{
  "type": "esri-xyz",
  "config": {
    "server": "world-imagery"
  }
}`geomap_default_baselayer = `{
"type": "esri-xyz",
"config": {
"server": "custom",
"url": "[tile server url]",
"attribution": "[tile server attribution]"
}
}`- osm-standard loads the OpenStreetMap tile server. There are no additional configurations needed and the
configfields can be left blank. Here is an example:
default_baselayer_config = `{
  "type": "osm-standard",
  "config": {}
}`- xyz loads a custom tile server defined by the user. Set a valid tile server
url, with {z}/{x}/{y} for this option in order to properly load a default base map. Here is an example:
default_baselayer_config = `{
  "type": "xyz",
  "config": {
    "attribution": "Open street map",
    "url": "https://tile.openstreetmap.org/{z}/{x}/{y}.png"
  }
}`
enable_custom_baselayers allows you to enable or disable custom open source base maps that are already implemented. The default is true.
Data layer
The data layer in the Geomap plugin determines how you visualize geospatial data on top of the base map.
Location
The Geomap panel needs a source of geographical data. This data comes from a database query, and there are four mapping options for your data.
- Auto automatically searches for location data. Use this option when your query is based on one of the following names for data fields.
- geohash: “geohash”
- latitude: “latitude”, “lat”
- longitude: “longitude”, “lng”, “lon”
- lookup: “lookup”
- Coords specifies that your query holds coordinate data. You will get prompted to select numeric data fields for latitude and longitude from your database query.
- Geohash specifies that your query holds geohash data. You will get prompted to select a string data field for the geohash from your database query.
- Lookup specifies that your query holds location name data that needs to be mapped to a value. You will get prompted to select the lookup field from your database query and a gazetteer. The gazetteer is the directory that is used to map your queried data to a geographical point.
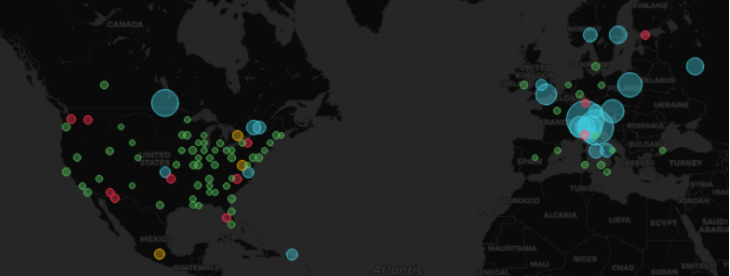
Markers layer
The markers layer allows you to display data points as different marker shapes such as circle, squares, triangles, stars, and more.
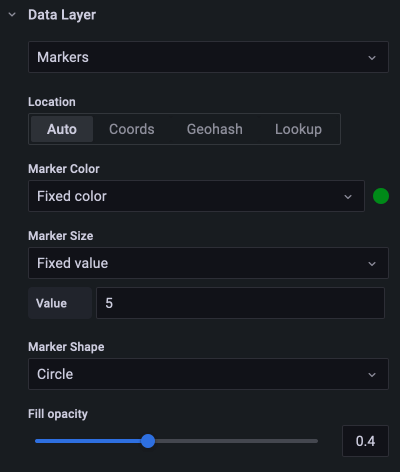
- Marker Color configures the color of the marker. The default
Fixed sizekeeps all points a single color. There is an alternate option to have multiple colors depending on the data point values and the threshold set at theThresholdssection. - Marker Size configures the size of the marker. Default is
Fixed size, making all marker size the same regardless of the data points. However, there is also an option to scale the circles to the corresponding data points.MinandMaxmarker size has to be set such that the Marker layer can scale within these range. - Marker Shape provides you with the flexibility to visualize the data points differently.
- Circle
- Square
- Triangle
- Star
- Cross
- X
- Fill opacity configures the transparency of each marker.
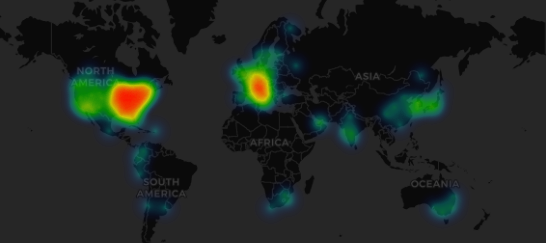
Heatmap layer
The heatmap layer clusters various data points to visualize locations with different densities. To add a heatmap layer:
Click on the drop-down menu under Data Layer and choose Heatmap.
Similar to Markers, you are prompted with various options to determine which data points to visualize and how.
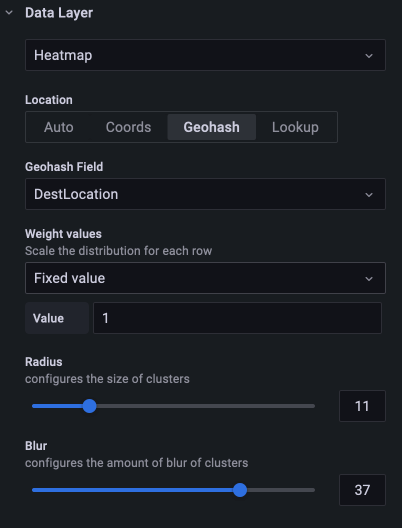
- Weight values configures the intensity of the heatmap clusters.
Fixed valuekeeps a constant weight value throughout all data points. This value should be in the range of 0~1. Similar to Markers, there is an alternate option in the drop-down to automatically scale the weight values depending on data values. - Radius configures the size of the heatmap clusters.
- Blur configures the amount of blur on each cluster.
Was this page helpful?
Related resources from Grafana Labs


