This is documentation for the next version of Grafana Alloy Documentation. For the latest stable release, go to the latest version.
Use Grafana Alloy to send logs to Loki
This tutorial shows you how to configure Alloy to collect logs from your local machine, filter non-essential log lines, send them to Loki, and use Grafana to explore the results.
Before you begin
To complete this tutorial:
- You must have a basic understanding of Alloy and telemetry collection in general.
- You should be familiar with Prometheus, PromQL, Loki, LogQL, and basic Grafana navigation.
Tip
Alternatively, you can try out this example in the interactive learning environment: Sending Logs to Loki.
It’s a fully configured environment with all the dependencies already installed.

Install Alloy and start the service
This tutorial requires a Linux or macOS environment with Docker installed.
Linux
Install and run Alloy on Linux.
macOS
Install and run Alloy on macOS.
You can access the Alloy UI at http://localhost:12345.
Set up a local Grafana instance
In this tutorial, you configure Alloy to collect logs from your local machine and send them to Loki. You can use the following Docker Compose file to set up a local Grafana instance. This Docker Compose file includes Loki and Prometheus configured as data sources.
Create a directory and save the Docker Compose file as
docker-compose.yml.mkdir alloy-tutorial cd alloy-tutorial touch docker-compose.ymlCopy the following Docker Compose file into
docker-compose.yml.To start the local Grafana instance, run the following command.
docker compose up -dNote
If you encounter the following error when you start your Docker container,
docker: 'compose' is not a docker command, use the commanddocker-compose upto start your Docker container.Open http://localhost:3000 in your browser to access the Grafana UI.
Configure Alloy
After the local Grafana instance is set up, the next step is to configure Alloy.
You use components in the config.alloy file to tell Alloy which logs you want to scrape, how you want to process that data, and where you want the data sent.
The examples run on a single host so that you can run them on your laptop or in a Virtual Machine.
You can try the examples using a config.alloy file and experiment with the examples.
Create a config.alloy file
Create a config.alloy file within your current working directory.
touch config.alloyFirst component: Log files
Copy and paste the following component configuration at the top of the file.
 local.file_match "local_files" {
     path_targets = [{"__path__" = "/var/log/*.log"}]
     sync_period = "5s"
 }
This configuration creates a local.file_match component named local_files which does the following:
- It tells Alloy which files to source.
- It checks for new files every 5 seconds.
Second component: Scraping
Copy and paste the following component configuration below the previous component in your config.alloy file:
  loki.source.file "log_scrape" {
    targets    = local.file_match.local_files.targets
    forward_to = [loki.process.filter_logs.receiver]
    tail_from_end = true
  }
This configuration creates a loki.source.file component named log_scrape which does the following:
- It connects to the
local_filescomponent as its source or target. - It forwards the logs it scrapes to the receiver of another component called
filter_logs. - It provides extra attributes and options to tail the log files from the end so you don’t ingest the entire log file history.
Third component: Filter non-essential logs
Filtering non-essential logs before sending them to a data source can help you manage log volumes to reduce costs.
The following example demonstrates how you can filter out or drop logs before sending them to Loki.
Copy and paste the following component configuration below the previous component in your config.alloy file:
  loki.process "filter_logs" {
    stage.drop {
        source = ""
        expression  = ".*Connection closed by authenticating user root"
        drop_counter_reason = "noisy"
      }
    forward_to = [loki.write.grafana_loki.receiver]
    }
The loki.process component allows you to transform, filter, parse, and enrich log data.
Within this component, you can define one or more processing stages to specify how you would like to process log entries before they’re stored or forwarded.
This configuration creates a loki.process component named filter_logs which does the following:
- It receives scraped log entries from the default
log_scrapecomponent. - It uses the
stage.dropblock to define what to drop from the scraped logs. - It uses the
expressionparameter to identify the specific log entries to drop. - It uses an optional string label
drop_counter_reasonto show the reason for dropping the log entries. - It forwards the processed logs to the receiver of another component called
grafana_loki.
The loki.process documentation provides more comprehensive information on processing logs.
Fourth component: Write logs to Loki
Copy and paste this component configuration below the previous component in your config.alloy file.
  loki.write "grafana_loki" {
    endpoint {
      url = "http://localhost:3100/loki/api/v1/push"

      // basic_auth {
      //  username = "admin"
      //  password = "admin"
      // }
    }
  }
This final component creates a loki.write component named grafana_loki that points to http://localhost:3100/loki/api/v1/push.
This completes the simple configuration pipeline.
Tip
The
basic_authblock is commented out because the localdocker composestack doesn’t require it. It’s included in this example to show how you can configure authorization for other environments. For further authorization options, refer to theloki.writecomponent reference.
With this configuration, Alloy connects directly to the Loki instance running in the Docker container.
Reload the configuration
Copy your local
config.alloyfile into the default Alloy configuration file location.sudo cp config.alloy $(brew --prefix)/etc/alloy/config.alloyCall the
/-/reloadendpoint to tell Alloy to reload the configuration file without a system service restart.curl -X POST http://localhost:12345/-/reloadTip
This step uses the Alloy UI on
localhostport12345. If you chose to run Alloy in a Docker container, make sure you use the--server.http.listen-addr=0.0.0.0:12345argument. If you don’t use this argument, the debugging UI won’t be available outside of the Docker container.Optional: You can do a system service restart Alloy and load the configuration file.
brew services restart grafana/grafana/alloyInspect your configuration in the Alloy UI
Open http://localhost:12345 and click the Graph tab at the top. The graph should look similar to the following:
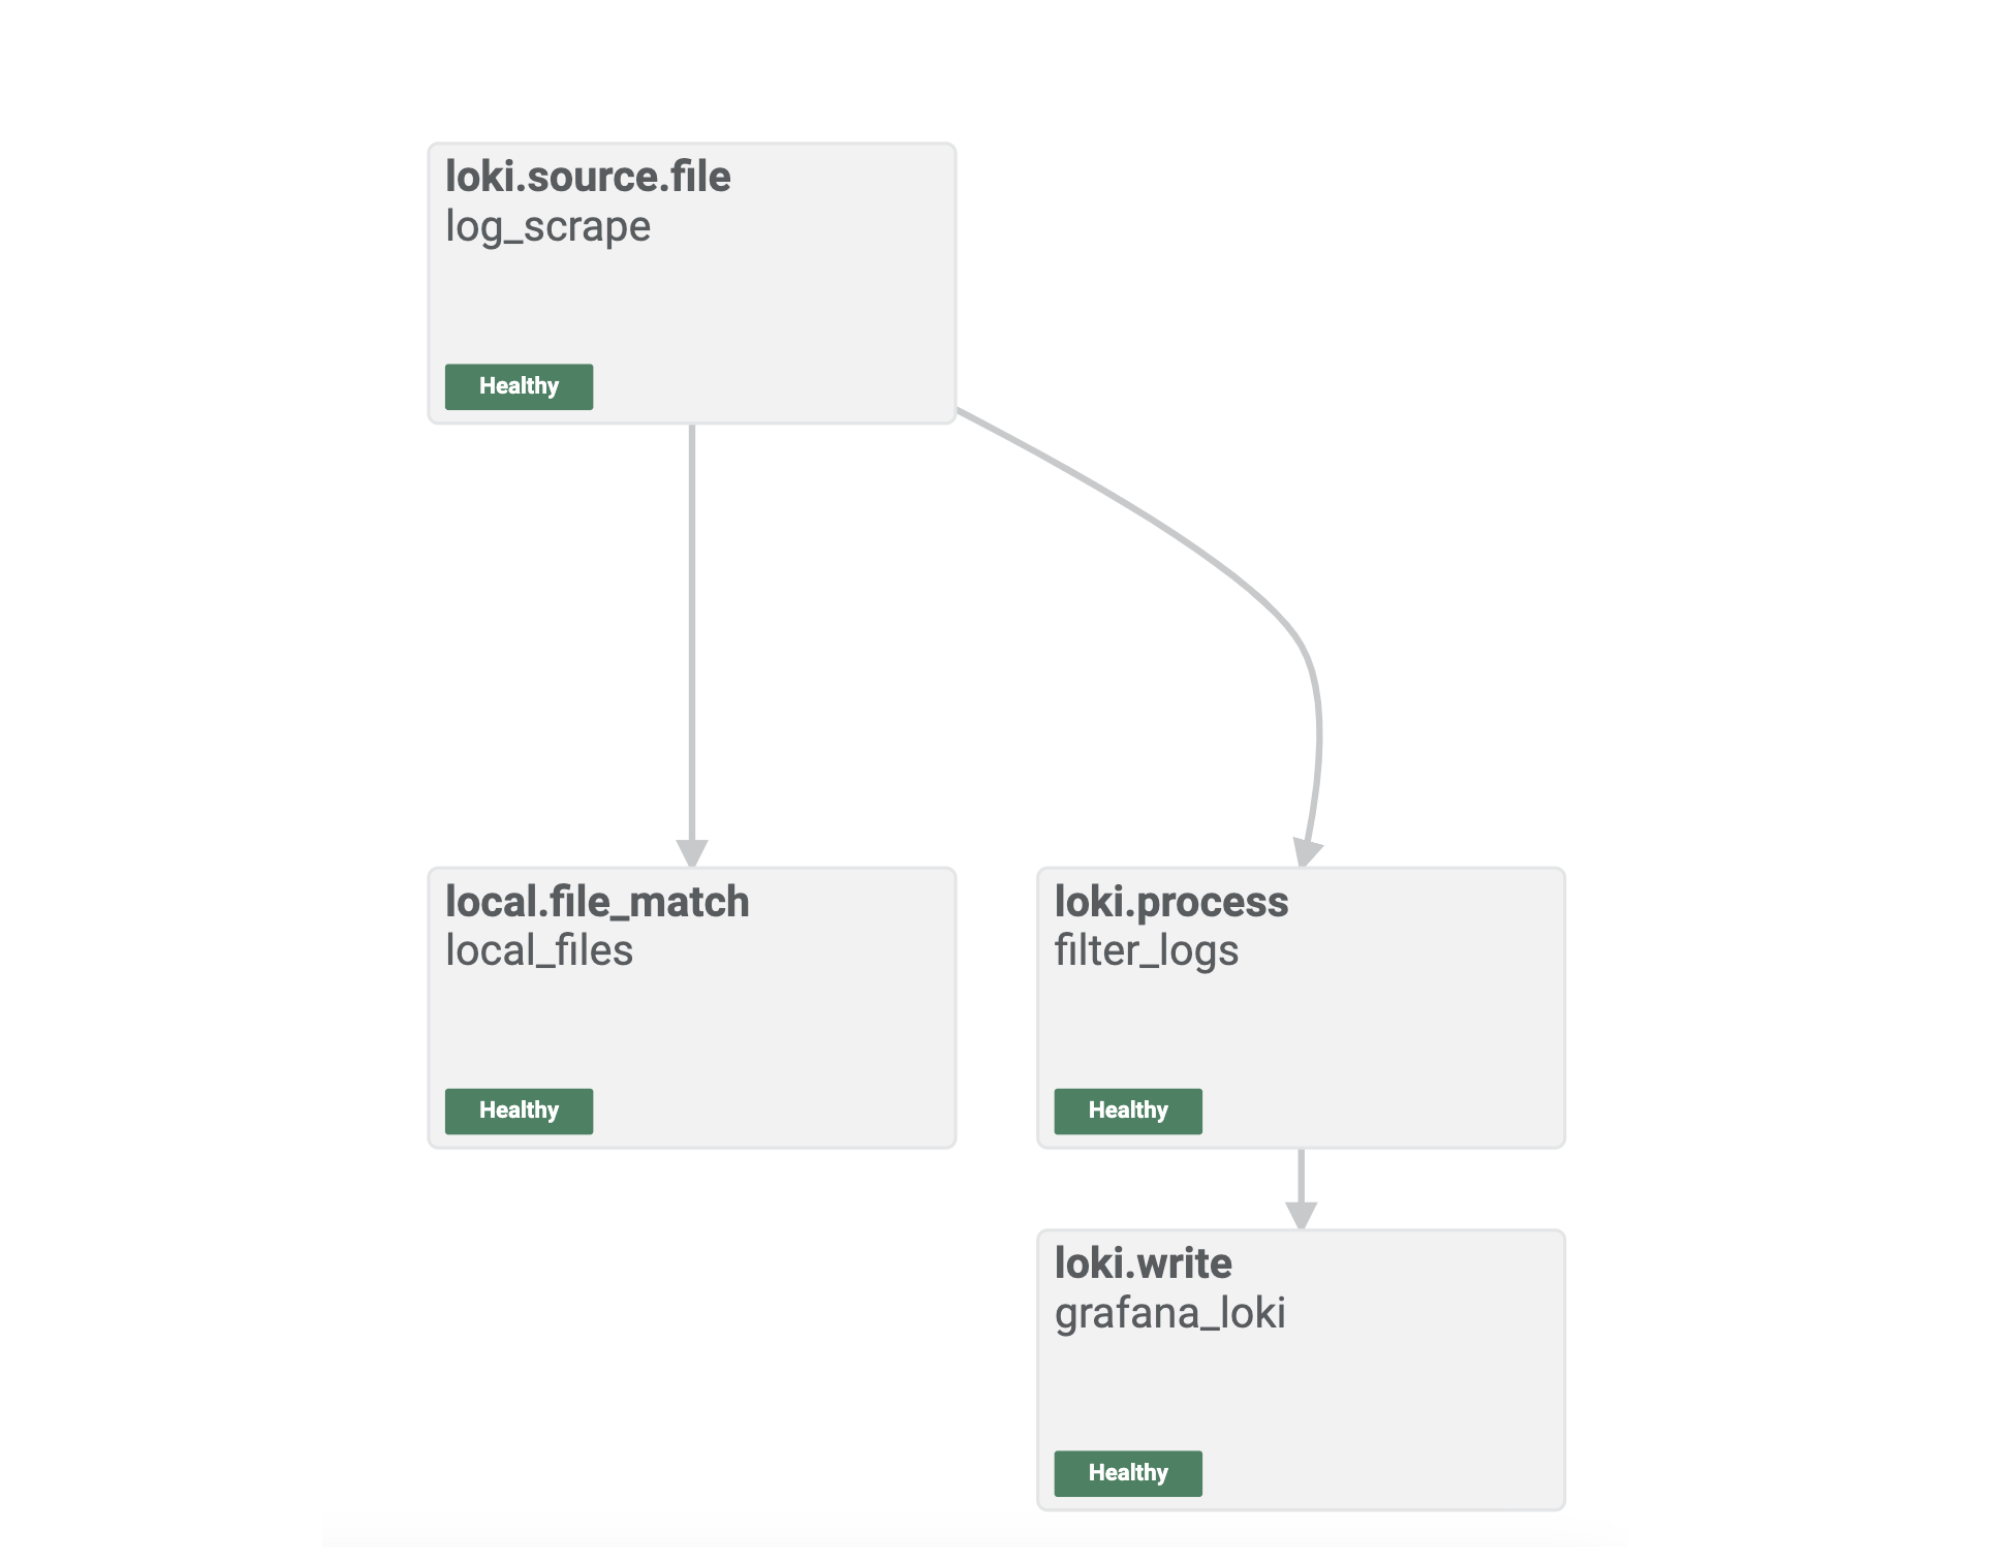
The Alloy UI shows you a visual representation of the pipeline you built with your Alloy component configuration.
You can see that the components are healthy, and you are ready to explore the logs in Grafana.
Log in to Grafana and explore Loki logs
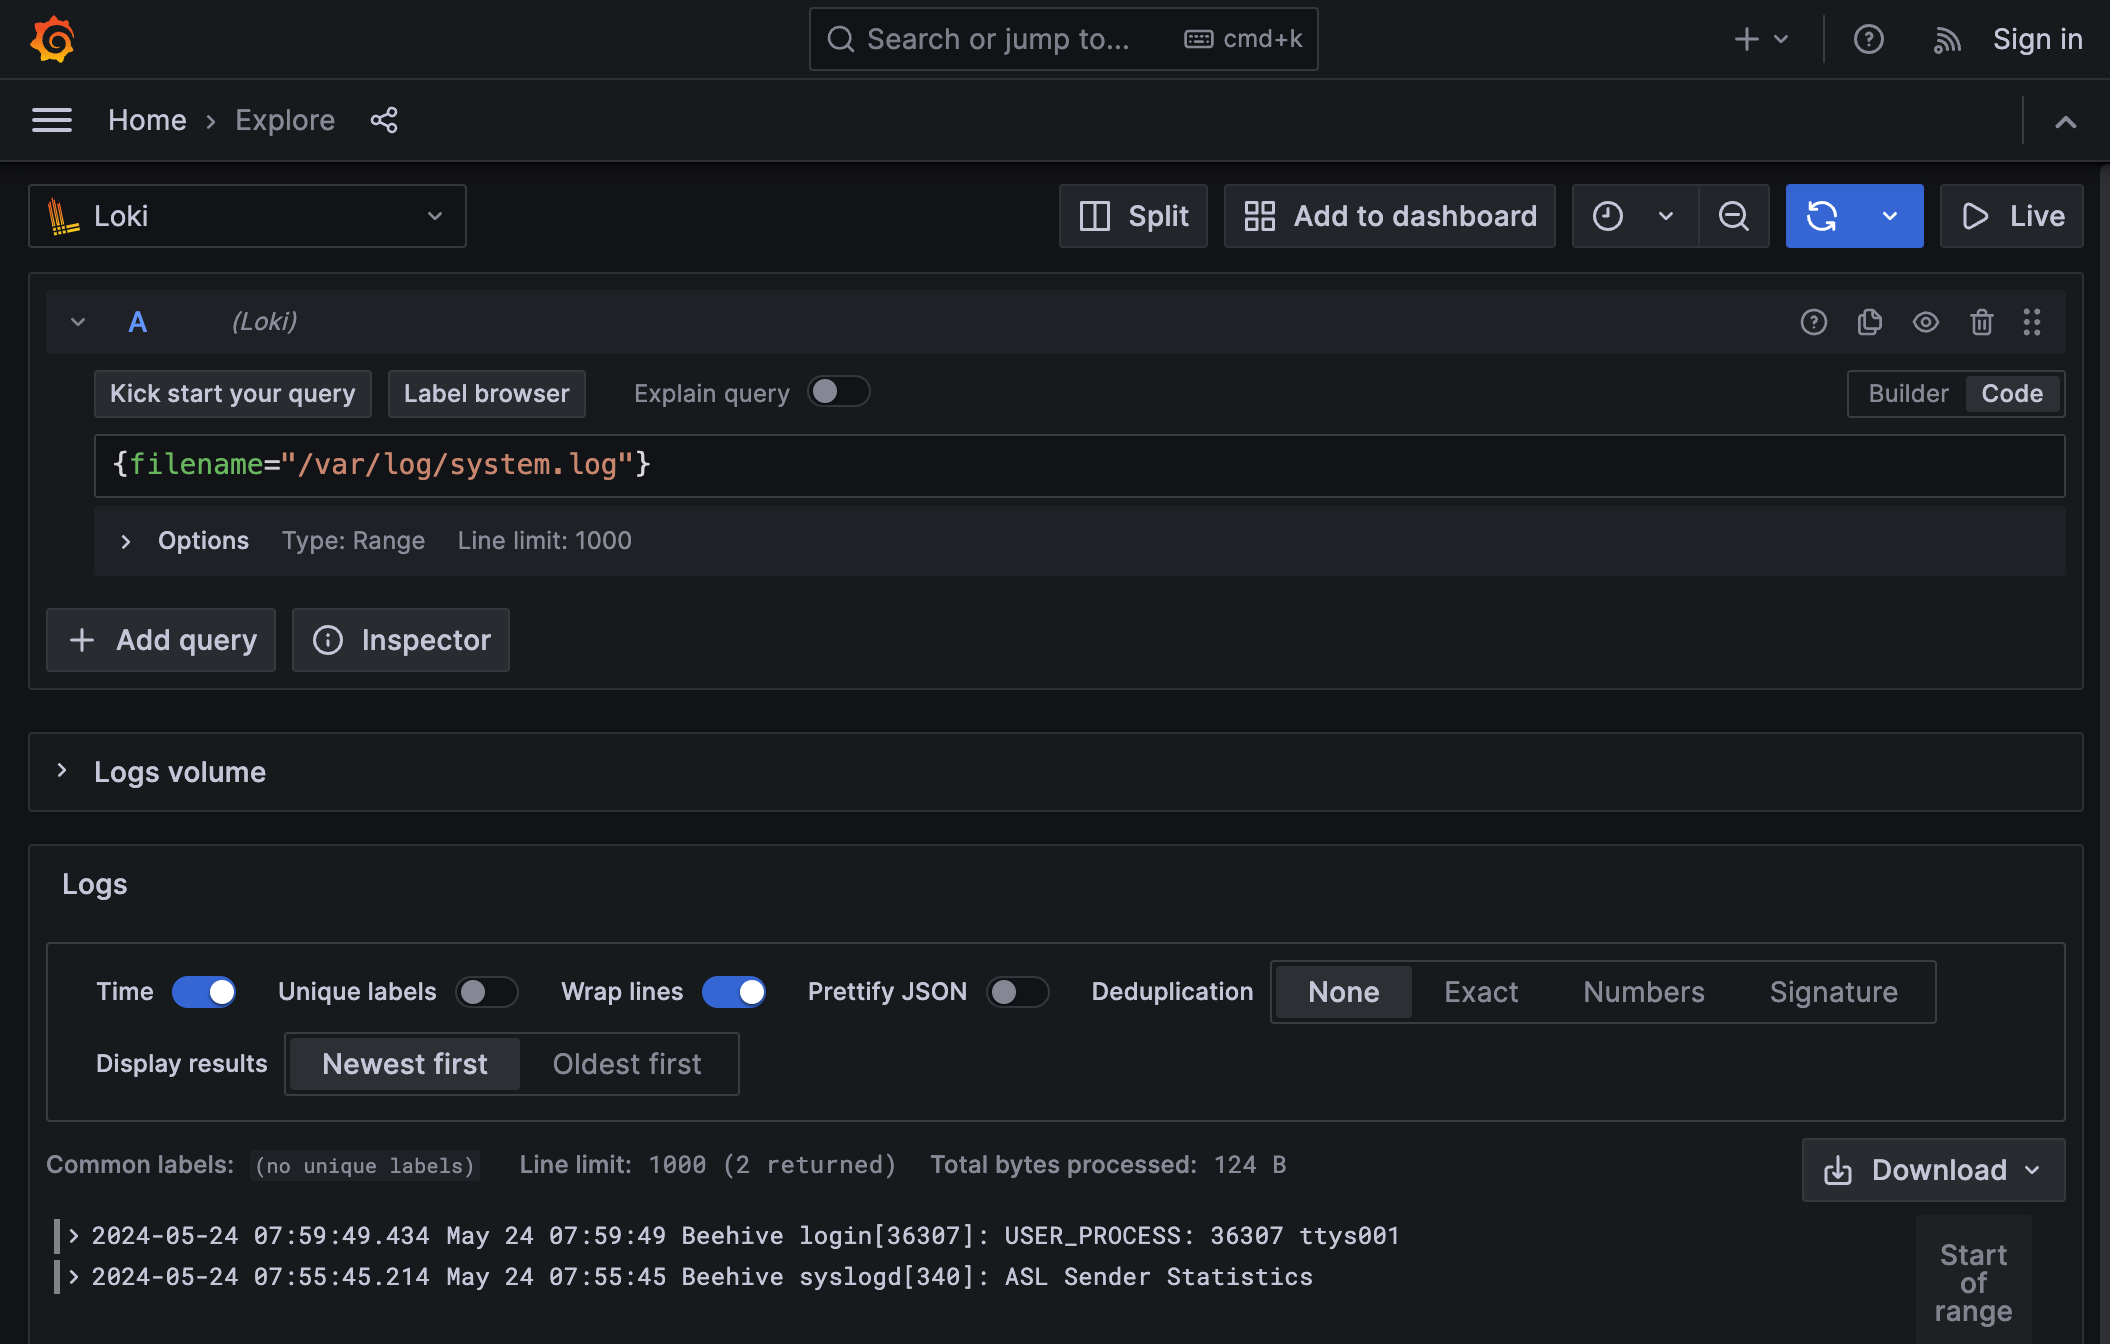
Open http://localhost:3000/explore to access Explore feature in Grafana.
Select Loki as the data source and click the Label Browser button to select a file that Alloy has sent to Loki.
Here you can see that logs are flowing through to Loki as expected, and the end-to-end configuration was successful.
Summary
You have installed and configured Alloy, and sent logs from your local host to your local Grafana stack.
In the next tutorial, you learn more about configuration concepts and metrics.
Was this page helpful?
Related resources from Grafana Labs