Configure and customize Kubernetes Monitoring easier with Alloy Operator
Our latest Kubernetes Monitoring Helm chart offers easier, dynamic configuration with Alloy Operator.
Read more
end-to-end solutions
Opinionated solutions that help you get there easier and faster
monitor infrastructure
Out-of-the-box KPIs, dashboards, and alerts for observability
visualize any data
Instantly connect all your data sources to Grafana
Opinionated solutions that help you get there easier and faster
Instantly connect all your data sources to Grafana
Getting started with managing your metrics, logs, and traces using Grafana
Learn how to unify, correlate, and visualize data with dashboards using Grafana.
Our latest Kubernetes Monitoring Helm chart offers easier, dynamic configuration with Alloy Operator.
Read more
Go from reactive to proactive with our new and improved metrics forecasting UI in Grafana Cloud, designed to make exploring and fine-tuning faster,...
Read more
As part of our goal of developing data sources that are more purpose-built, we have added Prometheus plugins that specifically cater to AWS and Azure...
Read more
Today we are releasing security patches for Grafana 12.0.1, 11.6.2, 11.5.5, 11.4.5, 11.3.7, 11.2.10, and 10.4.19 that include a medium severity...
Read more
Japanese organizations are prioritizing controlling cost and minimizing complexity, according to a recent survey by Grafana Labs.
Read more
The latest release of Grafana Tempo brings memory improvements, new TraceQL features, bug fixes, and some breaking changes.
Read more
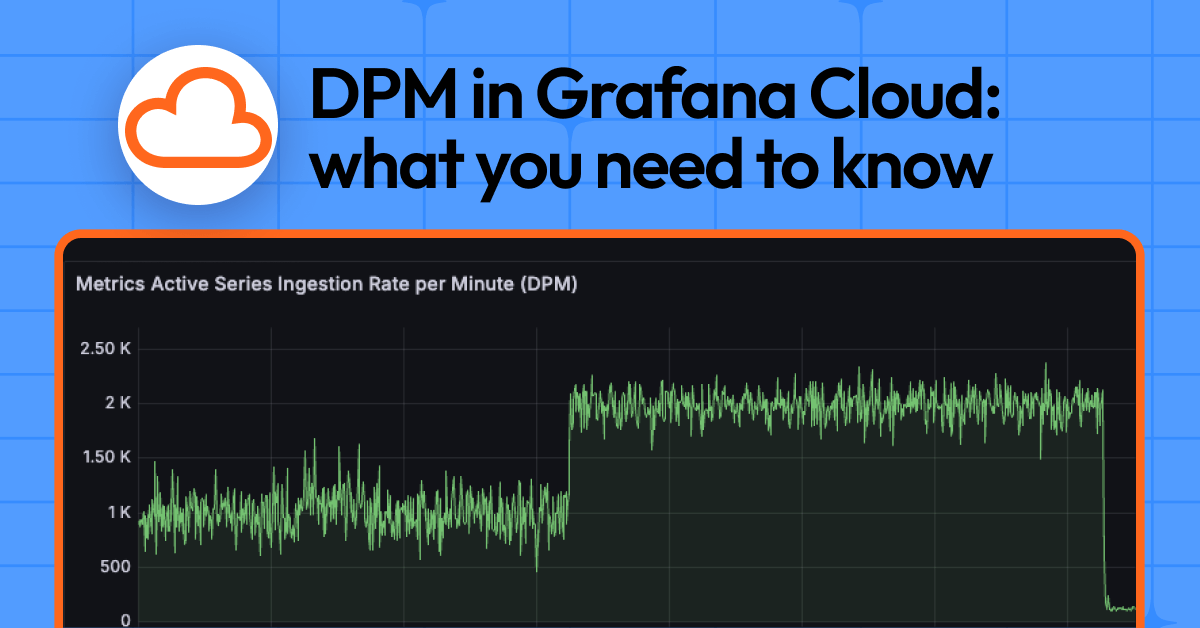
This is your all-in-one guide to understanding DPM in Grafana Cloud: how it works, why we care about it, how to spot issues, and how to keep things...
Read more
Here’s how the Grafana Labs team recently used Python, JavaScript, and Grafana k6 to identify and remove unnecessary data from the Grafana Play...
Read more
If you weren’t able to join us in person, you can now catch up on all the latest announcements, OSS updates, and inspiring community use cases from...
Read more
Behind Blue Ghost Mission 1 — the first fully successful lunar landing by a commercial provider — there was a team of skilled engineers, years of...
Read more
Learn how semantic conventions improve database observability, then follow a demo on how to instrument a simple app with OpenTelemetry and visualize...
Read more
We’re excited to share that ObservabilityCON, our flagship observability event, will take place in London this October.
Read more
Connect your alerts from self-hosted Grafana OSS or Grafana Enterprise instances to Grafana Cloud IRM to escalate and manage incidents.
Read more
Learn how to perform a browser check in Grafana Cloud Synthetic Monitoring to simulate user interactions with your website and ensure the best...
Read more
We’re excited to share that Grafana Cloud offers the FinOps Open Cost and Usage Specification (FOCUS), a community-driven, open standard for cloud...
Read more


No credit card needed, ever.
Gain insight into unused metrics and optimize metric cardinality with the new cardinality management dashboards and Adaptive Metrics