Reliable, predictable, and scalable performance testing: Grafana k6 1.0 is here
With the first major release of Grafana k6, we’re doubling down on our commitment to make performance and reliability testing more predictable,...
Read more
end-to-end solutions
Opinionated solutions that help you get there easier and faster
monitor infrastructure
Out-of-the-box KPIs, dashboards, and alerts for observability
visualize any data
Instantly connect all your data sources to Grafana
Opinionated solutions that help you get there easier and faster
Instantly connect all your data sources to Grafana
Getting started with managing your metrics, logs, and traces using Grafana
Learn how to unify, correlate, and visualize data with dashboards using Grafana.
With the first major release of Grafana k6, we’re doubling down on our commitment to make performance and reliability testing more predictable,...
Read more
Prometheus native histograms offer higher resolution and precision. They're also easier to instrument and you can use them to combine and manipulate...
Read more
With k6 browser checks in Grafana Cloud Synthetic Monitoring, you can gain an even deeper understanding of performance and availability from your end...
Read more
Explore the factors that lead to Ingress NGINX Controller metric growth and practical strategies to mitigate the issue while still retaining essential...
Read more
On April 26, an unauthorized user exploited a vulnerability with a GitHub workflow to gain unauthorized access to tokens, all of which have now been...
Read more
Causely users can now connect directly to their Grafana dashboards for faster root cause analysis.
Read more
Find out how the online travel platform shifted from multiple observability solutions to a single, unified platform.
Read more
Counting down the days to GrafanaCON 2025? We are too. Here’s everything you need to know to make the most out of your GrafanaCON experience.
Read more
In this step-by-step post, learn how to use Grafana Faro, an open source web SDK, to gather real user monitoring data from web applications and...
Read more
Today we are releasing security patches for Grafana 11.6.0, 11.5.3, 11.4.3, 11.3.5, 11.2.8, and 10.4.17, which include medium and high severity...
Read more
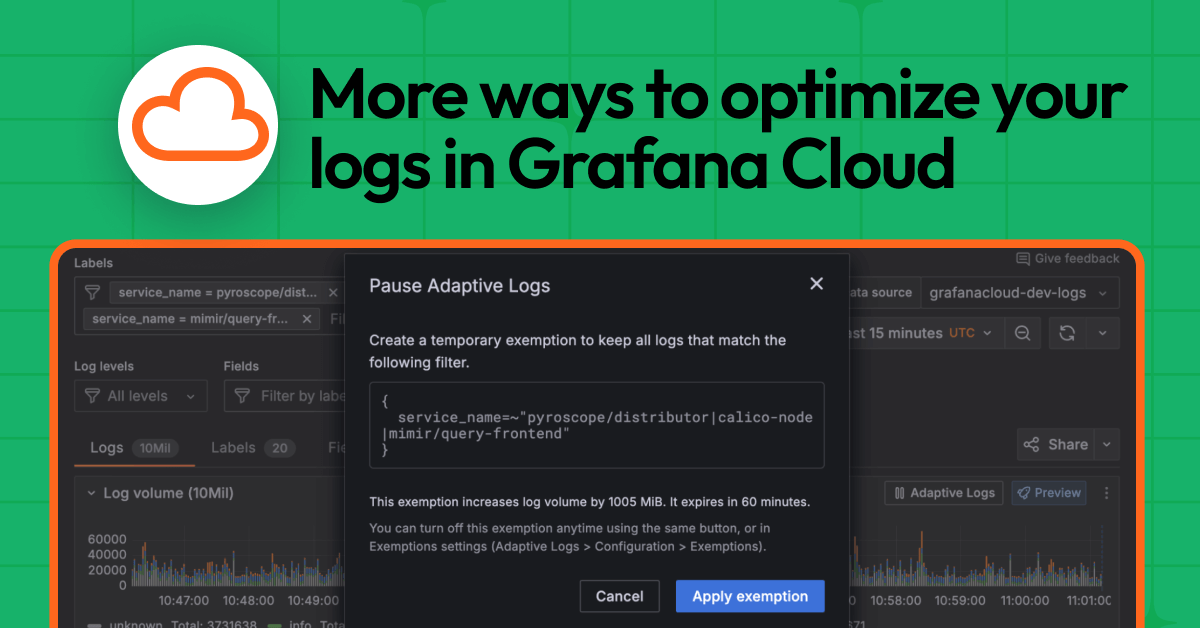
Check out these new features to help reduce toil, apply recommendations with precision, and confidently optimize your log ingestion while still...
Read more
No green thumb? No problem. Here's a simple IoT project to visualize the health of your plants using Arduino, Prometheus, and Grafana Cloud.
Read more
Find out how putting business data in dashboards and using Adaptive Metrics helped the team behind Cookidoo spot errors and save on costs.
Read more
It’s been a big month for Grafana Cloud updates, with a range of new features rolling out across Grafana Cloud k6, Kubernetes Monitoring, Frontend...
Read more
From cold starts to pole position: Learn how to observe Lambda with OpenTelemetry and Grafana Cloud, and build a sample app for monitoring the F1...
Read more

No credit card needed, ever.
Gain insight into unused metrics and optimize metric cardinality with the new cardinality management dashboards and Adaptive Metrics