Incident response and on-call management in one app: Introducing Grafana Cloud IRM
We're excited to announce that we are merging OnCall and Incident into one unified Grafana Cloud IRM app for a more consistent and faster incident...
Read more
end-to-end solutions
Opinionated solutions that help you get there easier and faster
monitor infrastructure
Out-of-the-box KPIs, dashboards, and alerts for observability
visualize any data
Instantly connect all your data sources to Grafana
Opinionated solutions that help you get there easier and faster
Instantly connect all your data sources to Grafana
Getting started with the Grafana LGTM Stack
We’ll demo how to get started using the LGTM Stack: Loki for logs, Grafana for visualization, Tempo for traces, and Mimir for metrics.
News, releases, technical articles, cool stories, and more.
Follow this quick tutorial to learn how to capture live NCAA scores, player stats, and more in a Grafana dashboard.
Read more
Advanced options for storage observability and an easier way to create alerts are just a few of the many recent enhancements we’ve made to Kubernetes...
Read more
After an extensive incident review, we want to explain what went wrong, how it was resolved, and what we are doing to prevent something similar...
Read more
Fleet Management, our centralized control plane for managing observability collectors at any scale, is now generally available with a catalog of...
Read more
Ask Grot, your blog librarian
Need help finding content to answer your questions? Try our AI chat bot, Grot (beta).
Voting is now open for the 2025 Golden Grot Awards, which recognize the top Grafana dashboards in two categories: personal and professional.
Read more
With the Google Sheets data source for Grafana, you can quickly and easily visualize data from all your go-to spreadsheets.
Read more
With our broad ecosystem of data sources, visualizations, and apps, you can easily extend and customize Grafana to meet your unique observability...
Read more
Advanced options for storage observability and an easier way to create alerts are just a few of the many recent enhancements we’ve made to Kubernetes...
Read more
After an extensive incident review, we want to explain what went wrong, how it was resolved, and what we are doing to prevent something similar...
Read more
Fleet Management, our centralized control plane for managing observability collectors at any scale, is now generally available with a catalog of...
Read more
Follow this quick tutorial to learn how to capture live NCAA scores, player stats, and more in a Grafana dashboard.
Read more
Advanced options for storage observability and an easier way to create alerts are just a few of the many recent enhancements we’ve made to Kubernetes...
Read more
After an extensive incident review, we want to explain what went wrong, how it was resolved, and what we are doing to prevent something similar...
Read more
Fleet Management, our centralized control plane for managing observability collectors at any scale, is now generally available with a catalog of...
Read more
Voting is now open for the 2025 Golden Grot Awards, which recognize the top Grafana dashboards in two categories: personal and professional.
Read more
Grafana Labs has put Grafana OnCall (OSS) into read-only, maintenance mode, and will archive the project in one year on 2026-03-24. Here's what you...
Read more
We're excited to announce that we are merging OnCall and Incident into one unified Grafana Cloud IRM app for a more consistent and faster incident...
Read more
By abstracting the technical complexity of OpenTelemetry resource attribute management, you get deeper, more precise insights into distributed system...
Read more
LATAM Airlines uses Grafana Cloud for real-time observability that improves customers' experiences
Read more
With the Google Sheets data source for Grafana, you can quickly and easily visualize data from all your go-to spreadsheets.
Read more
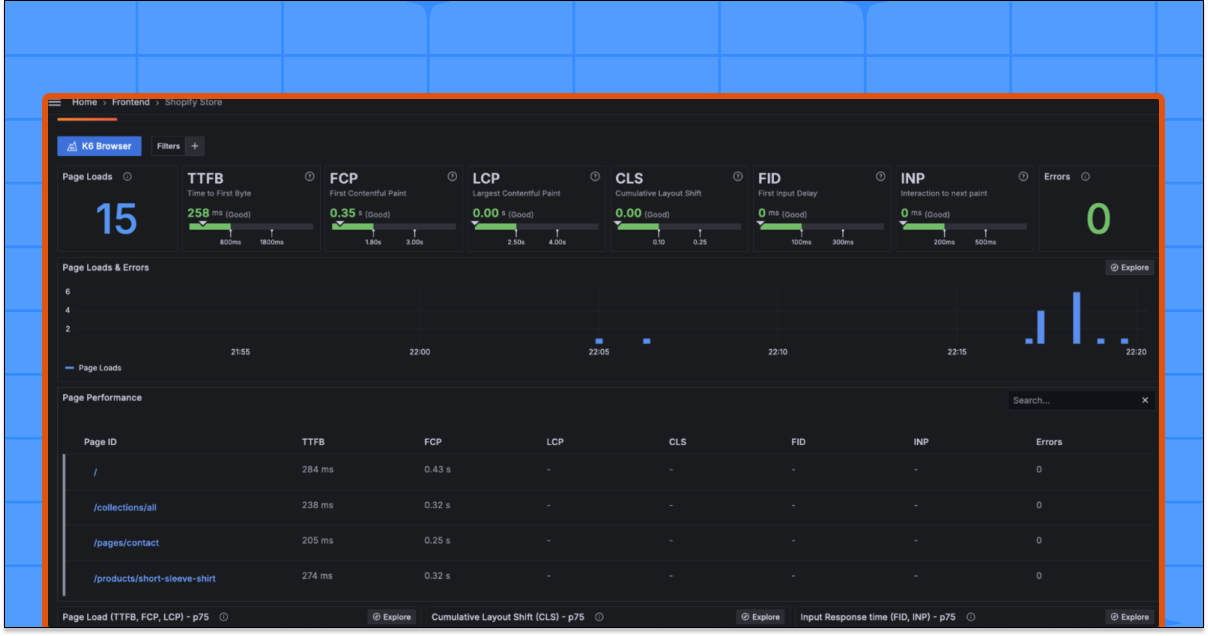
As your Shopify site scales and grows, you’ll need deeper insights into performance and the overall end-user experience. Here’s how to get that...
Read more
Learn how to use Grafana Cloud to monitor a Google Cloud Run service with multi-window, multi-burn-rate alerts.
Read more
Ping checks are an essential part of synthetic monitoring, providing visibility into network performance and availability. Here’s how to perform one...
Read more
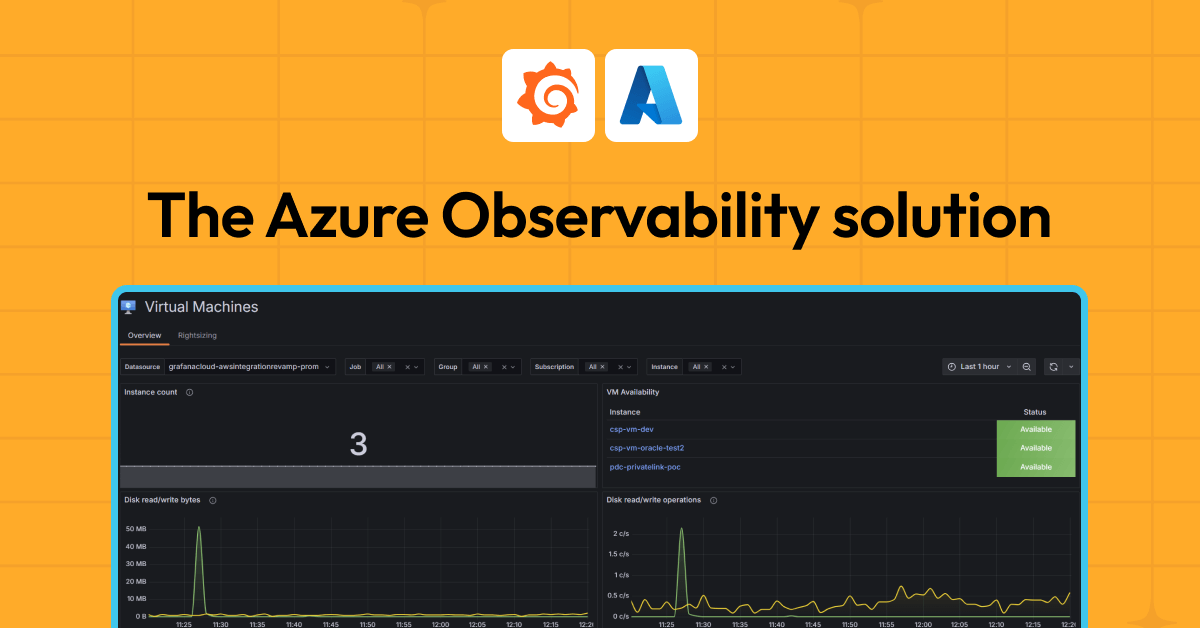
Learn how our Microsoft Azure Observability solution can help you keep your cloud environment running smoothly and efficiently.
Read more
With our broad ecosystem of data sources, visualizations, and apps, you can easily extend and customize Grafana to meet your unique observability...
Read more

No credit card needed, ever.
Gain insight into unused metrics and optimize metric cardinality with the new cardinality management dashboards and Adaptive Metrics