The latest in Kubernetes Monitoring: new features to track persistent storage, simplify alerting, and more
Monitoring is an essential part of any Kubernetes deployment, helping organizations optimize cluster health, streamline troubleshooting, and control their costs.
In Grafana Cloud, we offer all these capabilities (and more) in our out-of-the-box Kubernetes Monitoring solution. Since introducing Kubernetes Monitoring in 2022, we’ve been steadily adding new features, improving the UI, and making it even easier to gain insights into the state of your Kubernetes fleet.
In this post, we recap some of those recent improvements, including advanced options for storage observability and an easier way to create alerts. Plus, we’ll offer some helpful resources to get started with Kubernetes Monitoring in Grafana Cloud today.
Deeper insights into persistent volumes
To effectively manage a Kubernetes deployment, you need visibility into your storage. That’s why we recently rolled out a Kubernetes Monitoring feature that lets you visualize changes in persistent volume (PV) storage across clusters, namespaces, workloads, nodes, and pods.
More specifically, you can quickly and easily track:
- Storage classes of persistent volume claims (PVC)
- Volume bytes of the requested PVC, which compares requests, data capacity, and usage
- Volume inodes, comparing capacity with usage
- The status phase of the PV and PVC, including the binding of the PVC request

These new features offer a number of benefits, including the ability to easily track PV capacity over time — without having to run repeated kubectl queries and storing outputs manually — and quickly identifying PVS status and pending volumes.
Plus, Grafana’s pod detail page links PVCs to their provisioned volumes, with 13-month retention for forensic analysis across cloud and on-prem environments.
To learn more about tracking persistent storage in Kubernetes Monitoring, please visit our technical documentation.
Observability at scale with Fleet Management
Earlier this month, we announced the general availability of Fleet Management, a a Grafana Cloud feature feature that allows you to manage multiple telemetry collector deployments at scale. That GA release included several new features, including enhanced Kubernetes support, allowing you to immediately observe and troubleshoot the health and state of collectors — no additional setup required.
By deploying collectors using the Kubernetes Monitoring Helm chart, the collector.id gets set automatically, based on the environment. Inactive collectors should no longer accumulate in the UI after pod restarts for common use cases.
This keeps your fleet inventory tidy by preventing defunct or offline collectors from lingering in the UI. Together, these enhancements make it easier to manage Kubernetes-based deployments, giving you instant visibility into collector health and eliminating the need to manually prune ephemeral instances.
You can learn more about Fleet Management in our technical docs.
Easier alert creation
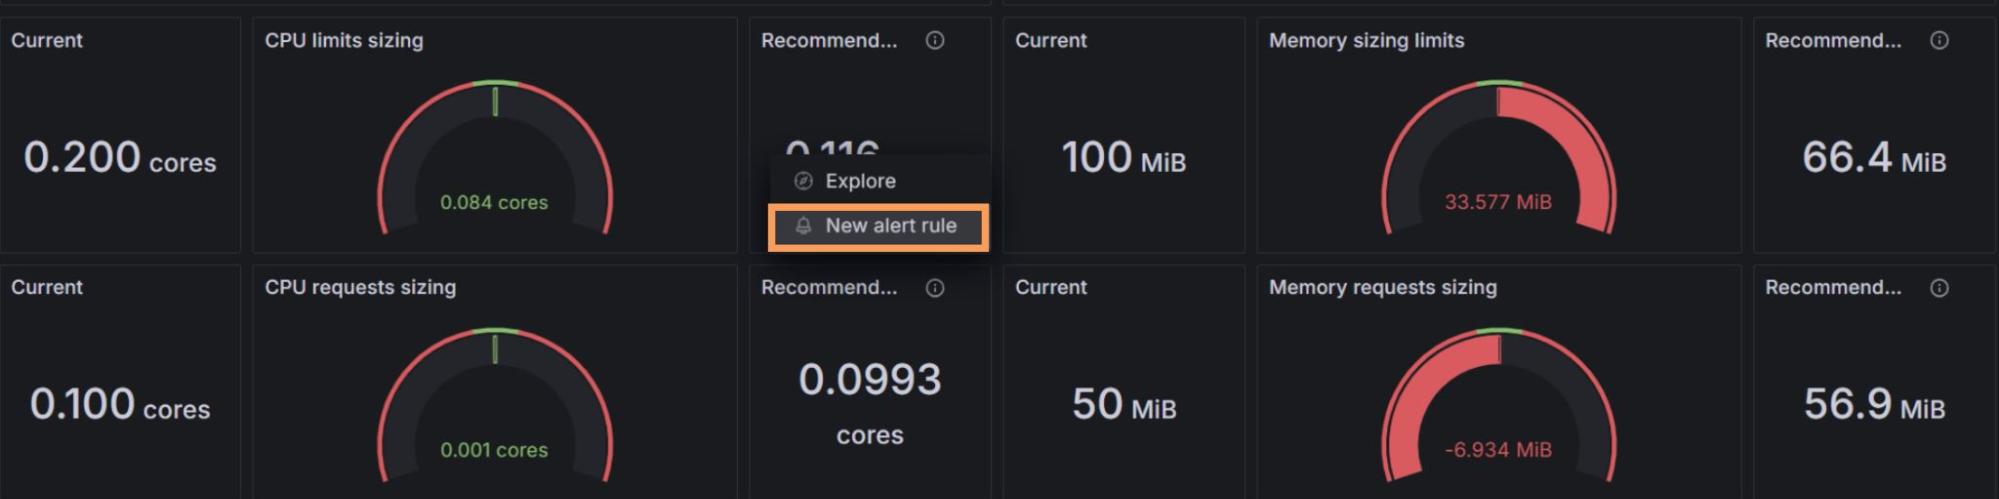
Alerts ensure you can manage Kubernetes resources proactively, helping you to avoid, for example, network saturation or exceeding your quarterly budget. And recently, we’ve made the alerting experience in Kubernetes Monitoring easier than ever by adding alert shortcuts in panels.
You can now set up and customize alerts directly from certain panel types within the Kubernetes Monitoring app, including those that track CPU limits, container resource recommendations, power consumption, network saturation, and cost-saving thresholds. The alert query is taken from the relevant panel, so you can quickly adjust the settings for your needs.
You can read this blog post, as well as our technical docs, to learn more about this new alerting experience.
Seamless navigation + streamlined troubleshooting
We know that when you’re monitoring your infrastructure — especially when an issue arises — every second counts. That’s why we’ve rolled out a series of improvements to the Kubernetes Monitoring UI, making it even easier and faster to navigate.
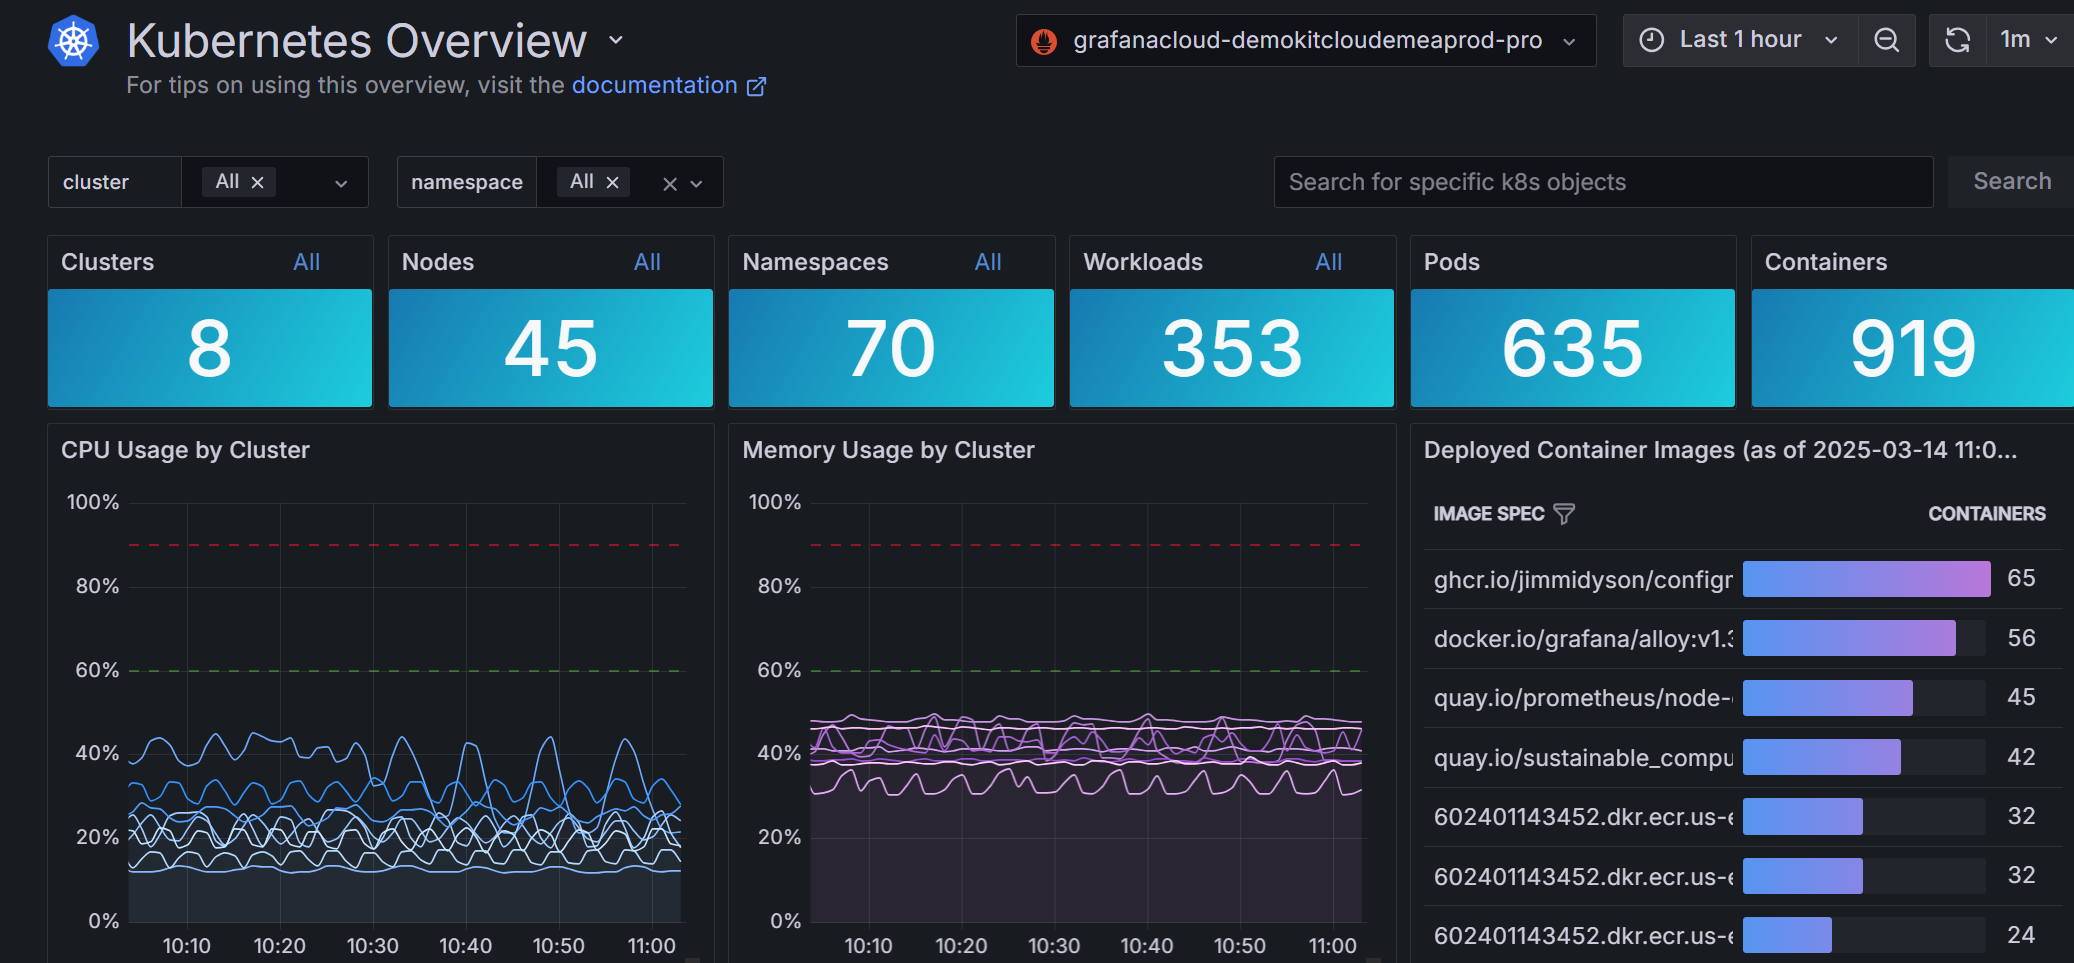
Last year, for example, we introduced the Kubernetes Overview page, where you can get a high-level look at counts for Kubernetes objects, CPU and memory usage by cluster, and firing alerts for containers and pods. You can also filter by clusters and namespaces to identify issues and kickstart troubleshooting.
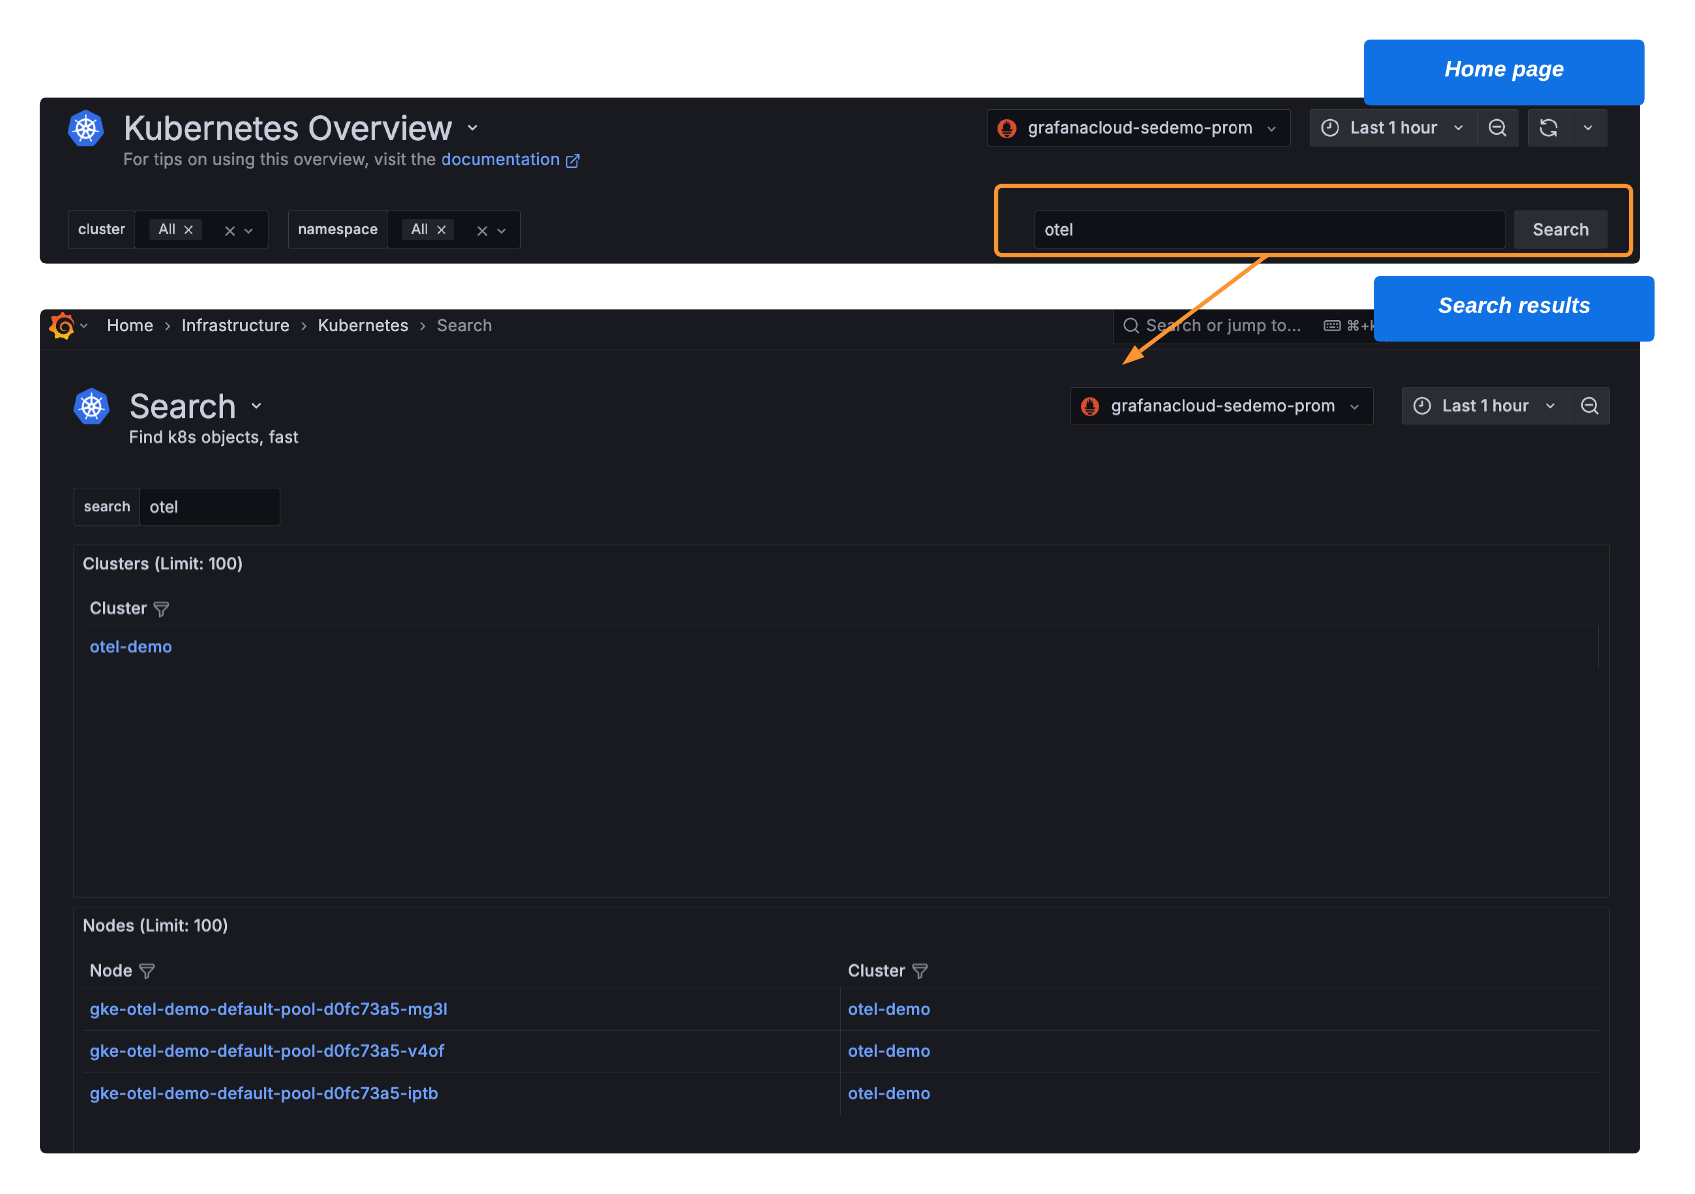
In addition, we launched new search functionality that allows you to instantly locate and drill down into any Kubernetes cluster, node, namespace, workload, pod, or container. Simply copy and paste a component name into the search bar on the home page, click Search, and receive comprehensive, contextual details.
Lastly, we’ve rolled out a few new troubleshooting methods within Kubernetes Monitoring to help you dig into historical data and trends. These include the ability to:
- Find deleted objects, such as clusters, nodes, pods, containers, workloads, and namespaces, to gain a better understanding of events that occurred in the past.
- Zoom into a specific area on a graph to narrow a time range and achieve more targeted historical analysis. You can use this feature to understand, for example, the historical pattern of CPU usage and memory usage during a specific time period.
To learn more about how to explore and troubleshoot your Kubernetes infrastructure, please check out our technical docs.
Simplified data collection with Helm chart 2.0
The Kubernetes Monitoring Helm chart makes it easy to capture telemetry data like metrics, logs, traces, and profiles from your Kubernetes clusters. To do this, the Helm chart uses Grafana Alloy, along with open source tools including Node Exporter, OpenCost, and Kepler.
In January, we announced version 2.0 of the Kubernetes Monitoring Helm chart, aimed at making your configurations even simpler and more predictable. Some of the highlights include:
- User-focused feature design: With version 2.0, you don’t have to know the underlying observability technologies, you just indicate what you want to observe. Each of the methods for gathering telemetry data has been reorganized into their own features.
- Multiple destinations: You can now define as many destinations for your telemetry data as you want — for example, you can send metrics to multiple endpoints, or forward your traces to two different targets.
- Built-in integrations: Certain service integrations — including Grafana, Grafna Alloy, Grafana Loki, Grafana Mimir, and MySQL — are now built into the Helm chart. This means you get the benefit of pre-defined Alloy configurations, plus easy upgrades and inter-feature compatibility. We plan to add more integrations in the future, so stay tuned!
- Fully compatible with Fleet Management: With version 2.0 of the Kubernetes Monitoring Helm chart, it’s simple to add your Alloy instances to your remotely managed fleet of collectors.
Ready to migrate to version 2.0? Check out this helpful migration guide.
Greater cost control
As your Kubernetes fleet scales, cloud costs can quickly rise — which is why we’ve made cost management a major component of our overall Kubernetes Monitoring solution.
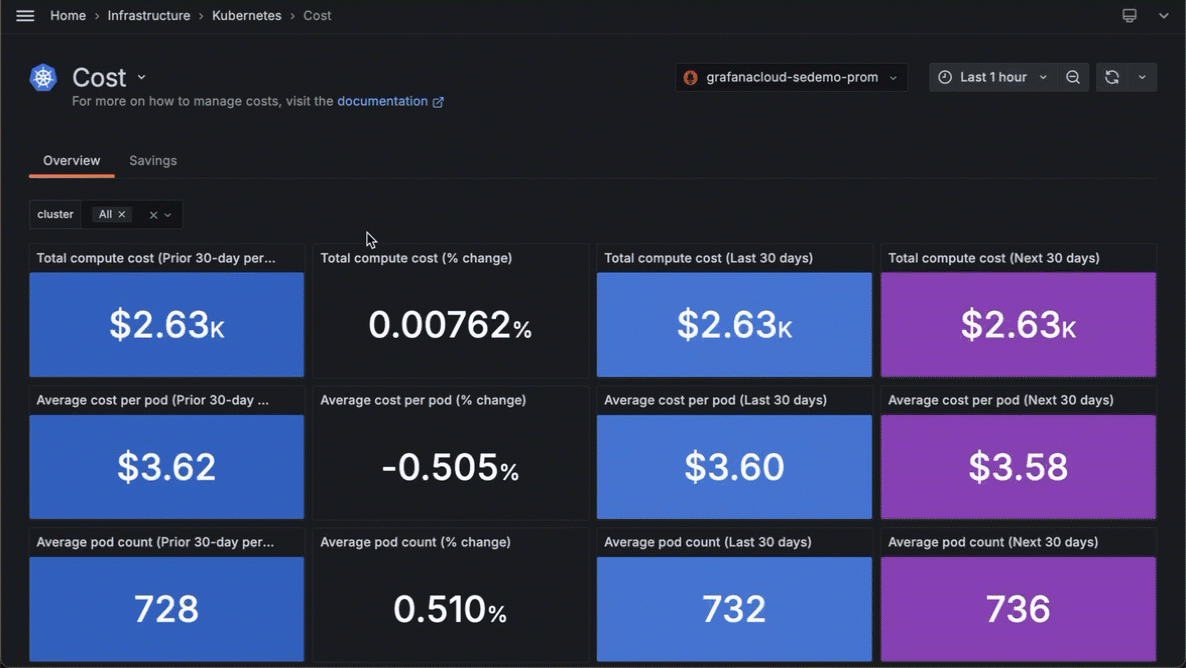
We expanded on those capabilities last year with the new Cost Overview tab, which offers a 90-day view of total compute costs, average cost per pod, and average pod count. This 90-day period includes the past 30 days, as well as the 30 days before and after that window.
You can also see the cost (calculated within the selected time range) of each cloud service provider you use, along with the total cost of all providers, a 30-day projected cost of idle CPU cores, and the percentage of unclaimed persistent volumes.
To learn about this and other cost management features in Kubernetes Monitoring, please refer to our technical docs.
Get started with Kubernetes Monitoring today
With Kubernetes Monitoring in Grafana Cloud, you can visualize and alert on your Kubernetes cluster to identify root causes, optimize resource usage, and reduce costs. To learn more, and for guidance on how to configure Kubernetes Monitoring, please check our technical documentation.
You can also keep tabs on all the latest Kubernetes Monitoring features in our What’s new in Grafana Cloud docs.
Grafana Cloud is the easiest way to get started with metrics, logs, traces, dashboards, and more. We have a generous forever-free tier and plans for every use case. Sign up for free now!