
Grafana Cloud updates: Exemptions in Adaptive Logs, GPU monitoring in AI Observability, and more
We consistently roll out helpful updates and fun features in Grafana Cloud, our fully managed observability platform powered by the open source Grafana LGTM Stack (Loki for logs, Grafana for visualization, Tempo for traces, and Mimir for metrics).
In case you missed them, here’s our monthly round-up (the first of 2025!) of the latest and greatest Grafana Cloud updates. You can also read about all the features we add to Grafana Cloud in our What’s New in Grafana Cloud documentation.
And if you’re not a Grafana Cloud user yet, sign up for an account today! You can try any of these features (and more) for free with our generous Cloud Free plan.
New features for Adaptive Logs
Adaptive Logs is a feature in Grafana Cloud that uses AI/ML techniques to analyze observability data at scale and identify commonly ingested log patterns. From there, it creates a set of customized recommendations for dropping unused telemetry, allowing you to reduce observability costs and focus on the signals that truly matter.
This month, we’re sharing two updates that make it even easier to get started with Adaptive Logs and help you further customize your log management experience.
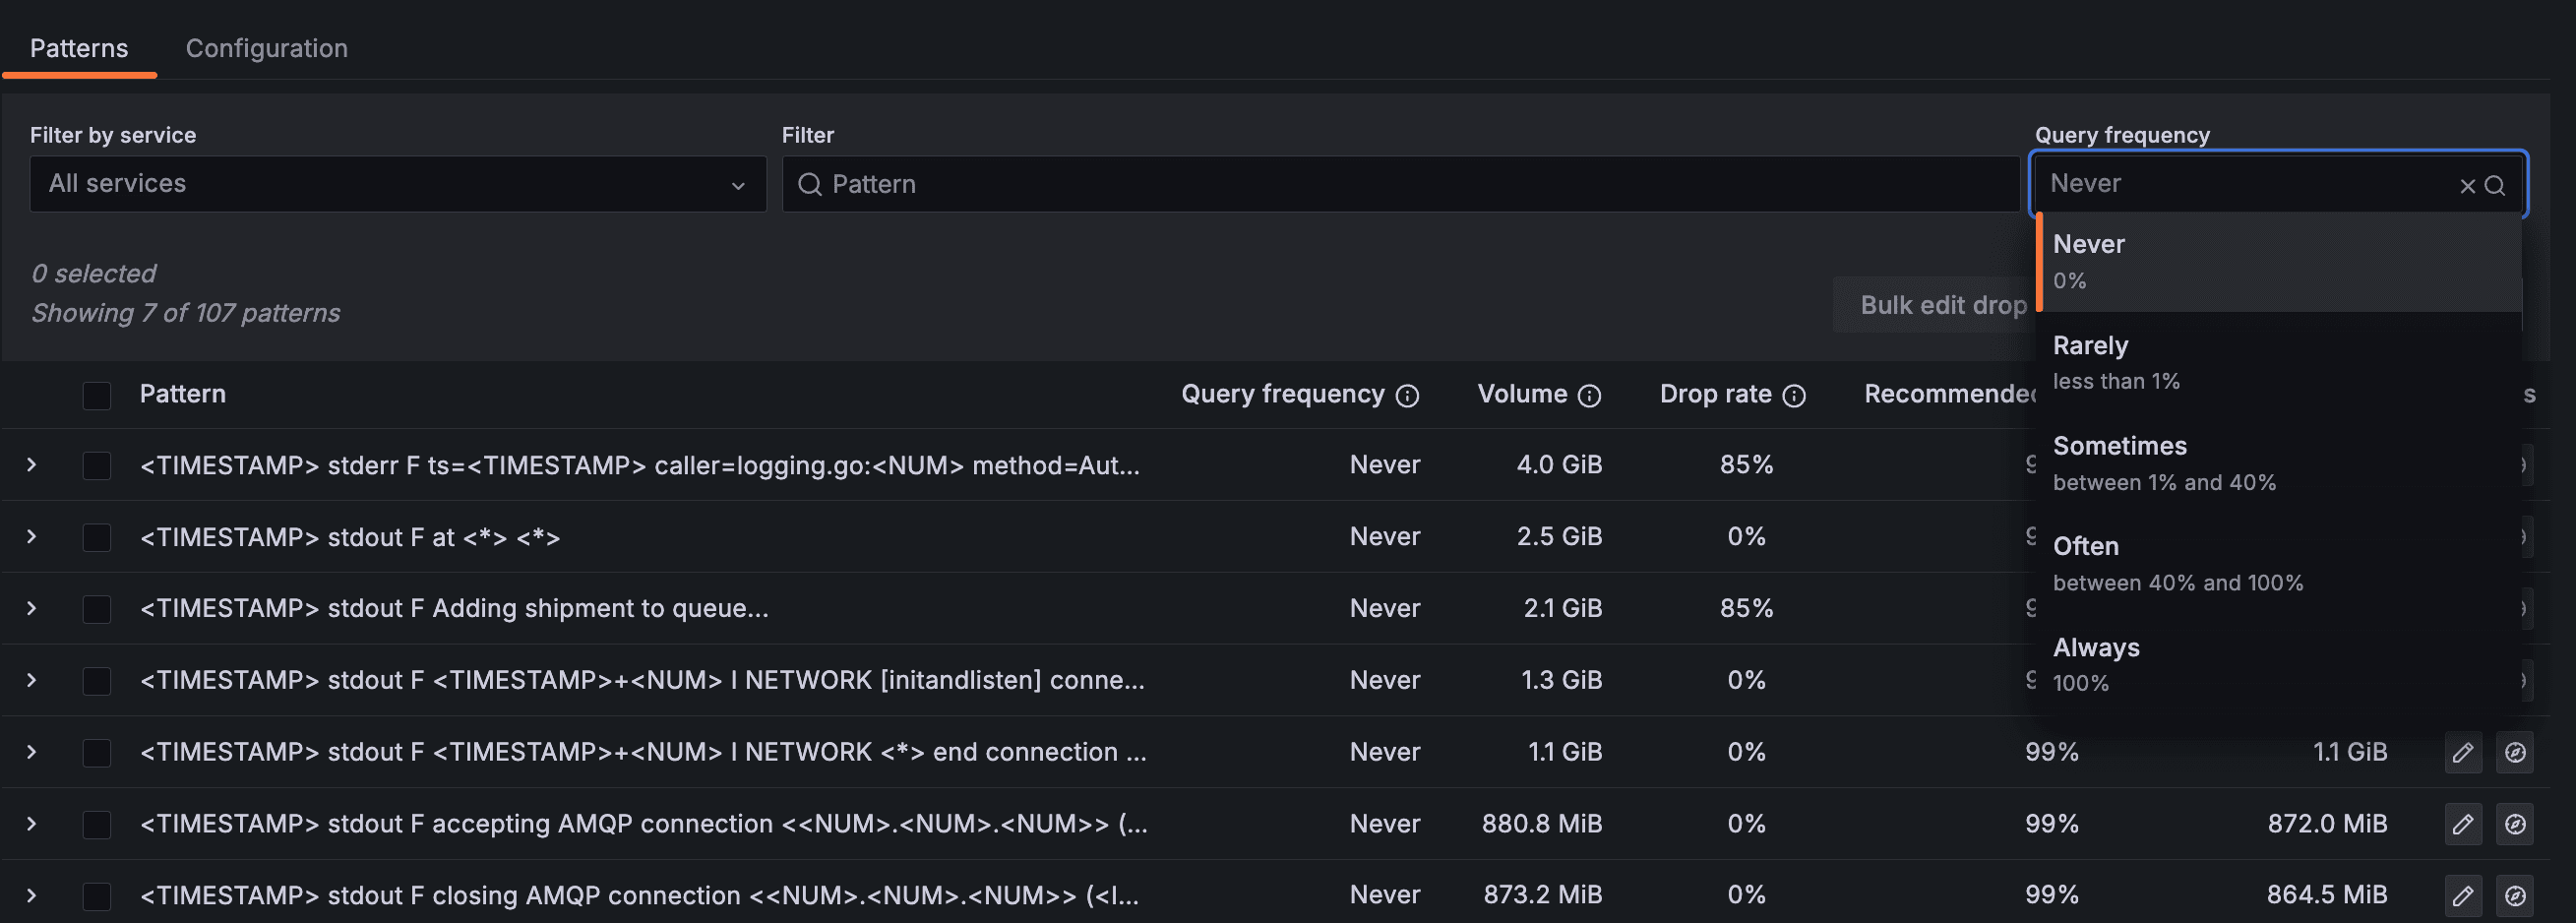
Filter recommendations by usage
Adaptive Logs now allows you to filter recommendations by how often they are queried, making it easier to stop ingesting low-usage log lines. In just a few clicks, you can apply recommendations for logs that are rarely or never queried. This UI enhancement — which makes it easy to get started with, and get value from, Adaptive Logs — is now generally available.
Retain specific logs with Exemptions
Last year, we introduced Exemptions in Adaptive Metrics, a feature that allows you to proactively preserve critical data by identifying and excluding certain metrics from aggregations. And this month, we’re extending this powerful capability to Adaptive Logs.
With Exemptions in Adaptive Logs, now generally available, you can prevent certain logs from being dropped even if they are not being heavily queried. To do this, you use the Stream selector to indicate to Adaptive Logs not to drop log lines from certain streams. This ensures specified logs are ingested into Grafana Cloud, and are not dropped by Adaptive Logs, no matter what our usage recommendations initially suggest. Our recommendation engine also updates to include the exemptions you specify.

These updates follow the rollout of another new Adaptive Logs feature — per-service recommendation drops — last month. To learn more about Adaptive Logs, please check out our technical docs.
Integrated performance testing and profiling
One of the primary goals of performance testing is to ensure your applications perform well under various levels of traffic. However, most performance tests are conducted with minimal insight into why a system performs a certain way during testing — and this is where continuous profiling comes in.
With profiling, you get unparalleled visibility into how your code behaves under load, so you can quickly pinpoint CPU bottlenecks, memory leaks, and other root causes of performance issues. And with our new integration between Grafana Cloud k6 with Grafana Cloud Profiles, you can (easily) do just that.
By integrating performance tests and profiling data in Grafana Cloud, you can:
- Access Grafana k6 performance test results and Pyroscope profiling data in a single interface, making it easier to correlate test metrics with application performance.
- Automatically connect test metadata with profiling data, with minimal configuration required.
- Use flame graphs in the Profiles tab within Grafana Cloud k6 to identify bottlenecks and optimize application performance.
- Evaluate performance changes over time by comparing profiling data from multiple test runs.
- Visualize k6 test data in Explore Profiles for deeper analysis.
Update: As of Feb. 20, 2025, the Explore apps (Explore Metrics, Explore Logs, Explore Traces, Explore Profiles) are now the Drilldown apps (Metrics Drilldown, Logs Drilldown, Traces Drilldown, Profiles Drilldown).

To learn more about this integration, please refer to this blog post.
GPU monitoring in AI Observability
AI Observability is a Grafana Cloud integration we released last year, designed to provide insights into generative AI application performance.
By leveraging OpenLIT — the OpenTelemetry-native, open source SDK — AI Observability simplifies the monitoring, diagnosis, and optimization of generative AI systems. It also includes pre-built dashboards that you can customize to fit your needs.

These dashboards, focused on LLM & VectorDB Observability, now include an exciting new feature: OpenTelemetry-based GPU monitoring.
You can now track GPU performance through key metrics such as utilization percentage, temperature, and power consumption, allowing you to further optimize the efficiency of your AI workloads. The GPU monitoring capability is generally available.
Please check out our AI Observability docs to learn more.
One-click data links in visualizations
When visualizing data in Grafana Cloud, data links allow you to link to other panels, dashboards, and external resources while maintaining the context of your source panel.
Last year, we introduced one-click data links and actions for Canvas visualizations in public preview and experimentally, respectively. With the One click switch toggled on, you can open a data link or trigger an action in a single click — and now, both of these features are generally available.
With the promotion to general availability, the One click switch has been moved into the dialog box where you configure the data link or action at the element level.

We’ve also added a One click switch to data links for the following visualizations:
- Time series
- Bar chart
- Candlestick
- State timeline
- Status history
- Trend
- XY chart
Note: you can only have one one-click data link, so if you enable the feature for one, it is automatically disabled for others.
Learn more about how to work with and add data links.
Tracking persistent storage in Kubernetes Monitoring
Our Kubernetes Monitoring solution in Grafana Cloud enables you to visualize and alert on your Kubernetes cluster so you can identify root causes, optimize resource usage, and reduce costs. This month, we’re adding a new capability to help you get even deeper insights into your Kubernetes deployment: tracking persistent storage.
Now generally available, this feature allows you to view how persistent volume (PV) changes over a specific time range in the storage tab on the Cluster, Namespace, Workload, Node, and Pod detail pages. The specific insights you gain into storage include PVC storage classes, inodes, the status of binding, and comparison of PVC requests, data capacity, and usage.

You can learn more in our Kubernetes Monitoring docs.
Fleet Management and Grafana Cloud monitoring solutions
Fleet Management — a feature that allows you to manage multiple telemetry collector deployments at scale — now includes a catalog of Grafana Cloud monitoring solutions, allowing you to combine preconfigured monitoring functionality with the scalability of remote configuration.
Choose from a list of platform-specific templates to automatically build configuration pipelines in Fleet Management, and then assign attributes to match those pipelines to specific collectors. With these templates in Fleet Management, you can remotely configure all your collectors in just a few clicks.
This feature is currently in public preview. Please reference our documentation to learn more.
Pre-built alerts in Cloud Provider Observability
To simplify multi-cloud management, last year we rolled out Cloud Provider Observability, an application that lets you monitor AWS, Microsoft Azure, and Google Cloud services, all in Grafana Cloud.
This month, we’re extending Cloud Provider Observability to include out-of-the-box, built-in alerts to help you spend less time on troubleshooting. Now generally available, these alerts enable you and your team to:
- Prevent slowdowns: Get alerts for high CPU usage in Amazon EC2, Azure VMs, and GCP Compute Engine.
- Keep databases running smoothly: Avoid failures with alerts for deadlocks, failed connections, and disk space limits.
- Optimize storage and messaging: Stay ahead of storage constraints and ensure messages are delivered on time.
You can learn more in our Cloud Provider Observability docs.
New features for Grafana SLO
This month, we’re announcing a couple updates toGrafana SLO — an application that makes it easy to create, manage, and scale service level objectives, SLO dashboards, and error budget alerts in Grafana Cloud — including a new service-oriented view of your SLOs (alongside IRM resources and incidents) and integration with Sift, the automated diagnostic tool in Grafana Cloud.
Grafana Service Center
The Service Center, now in public preview, provides a single-pane-of-glass view into key operational resources, including SLOs, incidents, and dashboards (with more resources coming soon). You simply define the labels and tags that represent your services, and the Service Center will generate a service resource and a service landing page.
Once you’ve added a service to the Service Center, all relevant data is collected and displayed in the service you created. Additionally, you can add other informative attributes to a service definition, including documentation links, repository links, and a backlog.
Future updates will include:
- Functionality to gauge the progress, week-to-week or month-to-month, of service performance.
- Visibility into who is currently on-call and which team owns a service.
- Visibility into fired Grafana OnCall alert groups related to a service.
- Visibility into fired alert notifications.
- Service dependency graphs.
- Stakeholder notifications for services.
- Service alerts when a dependent service is impacted.
Sift integration
To streamline troubleshooting, all Grafana SLO dashboards are now natively integrated with a Sift panel. Sift automatically checks burning SLOs for common issues and reports back using the panel in all auto-generated SLO dashboards. You can also manually run Sift checks from the Grafana SLO dashboard.
Expanded RBAC support
Grafana Cloud now supports role-based access control (RBAC) for Synthetic Monitoring, notification policies, and alerting notifications. Here’s a closer look.
RBAC for Synthetic Monitoring
RBAC for Synthetic Monitoring, now in private preview, allows you to fine-tune access and permissions within Grafana Cloud Synthetic Monitoring, so you have greater control over who can access specific features.
With RBAC, you can assign different roles and permissions to users and teams, ensuring the right people have the right access. This makes managing your monitoring workflows more secure and flexible.

To learn more about how to assign roles in Synthetic Monitoring, please check out our documentation.
RBAC for notification policies
You can now manage notification policies through RBAC, and choose who can create, edit, and read notification policies using fixed roles.
It’s important to note that you can only grant different access levels to the entire notification policy tree and not to individual notification policies.
To use RBAC for notification policies, enable the alertingApiServer feature toggle.
RBAC for alerting notifications
The feature flag alertingApiServer is now enabled by default. In the UI, administrators now have more granular control over which parts of notification settings users have access to.
Grafana Cloud is the easiest way to get started with metrics, logs, traces, dashboards, and more. We have a generous forever-free tier and plans for every use case. Sign up for free now!

