
Grafana 11 release: The latest in visualizations, Scenes-powered dashboards, simple access controls, and more
Update: Grafana 11 is now generally available! The download link below has been changed to reflect the latest version of Grafana.
At the opening keynote of GrafanaCON 2024, attendees in Amsterdam got a sneak peek at some of the latest features in Grafana 11, which is now available in preview.
For those of you who couldn’t score a ticket to the sold-out event, don’t worry — we have a roundup of all the latest updates to visualizations that make it easier than ever to create beautiful dashboards in Grafana. We are also introducing new innovation to help simplify running, managing, and leveraging the power of Grafana at scale.

You can explore all the new features by upgrading your instance or downloading Grafana 11-preview today. This latest version of Grafana is a preview so you can start to test and play with the updates, but we don’t recommend deploying them in production just yet. We will be running internal testing until May 14, when Grafana 11 will be generally available.
Can’t wait to get started? Sign up for Grafana Cloud, our fully managed observability platform that includes all of these Grafana features and much more. We have a generous free tier and plans for every use case. Get your free account today!
Easier to monitor and troubleshoot your data
Whether you’re monitoring rockets in space or how often your kids clean their rooms (both equally difficult), you’ve got more options than ever to explore, visualize, and alert on data, no matter where it lives.
Explore Prometheus metrics without writing queries
Update: As of Feb. 20, 2025, the Explore apps (Explore Metrics, Explore Logs, Explore Traces, Explore Profiles) are now the Drilldown apps (Metrics Drilldown, Logs Drilldown, Traces Drilldown, Profiles Drilldown).
We know it’s sometimes difficult for our users to write PromQL. What if you could query and troubleshoot in Prometheus without having to write PromQL? Say hello to Explore Metrics, a new queryless experience for exploring and drilling into your Prometheus metrics within Grafana 11.
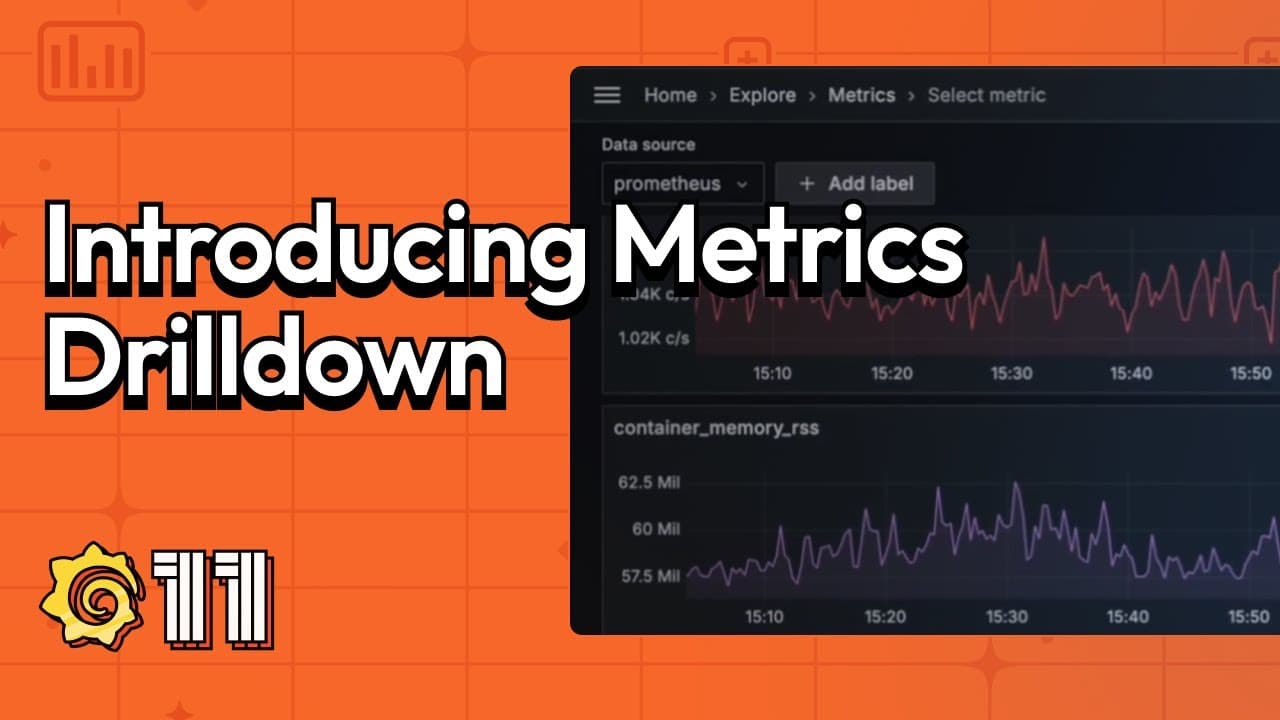
With Explore Metrics, you can find or select a metric name and immediately see the appropriate visualization, whether your metric is a gauge, counter, or histogram. You can review your metric broken down by each of its labels, which makes it easy to spot anomalies by namespace, cluster, or any other attribute. This is an efficient way to narrow down the source of latency, errors, or other issues — and it’s entirely point-and-click.
To learn more, read our Explore Metrics documentation.
Custom visualizations with Canvas panel
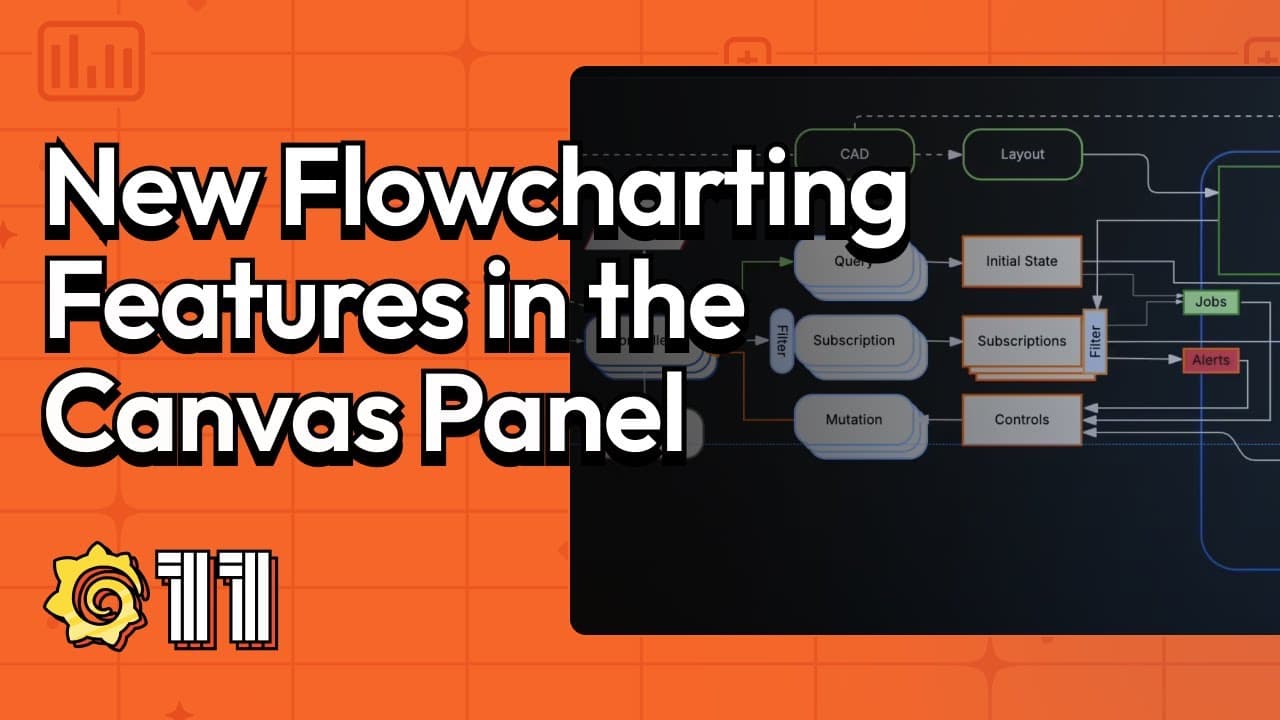
Since we introduced the Canvas panel in Grafana 9.x, it has grown in popularity — and in functionality. Along with introducing the ability to pan and zoom and to add interactive buttons, we are excited to introduce the following enhancements for the Canvas panel.
Flowcharting features: These improvements were in high demand within the community, and they include the addition of:
- Widely used elements: cloud, parallelogram, and triangle.
- Midpoint controls so that the connectors no longer have to be straight lines.
- More connector styles, including dashed lines as well as corner radius and direction control.
- Horizontal and vertical snapping for connectors.
- Rounded corner styling for elements.
- The ability to rotate elements in the canvas.
Universal data link support: We’ve updated data links so that you can add them to almost all elements or element properties that are tied to data in the Canvas panel. Previously, you could only add data links to text elements or elements that used the TextConfig object. This update removes that limitation.
Infinite panning: With this new editor option, you can now view and navigate very large canvases. This option is displayed when the Pan and zoom switch is enabled. To this try out, you have to enable the canvasPanelPanZoom feature toggle.
To learn more about all of these features, check out our Canvas panel documentation.
Color code table rows
Grafana 11 adds the ability to add a color to full table rows using the Colored background cell type in the table visualization. When you configure fields in a table to use this cell type, an option to apply the color of the cell to the entire row becomes available.
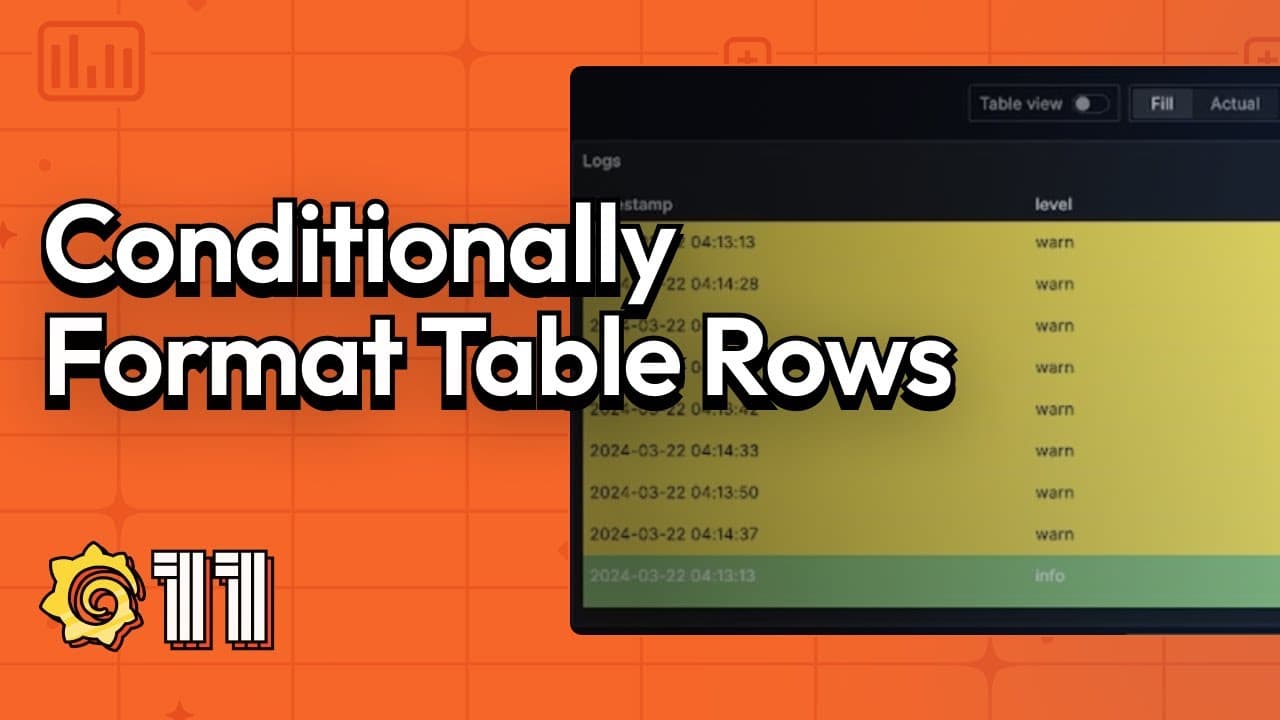
This feature is useful for a wide variety of use cases including mapping status fields to colors (for example, info, debug, warning) and allowing rows to be color-coded based on threshold values. This is one of the ways we make formatting tables more seamless, and enable you to quickly scan data using the table visualization.
To learn more, refer to the table visualization documentation.
Faster AI-powered titles and descriptions
No more wondering how to summarize all the data you packed into your dashboard in one title. Grafana 11 can help with that, thanks to a new AI-powered tool that automatically summarizes the information in your panels and dashboards and creates detailed titles and descriptions for your dashboards.
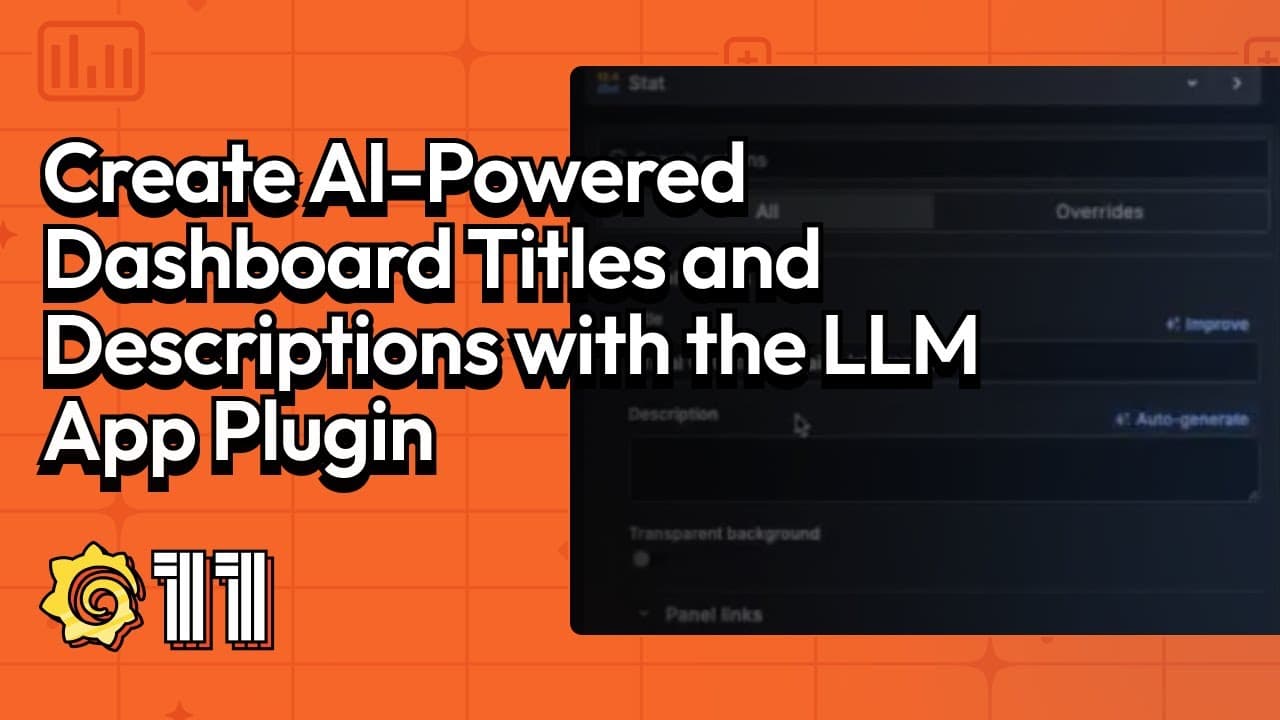
To try this feature, you need to enable and configure Grafana’s LLM app plugin. When enabled, look for the ✨Auto generate option next to the Title and Description fields in your panels and dashboards, or when you press the Save button.
Troubleshoot alerts with ‘Keep last state’
We are happy to (re)introduce the Keep last state feature to Grafana-managed alert rules.
A popular feature from legacy alerting, this functionality helps maintain and manage alerts when query responses or data sources are flaky. You can now choose to keep the last evaluated state of an alert rule when that rule produces No Data or Error results. Simply choose the Keep last state option for no data or error handling when editing a rule.
Refer to the Grafana Alerting documentation on state and health of alert rules for more information.
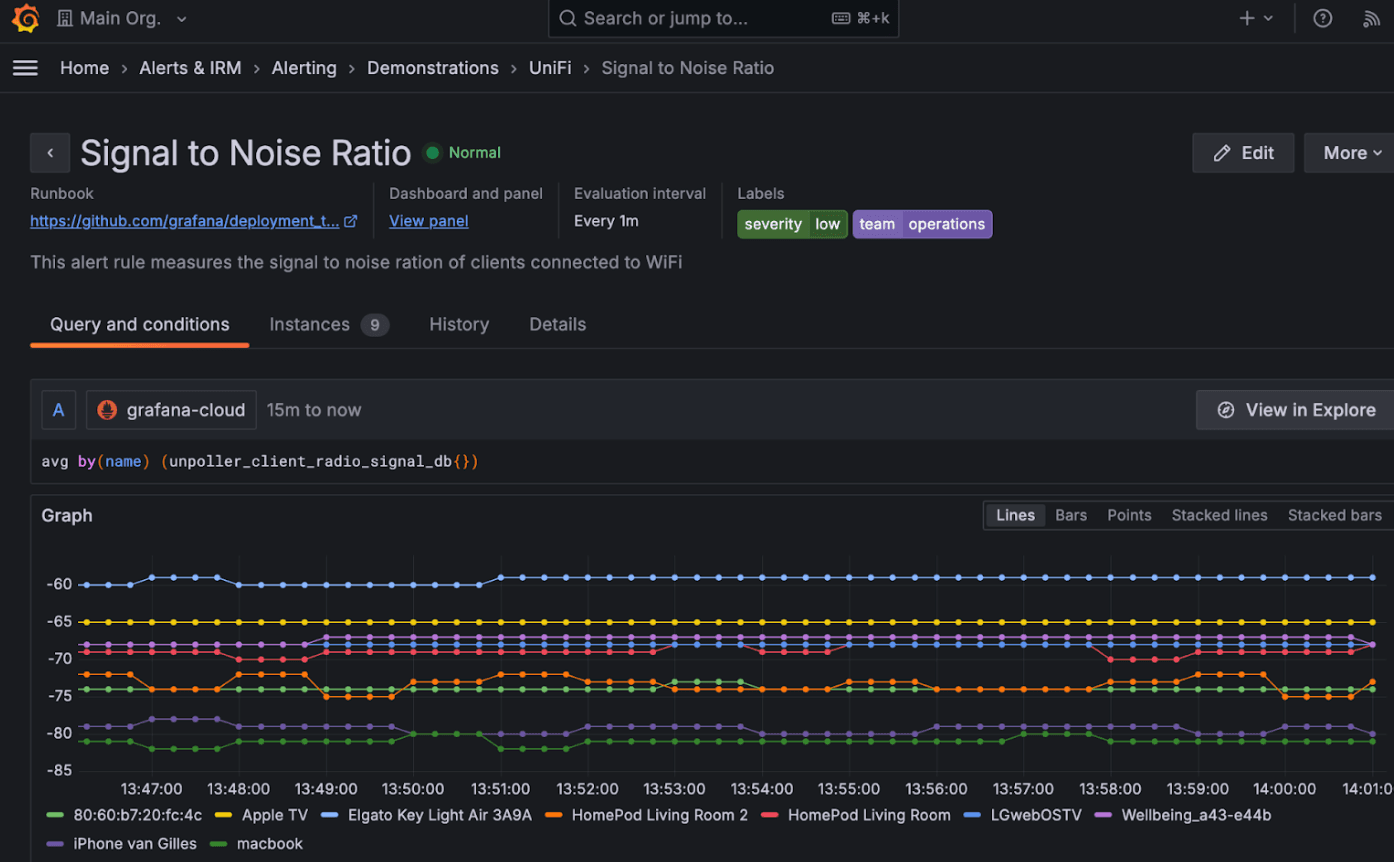
Improved overview of alert rule details
The alert rule detail view got a makeover in Grafana 11! Helpful metadata can now be found at the top of the alert rule detail view. The namespace and group info appear in the breadcrumb navigation, which is also interactive and can be used to filter rules by namespace or group. The rest of the alert detail content is split into tabs:
- Query and conditions: View the details of the query that are used for the alert rule, including the expressions and intermediate values for each step of the expression pipeline.
- Instances: Explore each alert instance, its status, labels, and various other metadata for multi-dimensional alert rules.
- History: Explore the recorded history for an alert rule.
- Details: Debug or audit using the alert rule metadata and view the alert rule annotation.
Legacy alerting to Grafana Alerting: How to migrate
We previously announced the deprecation of legacy alerting in Grafana 9. Legacy alerting will officially be removed from the Grafana codebase starting in Grafana 11, which will be generally available on May 14. Upgrade to the new Grafana Alerting in any version up to Grafana 10.4 to ensure there is no interruption with your alerting system. For more information, refer to our legacy alerting blog post, legacy alerting deprecation documentation, and learn how to upgrade to Grafana Alerting.
Easier to manage at scale
Over the past year, we focused on the platform observability teams who operate Grafana at scale, whether that entails dozens, hundreds, or even thousands of teams observing their software and infrastructure with Grafana. With them in mind, we prioritized improvements to access and authorization as well as reporting.
Organize Grafana dashboards with subfolders
Dashboards go into folders, and now … folders can go into folders! This sounds like a small change, but it has big implications.
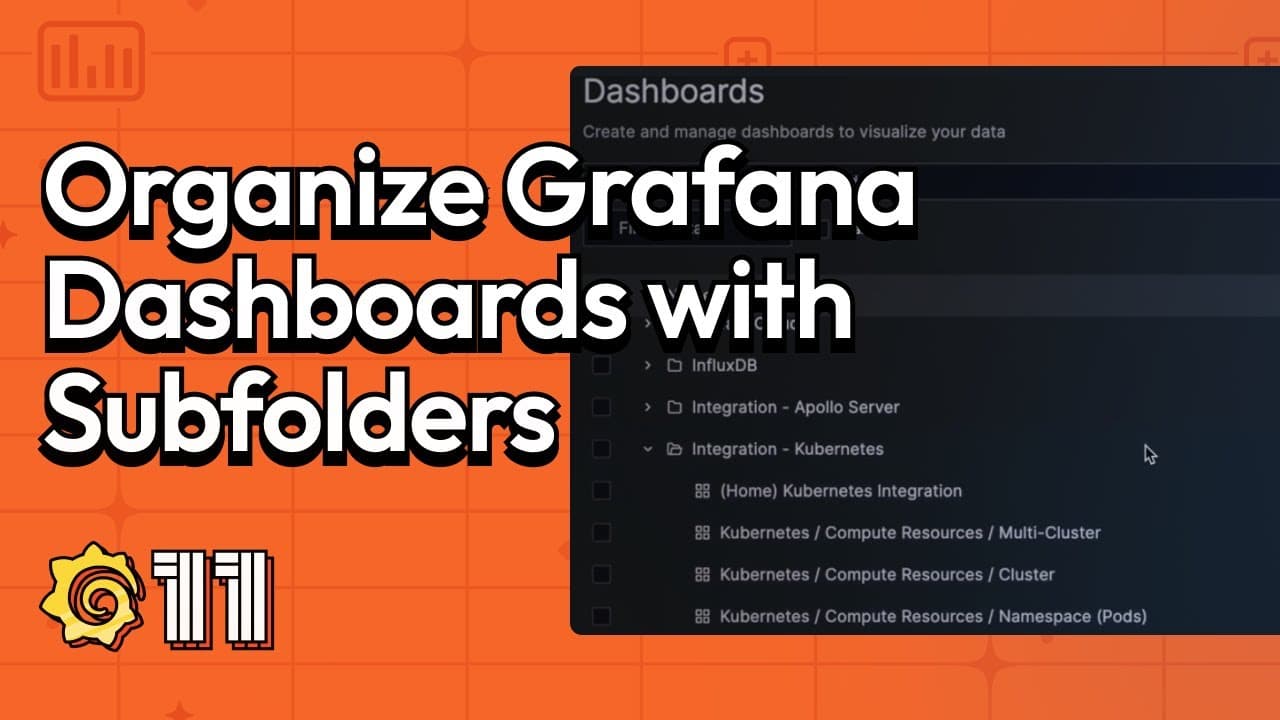
Some of you want subfolders in order to keep things tidier. It’s easy for dashboard sprawl to get out of control, and setting up folders in a nested hierarchy helps with that.
Others of you want subfolders in order to create nested layers of permissions, where teams have access at different levels that reflect their organization’s hierarchy.
Everyone, however, will benefit from the added layer of organization and order that subfolders introduce into Grafana, especially as organizations scale from tens to thousands of dashboards.
In the future, we’re planning to add features like archive and restore, so you can safely clean up unused dashboards, and improved search, so you can quickly find the dashboard you’re looking for.
User-based authentication in Azure Monitor data source
With this new experimental feature, it’s now possible to limit users’ access to certain data within the Azure Monitor data source.
If you use Azure Monitor, you can forward users’ credentials along with their queries, so that everyone using Grafana can only access the Azure Monitor telemetry that they can see in the Azure console.
To learn more, read our Azure Monitor documentation.

PDF export improvements
Tired of waiting for your PDF to generate or your report to be sent? We’ve been working on a major update of the Grafana dashboard-to-PDF feature to make it faster for larger, more complex dashboards.
The results: The PDF generation time will no longer be proportional to the number of panels in your dashboard. For example, a complex SLO dashboard containing roughly 200 panels has gone from taking more than seven minutes to only 11 seconds.
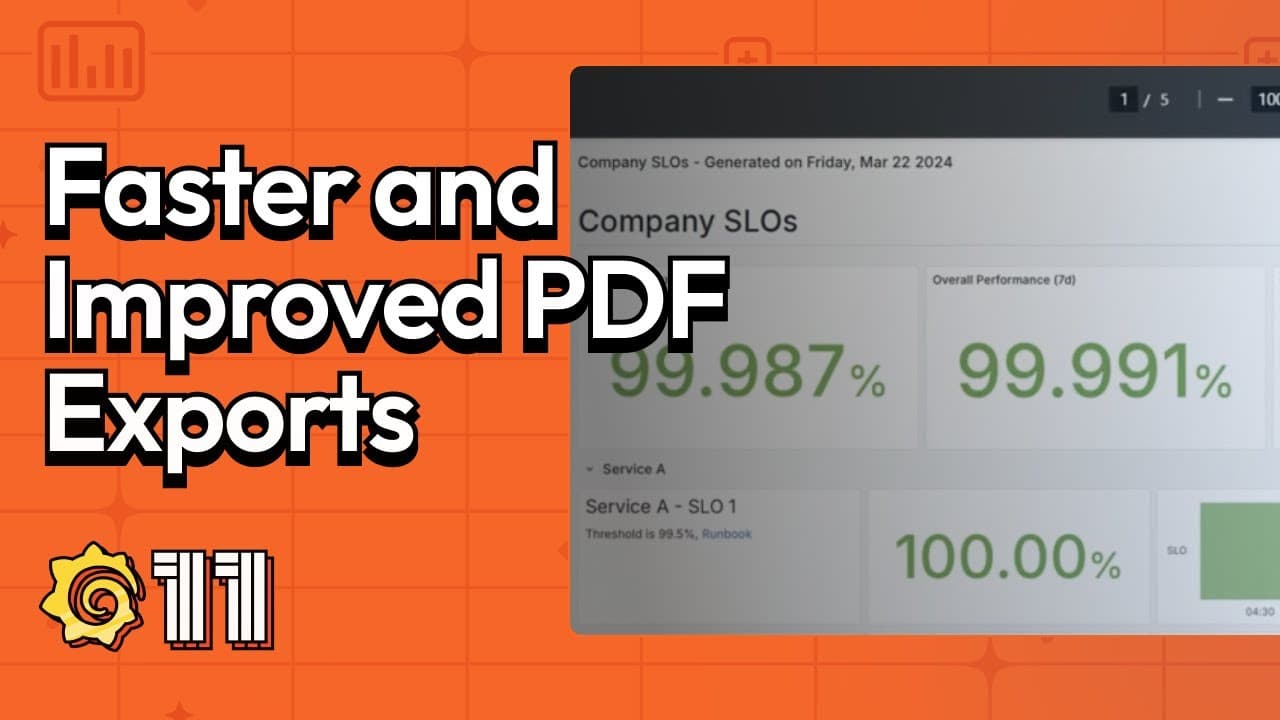
This update, available in public preview, also fixes all caveats related to rendering a report with panels or rows set to repeat by a variable, such as rendering repeating panels inside collapsed rows.
To try this update, enable the newPDFRenderingfeature toggle.
Easier to extend Grafana
If you’re one of the people who extend or contribute to Grafana, thank you! We appreciate your involvement in the greater Grafana community, which is now 20 million users strong. To show our gratitude, we have worked on making it easier to extend the power of Grafana with plugins and better plugin and app development tools.
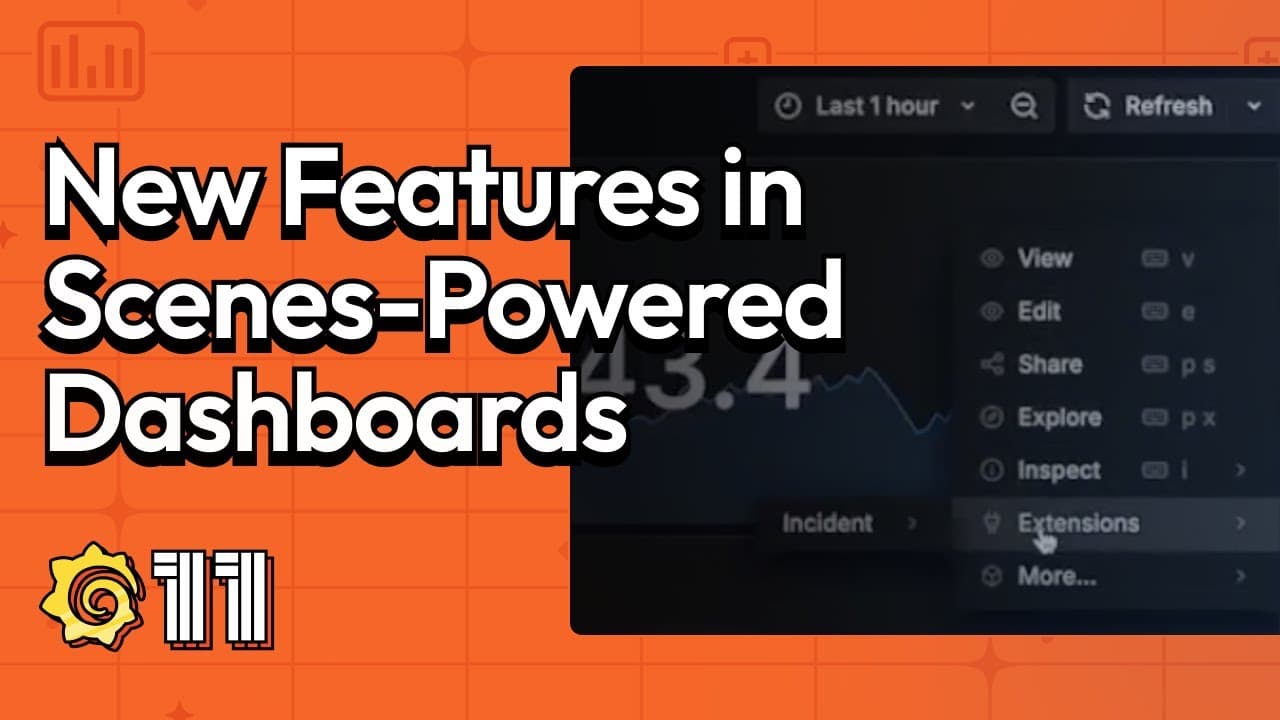
Scenes-powered dashboards
For Grafana 10, Grafana founder Torkel Ödegaard announced Scenes, our new frontend framework for Grafana dashboards. Now everything that comprises a dashboard — panels, variables, rows, time range, transformations, and sections — is a component that a developer can incorporate into an app.
Since then, we’ve been working on a major update of our dashboards architecture, which we are proud to announce has migrated to the Scenes library. This migration provides us with more stable, dynamic, and flexible Scenes-powered dashboards.
Want proof? Here are two improvements that we are introducing in Grafana 11:
- Edit mode: It’s sometimes hard to efficiently navigate through all the visual options during the dashboard editing process. With the introduction of the Edit mode, we aim to provide an easier way to discover and interact with the dashboard editing experience.
- Fixed positioning of template variables and time picker: We moved the time picker into the dashboard canvas and now, together with template variables, it will stick to the top as you scroll through your dashboard. This has historically been a highly requested feature that we’re happy to finally roll out for the community.
Build better apps with the Saga Design System
We recently launched the Saga Design System, a set of design elements, patterns, and guidelines that helps establish a shared visual language for all of Grafana Labs’ offerings. It is a resource for Grafanistas and the community with pre-established components and principles for crafting visually appealing and easy-to-use interfaces.

The team dedicated to expanding and growing the design system recently added organism-level templates to expedite the creation of more complex pages; various patterns to ensure that the Grafana experience is consistent and expected across the product; and Figma Community files (Light theme vs. Dark theme) to help create Grafana interface mock-ups in Figma. Be sure to follow along as the Saga Design System continues to mature and expand its offerings.
Learn more about Grafana 11
For an in-depth list of all the new features in Grafana 11-preview, check out our Grafana documentation, the Grafana changelog, or our What’s New documentation.
Join the Grafana Labs community
We invite you to engage with the Grafana Labs community forums. Share your experiences with the new features, discuss best practices, and explore creative ways to integrate these updates into your workflows. Your insights and use cases are invaluable in enriching the Grafana ecosystem.
Upgrade to Grafana 11
Download Grafana 11-preview today or experience all the new features by signing up for Grafana Cloud, which offers an actually useful forever-free tier and plans for every use case. Sign up for a free Grafana Cloud account today.
Our Grafana upgrade guide also provides step-by-step instructions for those looking to upgrade from an earlier version to ensure a smooth transition.
A special thanks to our community
We extend our heartfelt gratitude to the Grafana community!
Your contributions, ranging from pull requests to valuable feedback, are crucial in continually enhancing Grafana. And your enthusiasm and dedication inspire us at Grafana Labs to persistently innovate and elevate the Grafana platform.
Grafana Cloud is the easiest way to get started with metrics, logs, traces, dashboards, and more. We have a generous forever-free tier and plans for every use case. Sign up for free now!

