GrafanaCON 2024: A guide to all the announcements from Grafana Labs
Tulips in bloom. Sunny bike rides. The latest observability trends. All signs point to springtime in Amsterdam, where Grafana Labs is thrilled to host GrafanaCON 2024 in person for the first time in five years.
Our annual conference focused on all things Grafana and its extended open source ecosystem opened on April 9 with a sold-out crowd gathered to learn from 20+ talks, deep dives, and hands-on sessions covering Grafana, Prometheus, OpenTelemetry, Loki, Mimir, Tempo, and more. But before we dove into sessions about cool use cases for Grafana — from monitoring beer production to “obirdability” — we kicked off the two-day conference with an action-packed keynote filled with new OSS releases, the community winners from our annual Golden Grot Awards, and more.
In this blog post, you’ll find a roundup of the latest news out of GrafanaCON 2024. Curious to learn more? Don’t miss your chance to sign up for one of our recap webinars that will highlight all the GrafanaCON 2024 headlines. (We’re hosting these recap sessions in different languages to boot!)
Grafana 11 release
As is tradition, we provided a sneak peek of all the latest updates in Grafana 11 during the opening keynote of GrafanaCON. Grafana founder Torkel Ödegaard led a live demo of the latest visualizations and functionality designed to help run, manage, and extend Grafana within your observability ecosystem.

Grafana 11, which is available in preview today, includes exciting features, such as:
- Explore Metrics, a new queryless experience that allows you to dig into Prometheus metrics without writing any PromQL. (P.S. We also introduced a queryless experience for your logging data, too. Learn more in our Explore Logs blog post.)
- Scenes-powered dashboards, which includes a new dashboard editing mode and fixed positioning for template variables and time picker, as requested by the community!
- Flowcharting in the Canvas panel, which includes more connector styles (dashed lines, corner radius, direction control); horizontal and vertical snapping for connectors; and the ability to rotate elements.
- An improved alert rules overview, with helpful metadata at the top and more info in useful tabs.
And much, much more! For an in-depth list of all the new features in Grafana 11-preview, check out our Grafana documentation, the Grafana changelog, or our What’s New documentation.
You can explore all the new features by upgrading your instance or downloading Grafana 11-preview today. Can’t wait to get started? Sign up for Grafana Cloud, our fully managed observability platform that includes all of these Grafana features and much more. We have a generous free tier and plans for every use case. Get your free account today!
Note: This latest version of Grafana is a preview so you can start to test and play with the updates, but we don’t recommend deploying them in production just yet. We will be running internal testing until May 14, when Grafana 11 will be generally available.
Interested in hearing more? Check out our Grafana 11 release blog.
Grafana Loki 3.0 release
Five years after the project began, the team behind Grafana Loki, the popular open source logging project, is proud to announce the release of version 3.0. This major release brings key updates to log query performance and OpenTelemetry ingestion.

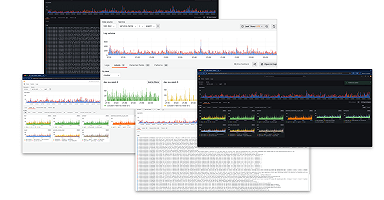
With Bloom filters, Loki now delivers accelerated queries that are more efficient when searching through log data for specific information. Instead of checking every log line, Bloom filters enable Loki to search for text strings, such as order ID or user ID, skipping large chunks of data that don’t contain the information you’re seeking. It’s like having a map that shows where the needle might be in the haystack of your log data, so you don’t have to search the whole thing.
In Loki 3.0, we also introduced native support for OpenTelemetry logs. In our 2024 Observability Survey, 54% of the respondents said they were using OpenTelemetry more than they did last year and OTel adoption continues to grow. With Loki 3.0, you can now ingest, store, and query OTLP logs and metadata to troubleshoot issues.
To learn more about the latest in open source logging, read the Loki 3.0 announcement blog.
Introducing Grafana Alloy
We are excited to announce our newest OSS project: Grafana Alloy, our open source distribution of the OpenTelemetry Collector. Alloy is a telemetry collector that is 100% OTLP compatible and offers native pipelines for OpenTelemetry and Prometheus telemetry formats, supporting metrics, logs, traces, and profiles.
We built Alloy on the foundation of our work with Grafana Agent, while also incorporating lessons learned from some of the toughest use cases we’ve seen over the years. As a result, Alloy — which is production ready and released as v1.0 — is broadly compatible with the most popular open source telemetry signals. Plus, it includes enterprise-grade features — such as native clustering for production at scale and built-in Hashicorp Vault support for enhanced security — all out of the box.
Go to our Grafana Alloy announcement blog to learn more about the newest open source project from Grafana Labs.
Introducing the 2024 Golden Grot Award winners
This year, we hosted our second annual Golden Grot Awards, recognizing the very best in professional and personal Grafana dashboards. Today, it’s our honor to introduce the 2024 Golden Grot Award winners, who were recognized on stage during the GrafanaCON keynote. Drum roll, please…
Monitoring a daily commute in Atlanta: Ruben Fernandez
Ruben built his personal dashboard to improve his daily commute in Atlanta, which can be drastically impacted by inclement weather and heavy traffic. He uses APIs and GTFS realtime feeds to pull in data from weather.gov and the Metropolitan Atlanta Transit Authority, as well as drive time and traffic information from Google Maps and Bing Maps. He also uses a Prometheus instrumentation library for Python to combine metrics and send them to Grafana Cloud via Grafana Agent.

Monitoring defects in steel alloys: Christopher Field
Christopher’s dashboard monitors the growth of defects in steel alloys caused by exposure to radiation for next-generation nuclear fission reactors and fusion energy. Images from electron microscopes are streamed to a time series database and machine learning models are used to instantly identify defects. This professional dashboard is shared internally with Christopher’s Theia Scientific colleagues, and other variations are used by US Department of Energy (DOE) national laboratories and research universities.

Congratulations to both of our winners and to all of our finalists!

To hear more about this year’s winners, check out our Golden Grots web page.
For more information about these announcements, read our complete press release about GrafanaCON 2024.


