How to perform multi-step API calls with Grafana
With its versatile palette of plugins and built-in integrations, Grafana empowers you to visualize your data, regardless of where that data is stored. Even if you need to make a direct request to a custom API, you can do that using the Infinity data source plugin, which is now officially maintained and managed by Grafana Labs.
However, there’s a very specific use case that often sparks questions within the community: multi-step API calls.
In this post, I’ll demonstrate how to make multi-step API calls with the Infinity data source plugin. I will use The Cat API, a fully protected and authenticated API to instantly fill your website or app with, well, cats. Because everyday is a Caturday, right?
The most common use case for multi-step API requests is to fetch an authentication token from the API, and then make a request to the same API using this newly obtained token. I will imitate this scenario by requesting a random cat breed from the API, and then creating another request to get a picture of that same breed.
I will also briefly cover how to perform multi-step data requests in Grafana Synthetic Monitoring.
Getting started: Install the Infinity plugin
Log into your Grafana Cloud account and navigate to the Connections panel. Search for the Infinity plugin and click the corresponding card.

Tip: Don’t have a Grafana Cloud account? Sign up for a forever-free one today!
Once installed, create a data source. Unlike many other Grafana plugins, the Infinity data source plugin doesn’t require any configuration at this stage. You can easily perform those configurations later, when you start using the data source, in Explore mode or while editing a dashboard.
Passing data between requests
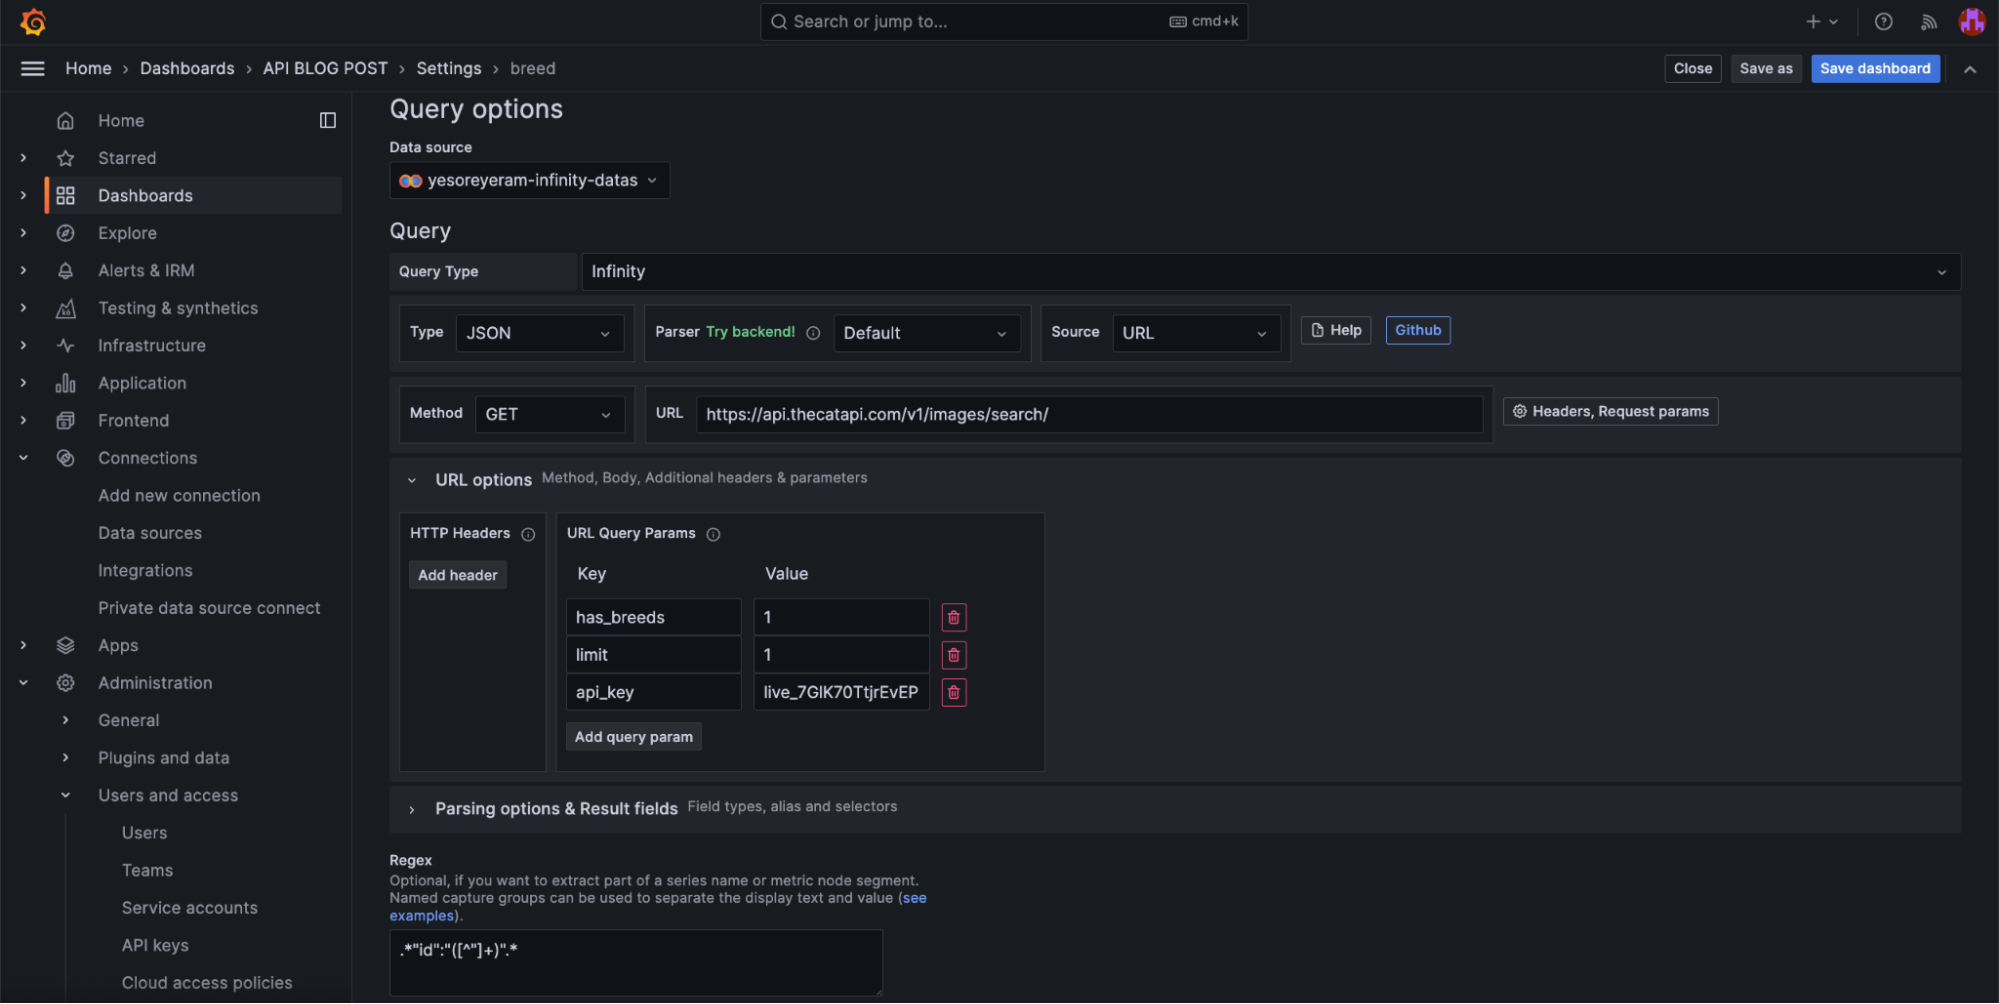
While Grafana currently lacks native support for creating a sequence of requests with data transfer between them, you can emulate this functionality using dashboard variables. To achieve this, create a variable that uses the parsed response of the initial request — which, in our example, is a random breed of cat — as its value.
Note 1: All Infinity plugin features available when compiling a request in Explore or a dashboard are also accessible when creating a variable.
Note 2: In the following examples, the API key is passed as a plain text request header. This approach is acceptable for our example, which uses a public dataset. However, for real-world applications, we do not recommend this method due to security concerns. Please refer to the Infinity plugin’s authentication section for secure authentication practices.
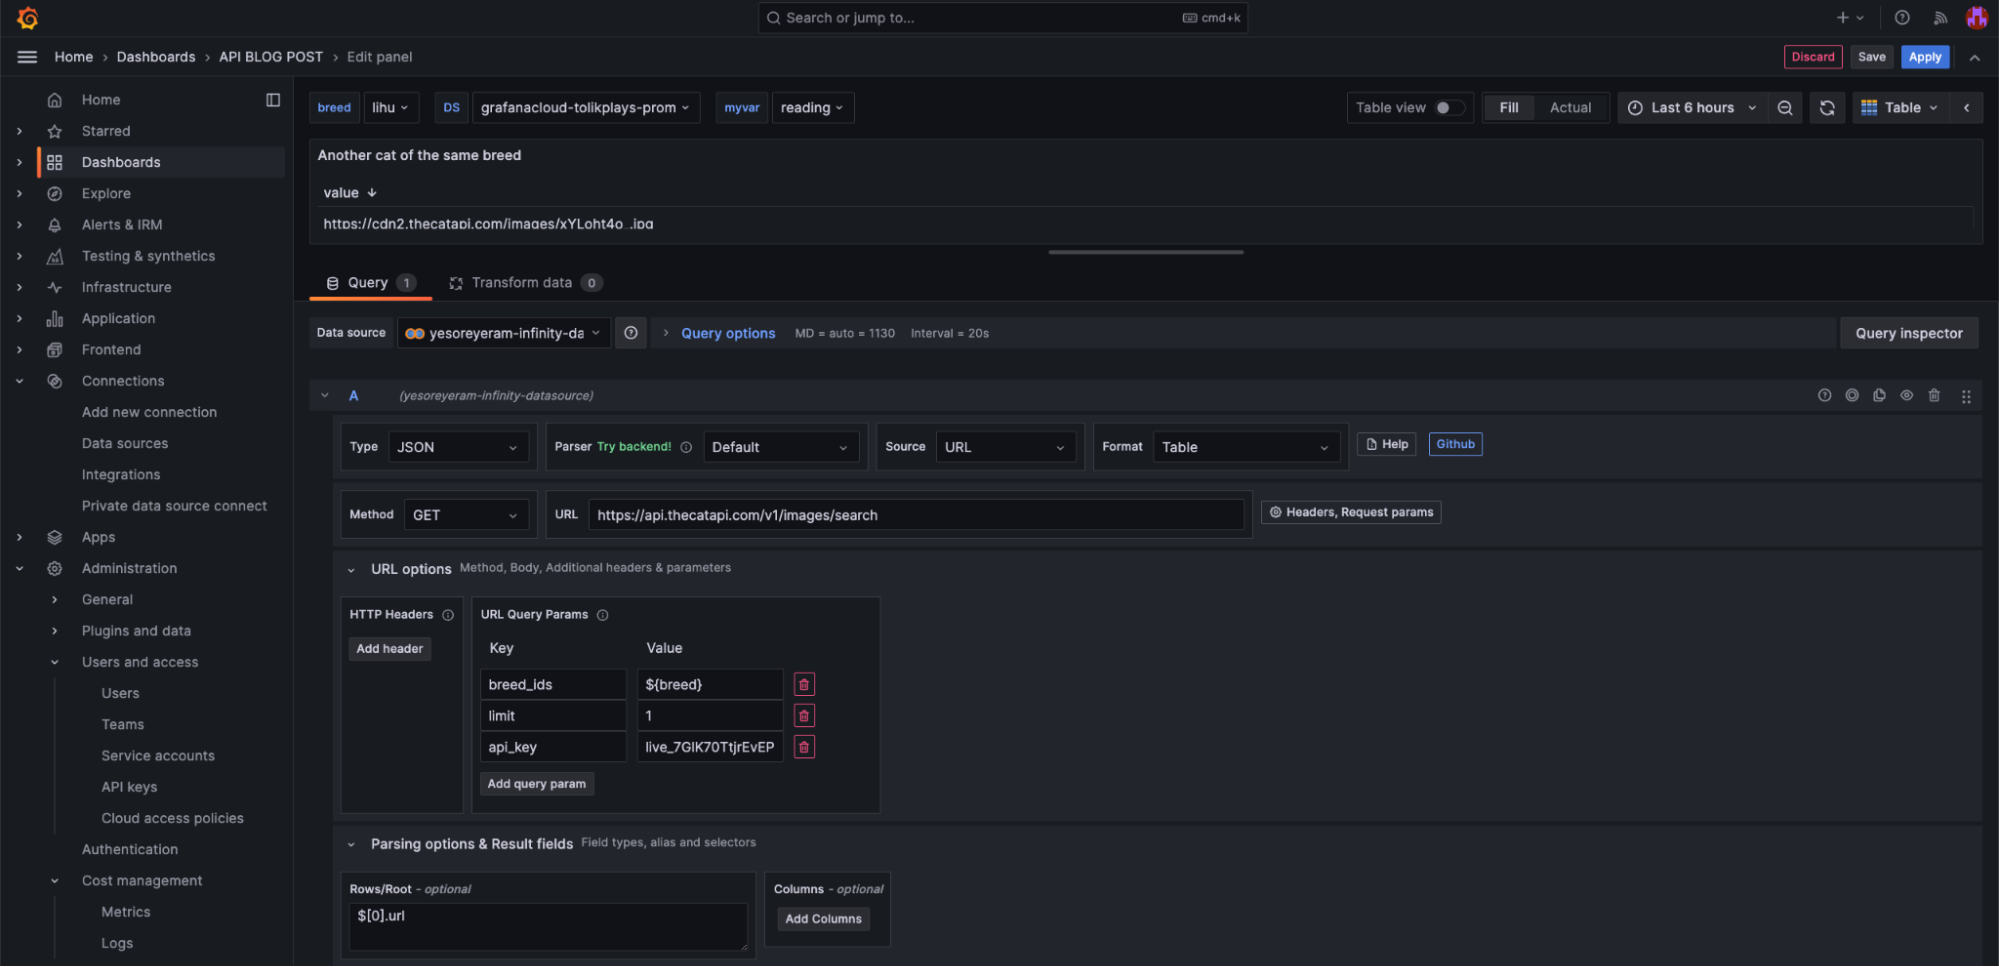
Subsequently, use this variable to initiate another request — in our case, to get an image of the cat breed we got in the initial request. For this step, you can create a panel on the same dashboard.
This approach outlined above is versatile and can be used for any multi-step data request, not just API calls.
Multi-step requests with Grafana Synthetic Monitoring
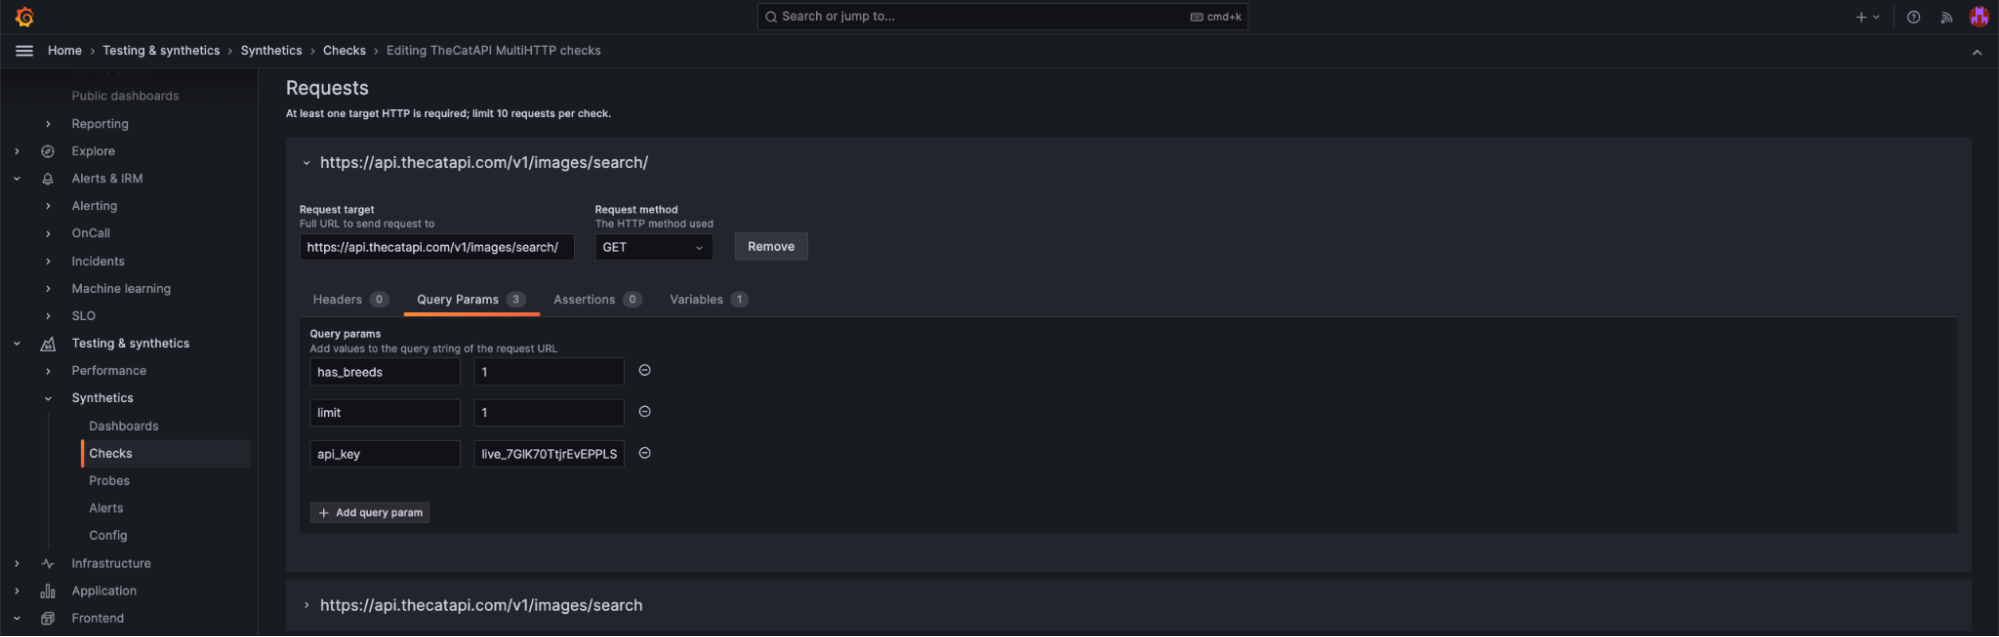
Another way to perform multi-step API calls or data requests in Grafana is with the MultiHTTP checks features in Synthetic Monitoring. MultiHTTP checks allow you to send multiple HTTP requests to different URLs within a single check. You can also use the results of one request in a later one, and make several assertions for each request. In Synthetic Monitoring, you can seamlessly perform the same actions we did in the previous sections within a single screen.
First, let’s configure query parameters to be able to use The Cat API.
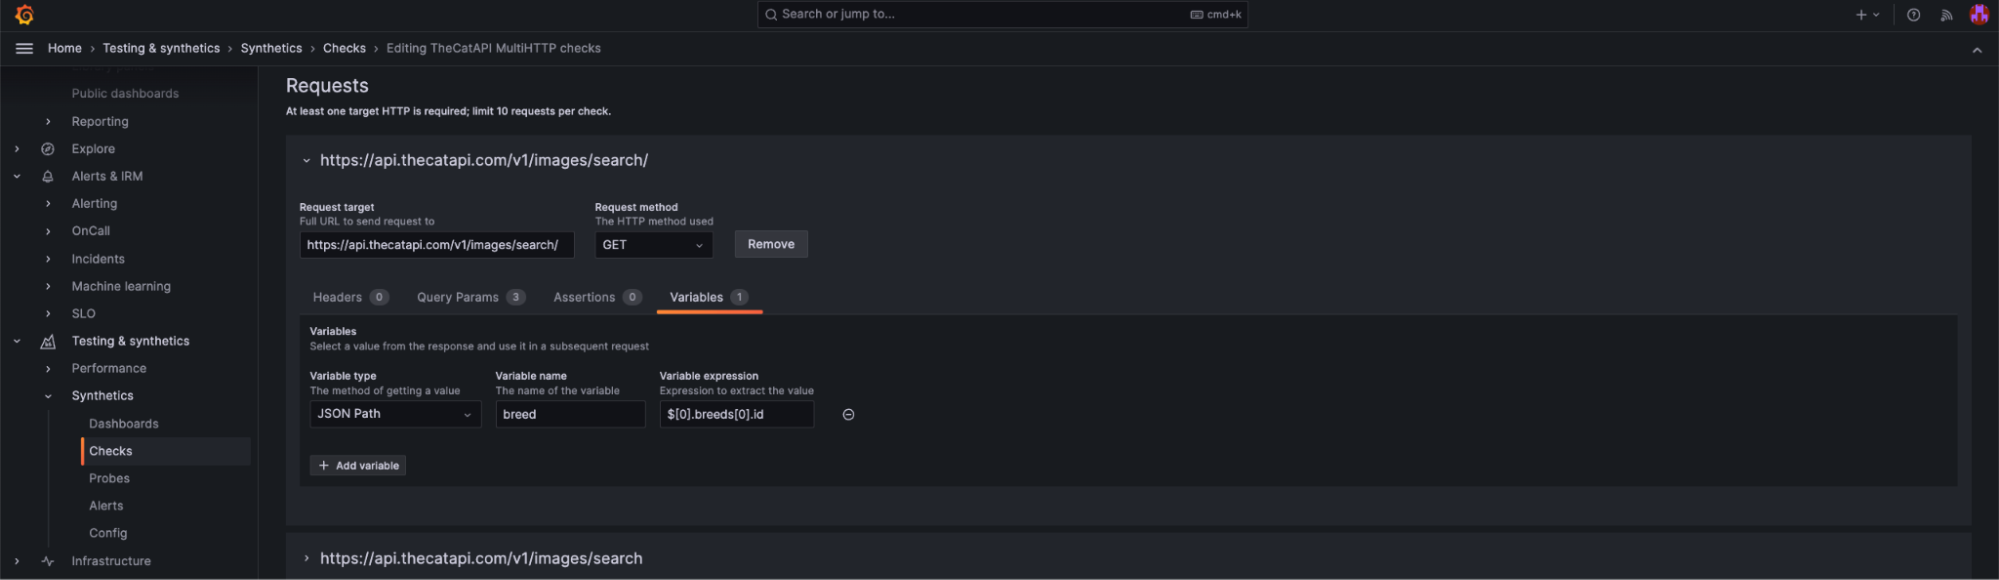
Then, as we did before, we use regex to extract the required information (breed) from the response and save it as variable.
Now, we can perform the second request, using the variable from the first one.
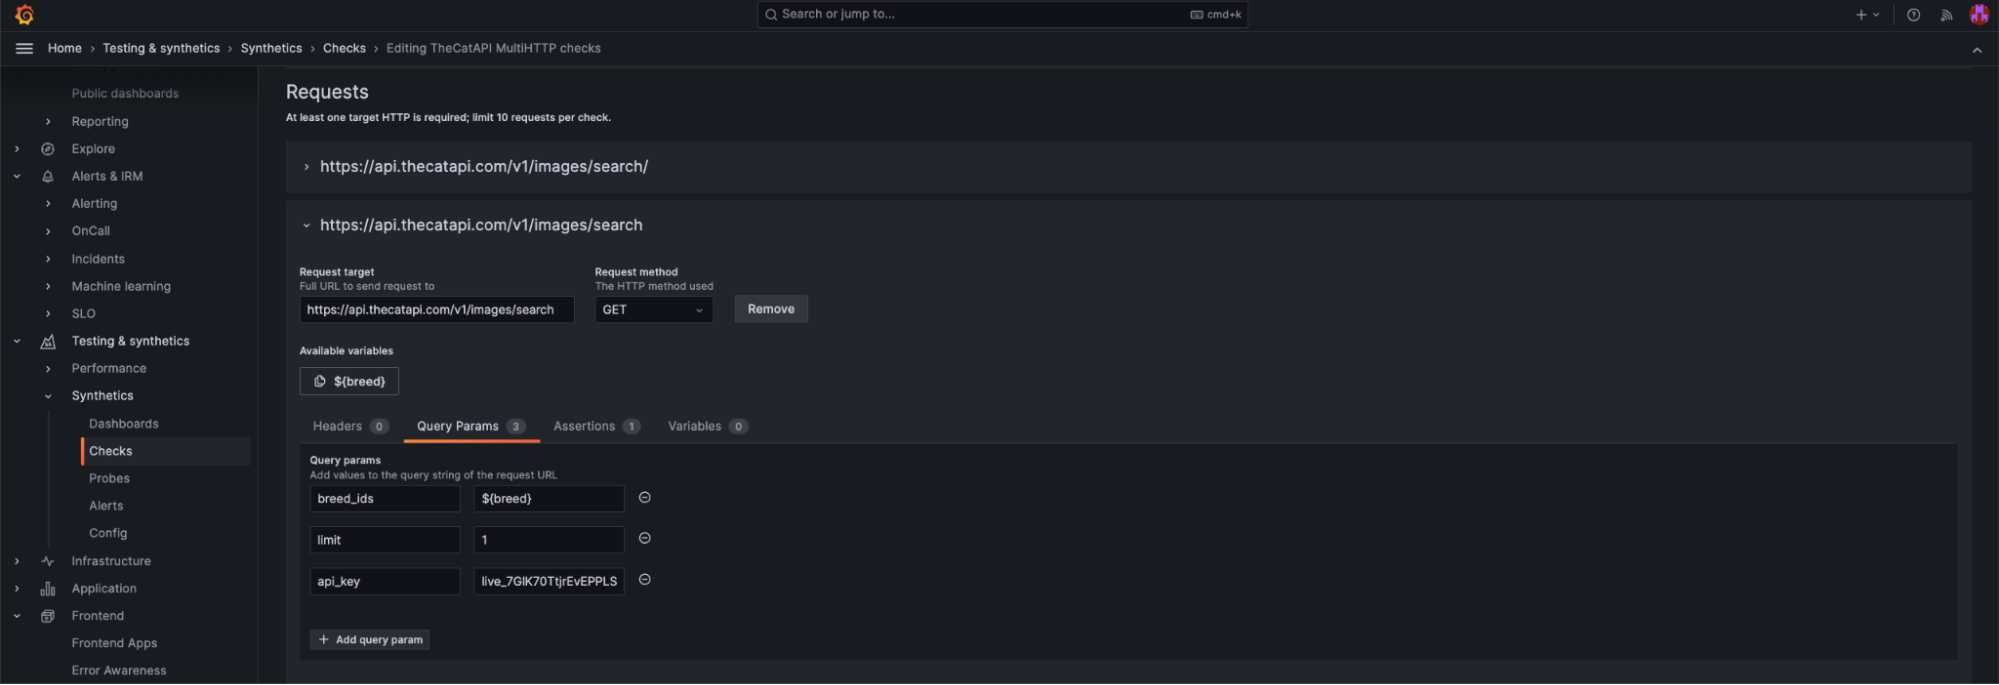
Done!
What’s next
As mentioned earlier, Grafana Labs is now officially maintaining the Infinity data source plugin, which means exciting developments are on the horizon. Stay tuned!
To learn more about the Infinity data source plugin, you can check out the plugin’s documentation and GitHub repo. In addition, these technical docs are helpful to learn more about Synthetic Monitoring.