

How to configure Grafana Loki with a Node.js e-commerce app
I recently changed teams within Grafana and now I get the chance to work with Grafana Loki, our highly effective open source log aggregation system that stores and queries logs from your infrastructure or applications. At Grafana, we always dogfood our products so what better way to learn more about Loki than trying out a simple use case that I can actually benefit from.
Land of metrics and honey
Beekeeping has been my dad’s hobby ever since childhood. As an adult, he turned his interest into an investment, and he now runs a small family business selling honey in Romania called Gradina cu Stupi. (Translation: The Garden of Honey)

Above: My dad’s beehives that are used for his online honey business.
Ironically, I’m afraid of bees. But to support my dad’s very sweet business, if you will, I get to incorporate my favorite childhood hobby: wiring up websites. A perfect match!
To help my dad manage his online operations and sales, I maintain his business site, which runs a Node.js Express server written in Typescript on the backend.
Every now and then, we discover that customers have been facing issues online: They can’t search for products; they can’t log in; they can’t place an order. But the only way I find out about these problems right now is if a customer calls us. That’s not ideal! How many orders has my dad lost so far because of these issues? I couldn’t tell you.
I wanted to uncover what was causing our customers’ sticky situations and gain more visibility into the business. So I started with adding logging capabilities to better support our website visitors and I’m going to tell you all about the journey. Here is what we’re going to do in this blog post:
- Create a free Grafana Cloud account.
- Send logs from our Node.js app to Grafana Cloud Logs (which is powered by Grafana Loki).
- Query the logs.
- Build some neat dashboards in Grafana.
The setup
Normally people read logs from files. I’m running the website on Google’s PaaS offering, Firebase. So I don’t have access to the file system and I would like to have a place to send my logs.
The first thing that I looked at is how to send my logs over to Grafana Loki. There’s a supported list of clients, but those are best for larger and more configurable deployments. Since I’m running a small website, I needed something simple. I don’t have access to the infrastructure, so I decided to use one of the unofficial clients for JS: winston-loki. The library is going to batch my log messages and send them via API to Loki. However, you can choose whatever client library suits you best.
Create a Grafana Cloud account
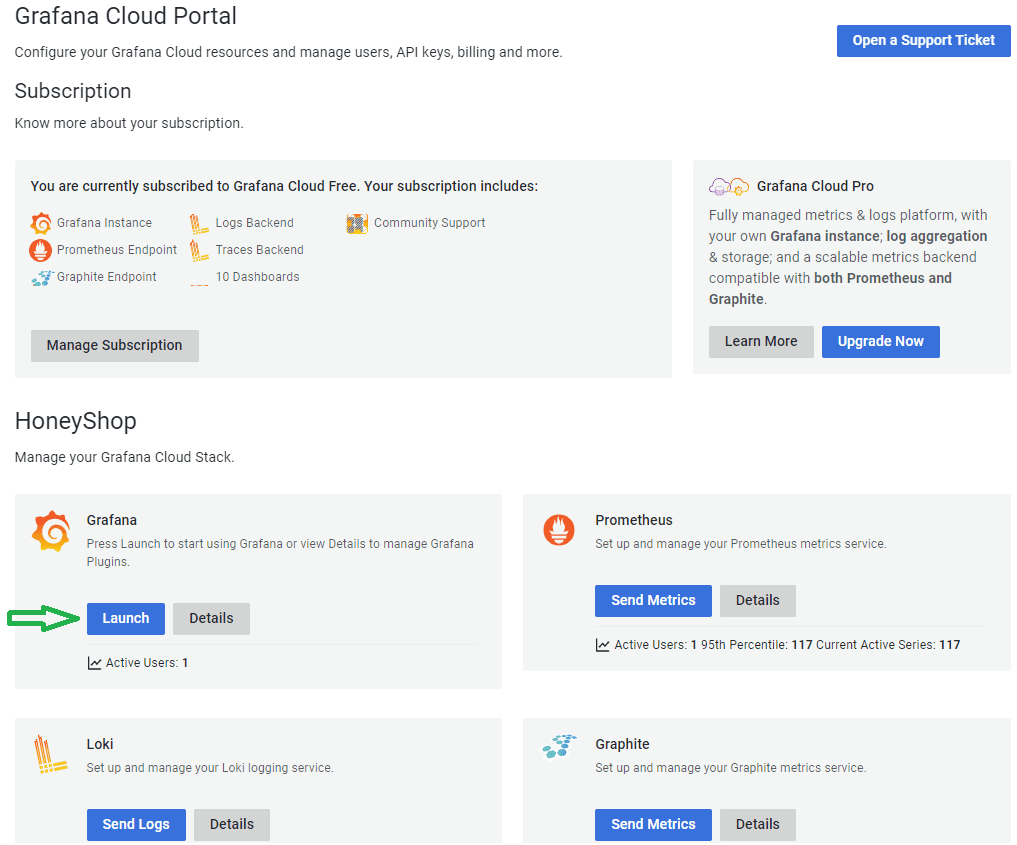
First things first: Let’s create a free account with Grafana Cloud. I used my Google account to sign up for mine. Then, in the Grafana Cloud portal, click Send logs.
Get your unique URL to which you’ll send logs via API. It looks like this: https://197263:<Your Grafana.com API Key>@logs-prod-eu-west-0.grafana.net/loki/api/v1/push

Let’s check if that works. I’m using Postman to do a POST request to the API with the following payload:
{
  "streams": [
    {
      "stream": {
        "level": "info",
        "app": "bees"
      },
      "values": [
        [
          "1653489469000000000",
          "{\"level\":\"info\",\"message\":\"Hello world!\"}"
        ]
      ]
    }
  ]
}
Next, back in the Grafana Cloud portal, launch Grafana, and go to Explore.
With a quick query, we can see our log message!

Send logs to Grafana Cloud Logs
My goal is to log every incoming request together with the response time coming to my Express HTTP server and any unhandled errors.
To the code!
Install required libraries
I installed winston-loki to my project using npm.
I like to initialize my logger into one single place so I’m using a singleton. Here’s my logger initialization code:
import { createLogger, transports, format, Logger } from "winston"
import LokiTransport from "winston-loki"

let logger: Logger

const initializeLogger = () => {
  if (logger) {
    return
  }

  logger = createLogger({
    transports: [new LokiTransport({
        host: "<YOUR API URL GOES HERE (FROM PREVIOUS STEP)>",
        labels: { app: 'honeyshop'},
        json: true,
        format: format.json(),
        replaceTimestamp: true,
        onConnectionError: (err) => console.error(err)
      }),
      new transports.Console({
        format: format.combine(format.simple(), format.colorize())
      })]
  })
}

export const getLogger = () => {
  initializeLogger()
  return logger
}
Replace the placeholder with your Logs URL: https://<API_KEY>@logs-prod<datacenter>.grafana.net. Be careful not to add the resource path; winston-loki adds that itself.
Now, let’s try it out!
const logger = getLogger();
logger.info("Starting app...");
Bummer, it doesn’t work. After a good hour of debugging, I noticed that winston-loki works fine with local instances of Grafana Loki, but it doesn’t authenticate properly to send requests to [Grafana Cloud Logs](https://grafana.com/docs/grafana-cloud/logs/?pg=blog&plcmt=body-txt).
I didn’t want to fork the code to fix the issue and overcomplicate things. Looking again for a simple solution, I found this neat package which I installed using npm: patch-package. I suggest scanning the documentation first to better understand how it works and if it’s right for you.
My patch file with a quick fix looks like this:

I added a postinstall script to my packages.json to run patch-package after I build my application:
"postinstall": "patch-package"
Now everything works like a charm, and we’re back on track.
Add two Express middlewares for logging
I’m using two Express middleware — one to log incoming requests and response time, and the second to log unhandled errors.
Here’s what they look like:
responseTimeLogger.ts
import { getLogger } from "./logsInitializer";

export const logResponseTime = (req, res, time) => {
	const logger = getLogger();
	let method = req.method;
	let url = req.url;
	let status = res.statusCode;

	logger.info({
		message: `method=${method} url=${url} status=${status} duration=${time}ms`,
		labels: { origin: "api" },
	});
};
errorLogger.ts
import { getLogger } from "./logsInitializer";

export const logError = (err, req, res, next) => {
	let method = req.method;
	let url = req.url;
	let status = res.statusCode;

	const logger = getLogger();
	logger.error({
		message: `method=${method} url=${url} status=${status} error=${err.stack}`,
		labels: { origin: "api" },
	});
	next();
};
I’ve installed response-time using npm to use it with my function.
Now we need to use these two middlewares in our Express app, and we’re done:
const PORT = Number(process.env.PORT) || 8080;

export const bootstrap = () => {
    const logger = getLogger()

    logger.info("Starting app...")

    const app = express()
    app.use(express.json())

    app.use(responseTime(logResponseTime))
    app.use('/', router)
    app.use(logError)

    const server: object = app.listen(PORT, () => {
        logger.info(`App listening on port ${PORT}`)
    })
    return server
}

bootstrap()
That’s it! Now you can deploy and run your application.
Going back to Grafana Explore, we can start searching through our logs using LogQL.

Query the logs in Grafana Cloud
You can easily navigate through your logs using LogQL, Grafana Loki’s PromQL-inspired query language, within Grafana Explore. Let’s try a few examples:
- Fetch all the logs in the selected time range.
{origin="api"} - See all the errors
{origin="api"} |= "error" - You can also get metrics out of your logs! Let’s see the number of requests by API name
LogQL is very powerful, and you can filter your logs in any way you want once you understand its syntax and capabilities. There’s also a new Grafana Loki query builder that we introduced in Grafana 9, which helps users write, edit, and understand simple and complex queries — no LogQL experience required.
Build some neat Grafana dashboards
Speaking of getting metrics out of our logs, let’s create some time series visualizations using our logs.
Here’s what mine look like:

I have a Business section that shows “Orders placed” and “New user registrations” in the selected time range using stat panels.
My Performance section shows request counts and latencies, and I’m planning to create alerts in the future to get notified in case anything goes wrong.
I have also enabled Synthetic Monitoring and as a result, I got an out-of-the-box dashboard showing the health of my website.

Sales are buzzing again
All of these changes have already helped me uncover a silly bug that caused customer orders to fail: Adding certain products to the shopping cart caused an out-of-bounds error for users. As a result, my dad roughly lost about 7 to 15 orders per month in the last two years. Luckily, now that I’ve configured Grafana Loki, this is no longer a problem that can sting our bottom line.
I hope this post helps you quickly gain some useful insights into your own Node.js applications — and that you can enjoy the sweet rewards as a result.
Grafana Cloud is the easiest way to get started with metrics, logs, traces, and dashboards. We have a generous free forever tier and plans for every use case. Sign up for free now!

