Grafana 9.0: Prometheus and Grafana Loki visual query builders, new navigation, improved workflows, heatmap panels, and more!
GrafanaCONline, our annual community event designed for Grafana open source users and dashboarding enthusiasts, also marks the general availability of Grafana’s latest and greatest release. Grafana 9.0 is now available to both open source and Grafana Enterprise users, and is being rolled out to Grafana Cloud users incrementally. (The majority of instances have already been upgraded!) New Grafana Cloud users will immediately get the Grafana 9.0 experience.
Grafana 9.0’s primary focus is to improve Grafana’s user experience, making observability and data visualization easier and more accessible for everyone. Whether through the Prometheus and Loki visual query builders or panel and dashboard search functionality, Grafana 9.0 introduces newer workflows to make it easier and more intuitive to discover and investigate your data. No major release of Grafana would be complete without a brand new dashboard panel. The new heatmap panel gives you access to a fast and powerful histogram visualization with high resolution and granular control over color spectrums.
Another headline in this major release is improvements to Grafana Alerting. At last year’s GrafanaCONline, we unveiled a new alerting experience to streamline and simplify alert creation and management across multiple data sources and Grafana deployments. If you want to learn about what’s new with alerts in v9.0, check out our “Alerting in Grafana 9: What’s new and improved” session from GrafanaCONline on demand.
For a look at all the newest features, watch Grafana creator and Grafana Labs CGO/Co-founder Torkel Ödegaard and Grafana team members Ivana Huckova and Giordano Ricci go through an in-depth demo in the “Deep dive into Grafana 9” GrafanaCONline session, available for free on demand.

If you want to get your hands on these new features right away, you can get started in minutes with Grafana Cloud. Sign up for a free account now!
Grafana 9.0: The highlights
Ease of use has always been a guiding principle for the Grafana project. Grafana 9.0 continues to improve usability while addressing these three core areas.
Discover your data
- Visual Prometheus query builder
- Visual Grafana Loki query builder
- Explore-to-dashboard workflow
- New heatmap panel
- Command palette
- Panel search
- Traces panel in dashboard
- Dashboard preview
- New navigation
Act on your data
Secure your data
Visual Prometheus query builder
As powerful as PromQL is as a query language, let’s face it — it’s not the easiest when it comes to writing queries, let alone understanding them. For Prometheus newbies, it can be daunting to begin writing queries.
The new query builder for Prometheus was built to solve precisely this problem. With Grafana 9.0, you will see a brand new visual query builder interface within Explore that allows anyone to compose, edit, and understand what a query does.
Multiple ways to write queries
The Explore interface you’re already familiar with now has added toggle fields to choose between writing a PromQL query in text edit mode (Code) or visual builder mode (Builder). When you select the Builder mode, a new visual interface allows you to craft your queries by choosing the metric of interest through a multi-word search dropdown menu. You can switch between these modes while having your text changes preserved.
Build your query with metric and label filters
This new query builder allows you to search and select a metric through a multi-word search. You can start either by selecting a metric or a label filter, as they both act as filters on each other.
Perform mathematical operations on metrics
The Operations field is used to perform mathematical manipulations on the metrics of interest through various functions, aggregations, and binary operations. You can layer these operations via the + Operation button. As Operations are presented in the order they are executed, not in the inverted order they are written in the text query, it makes it a lot easier to read and edit queries.
Continuous learning with in-app guides
If you are new to PromQL, you can use the third mode, Explain, to understand already written queries through in-app guides. You can switch between the Builder mode and Explain mode, while preserving the query, to learn more about the metric being queried and operation performed.


The new visual builder also has suggestions called “hints” that suggest the right operations, customized for the metrics under consideration, with common but difficult actions like graphing a histogram.

Visual Grafana Loki query builder
In Grafana 9.0, writing LogQL queries also gets an assist with a visual query building interface. In many ways, LogQL is more complex and has more syntax to remember than PromQL. The new query builder will help you write and understand Loki queries without having to memorize any of the syntaxes.
In the Loki query builder shown below, you can add and edit label filters, line filters, parsers, and functions. The Loki query builder supports all the features listed for the Prometheus query builder above, including nested binary operations, explain mode, and the ability to switch between text edit mode and visual builder mode while preserving changes.

Explore-to-dashboard workflow
While Grafana always supported the ability to move from dashboards to Explore without losing context, the reverse was not possible. This resulted in a sub-optimal experience, especially at scale, with users having to rewrite queries, without any errors, within dashboards.
Good news: Grafana 9.0 unveils a new Explore-to-dashboard workflow that allows you to create panels or dashboards directly from the Explore mode. When a complex query works, you no longer need to painstakingly copy it or rewrite it to a new dashboard. Instead, simply instruct Grafana, with a click of a button (see image below), to create a new panel/dashboard or add to an existing one directly from Explore. The generated panel contains all the panel’s queries and a default visualization automatically picked from the current results shown in Explore.

New heatmap panel
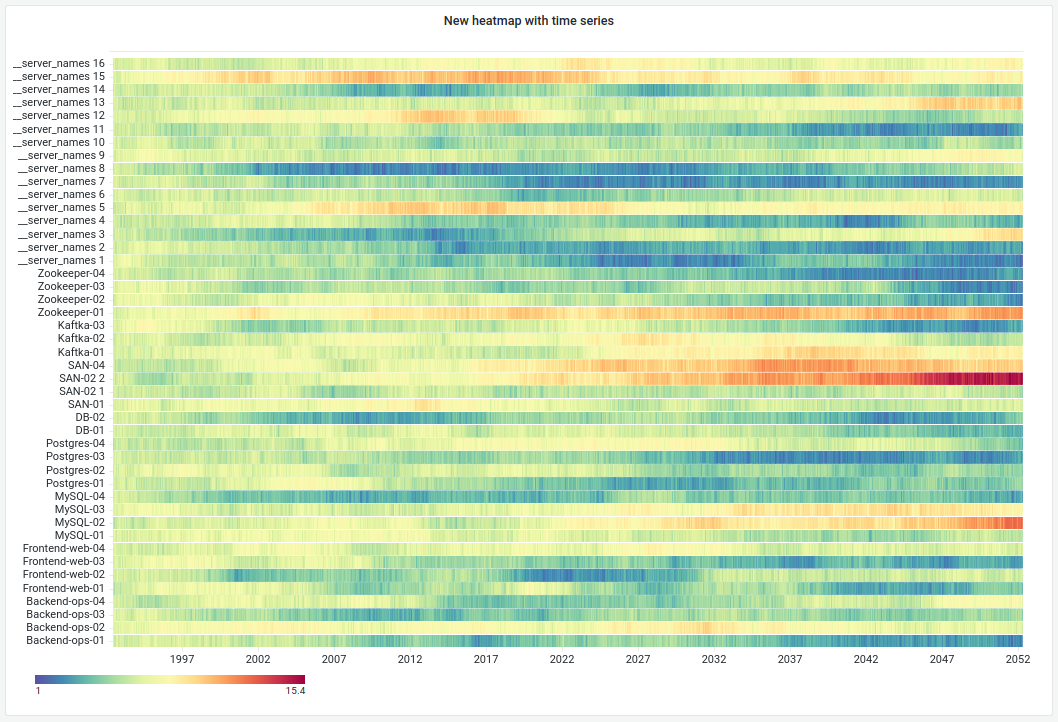
The new and revised heatmap panel underwent an architectural change that makes it highly performant (capable of rendering many time series on over 200,000 data points) and orders of magnitude faster. Apart from performance, the resolution on the heatmap panels is high, and you now have customizable and granular control over color spectrums.
Command palette
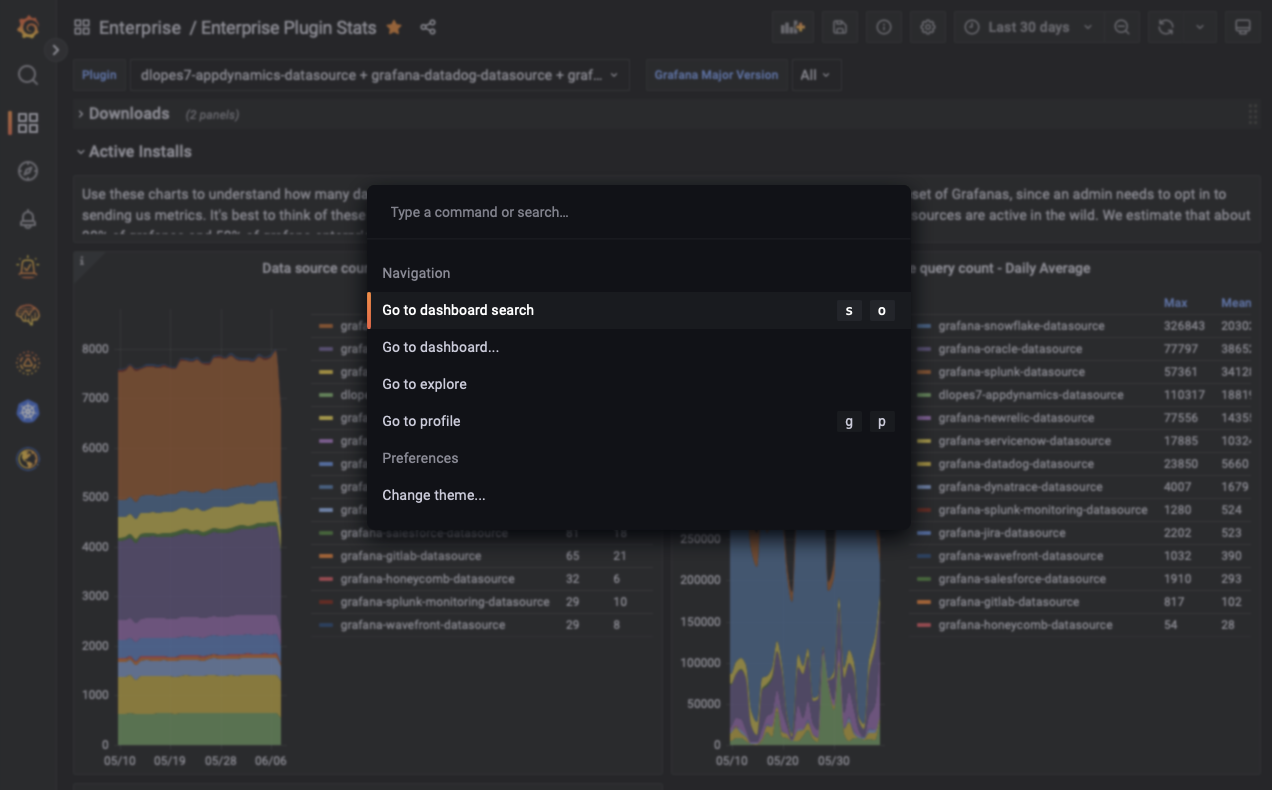
The command palette is a great productivity boost for those of you glued to your keyboards. Using cmd+K (MacOS) or ctrl+K (Linux/Windows), you can pull up a palette of commands that enables easier navigation and dashboard search. Depending on where in Grafana’s UI you are, you can either quickly run a query, switch to split views and back, navigate between dashboards, or change theme preferences.
Panel search
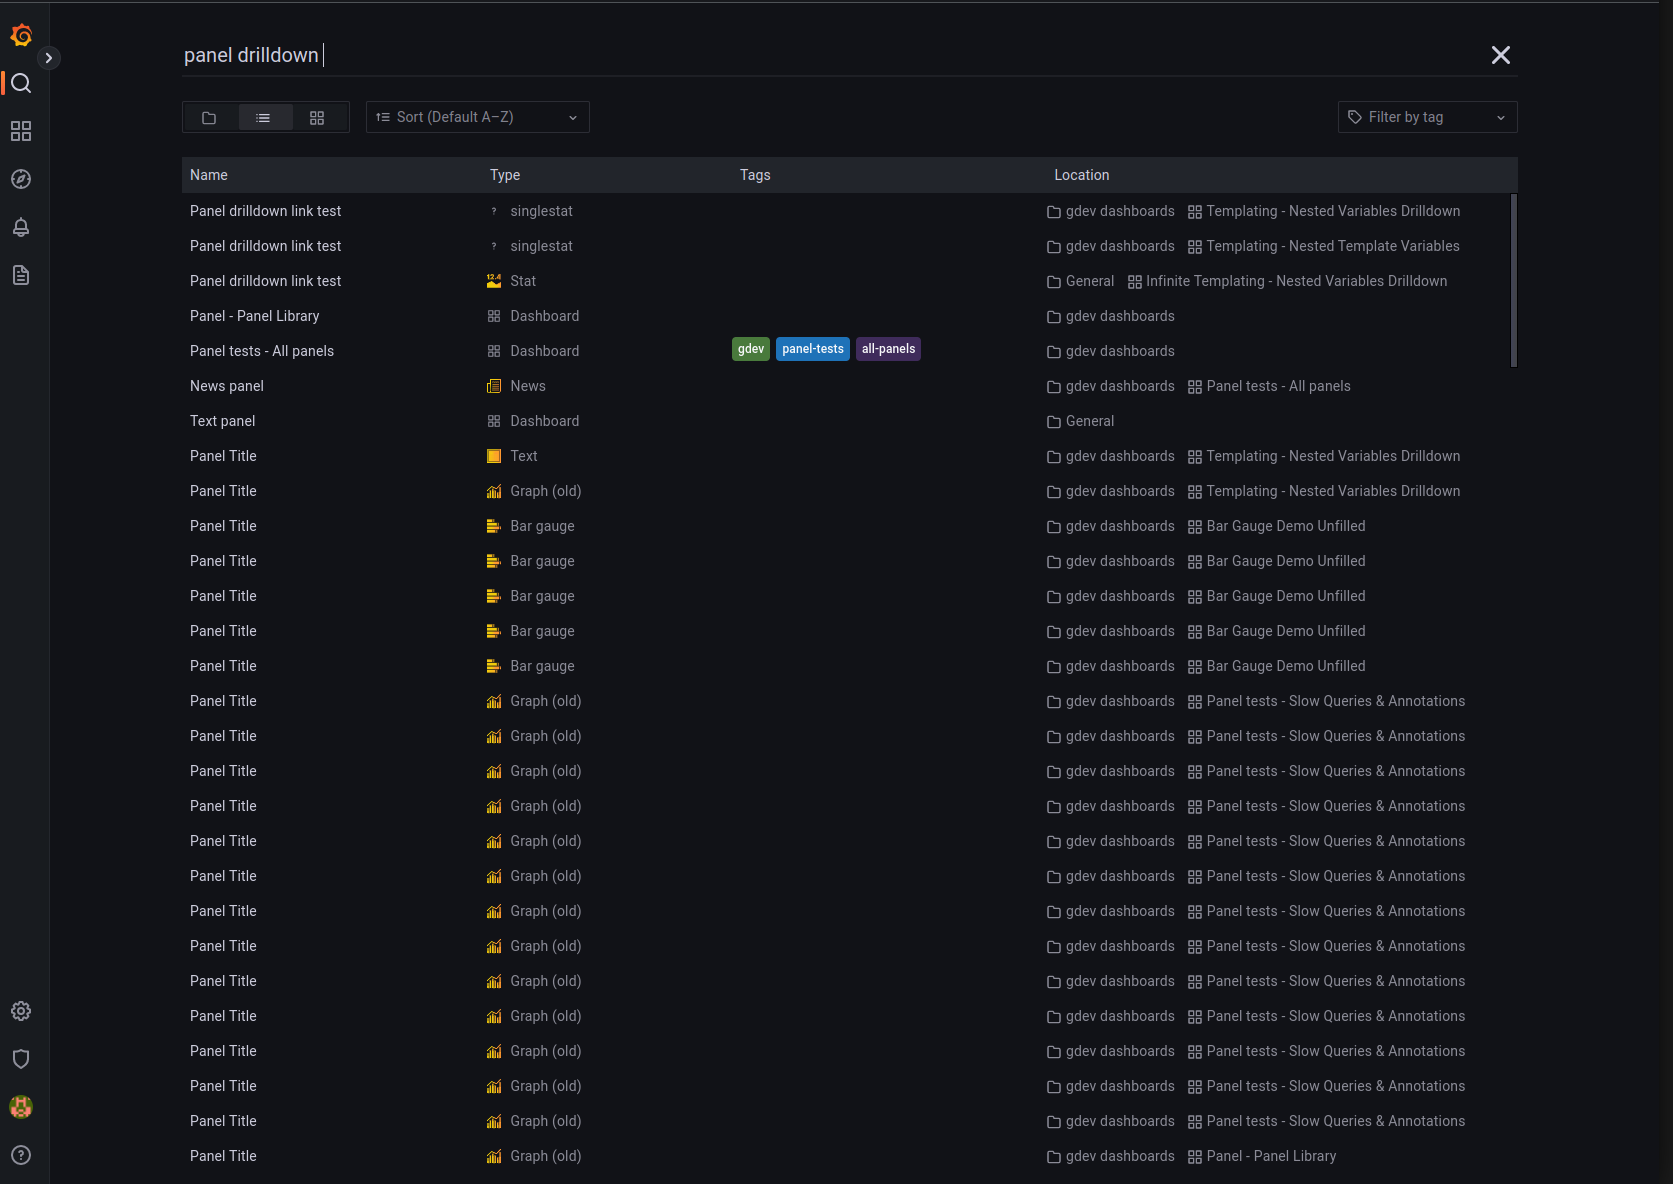
If you manage multiple dashboards and many different panels under each dashboard, searching for the panel titles can optimize the time spent scrolling through the dashboards or switching between dashboards to find the right panel. With the latest update to the search functionality, you can now search panels by titles. (This is currently an opt-in feature.)
Traces panel in dashboard
With Grafana 9.0, you can now add the traces panel to dashboards to visualize your traces via trace view instead of viewing them in Explore mode. This feature is currently in beta in Grafana 9.0.
Dashboard preview
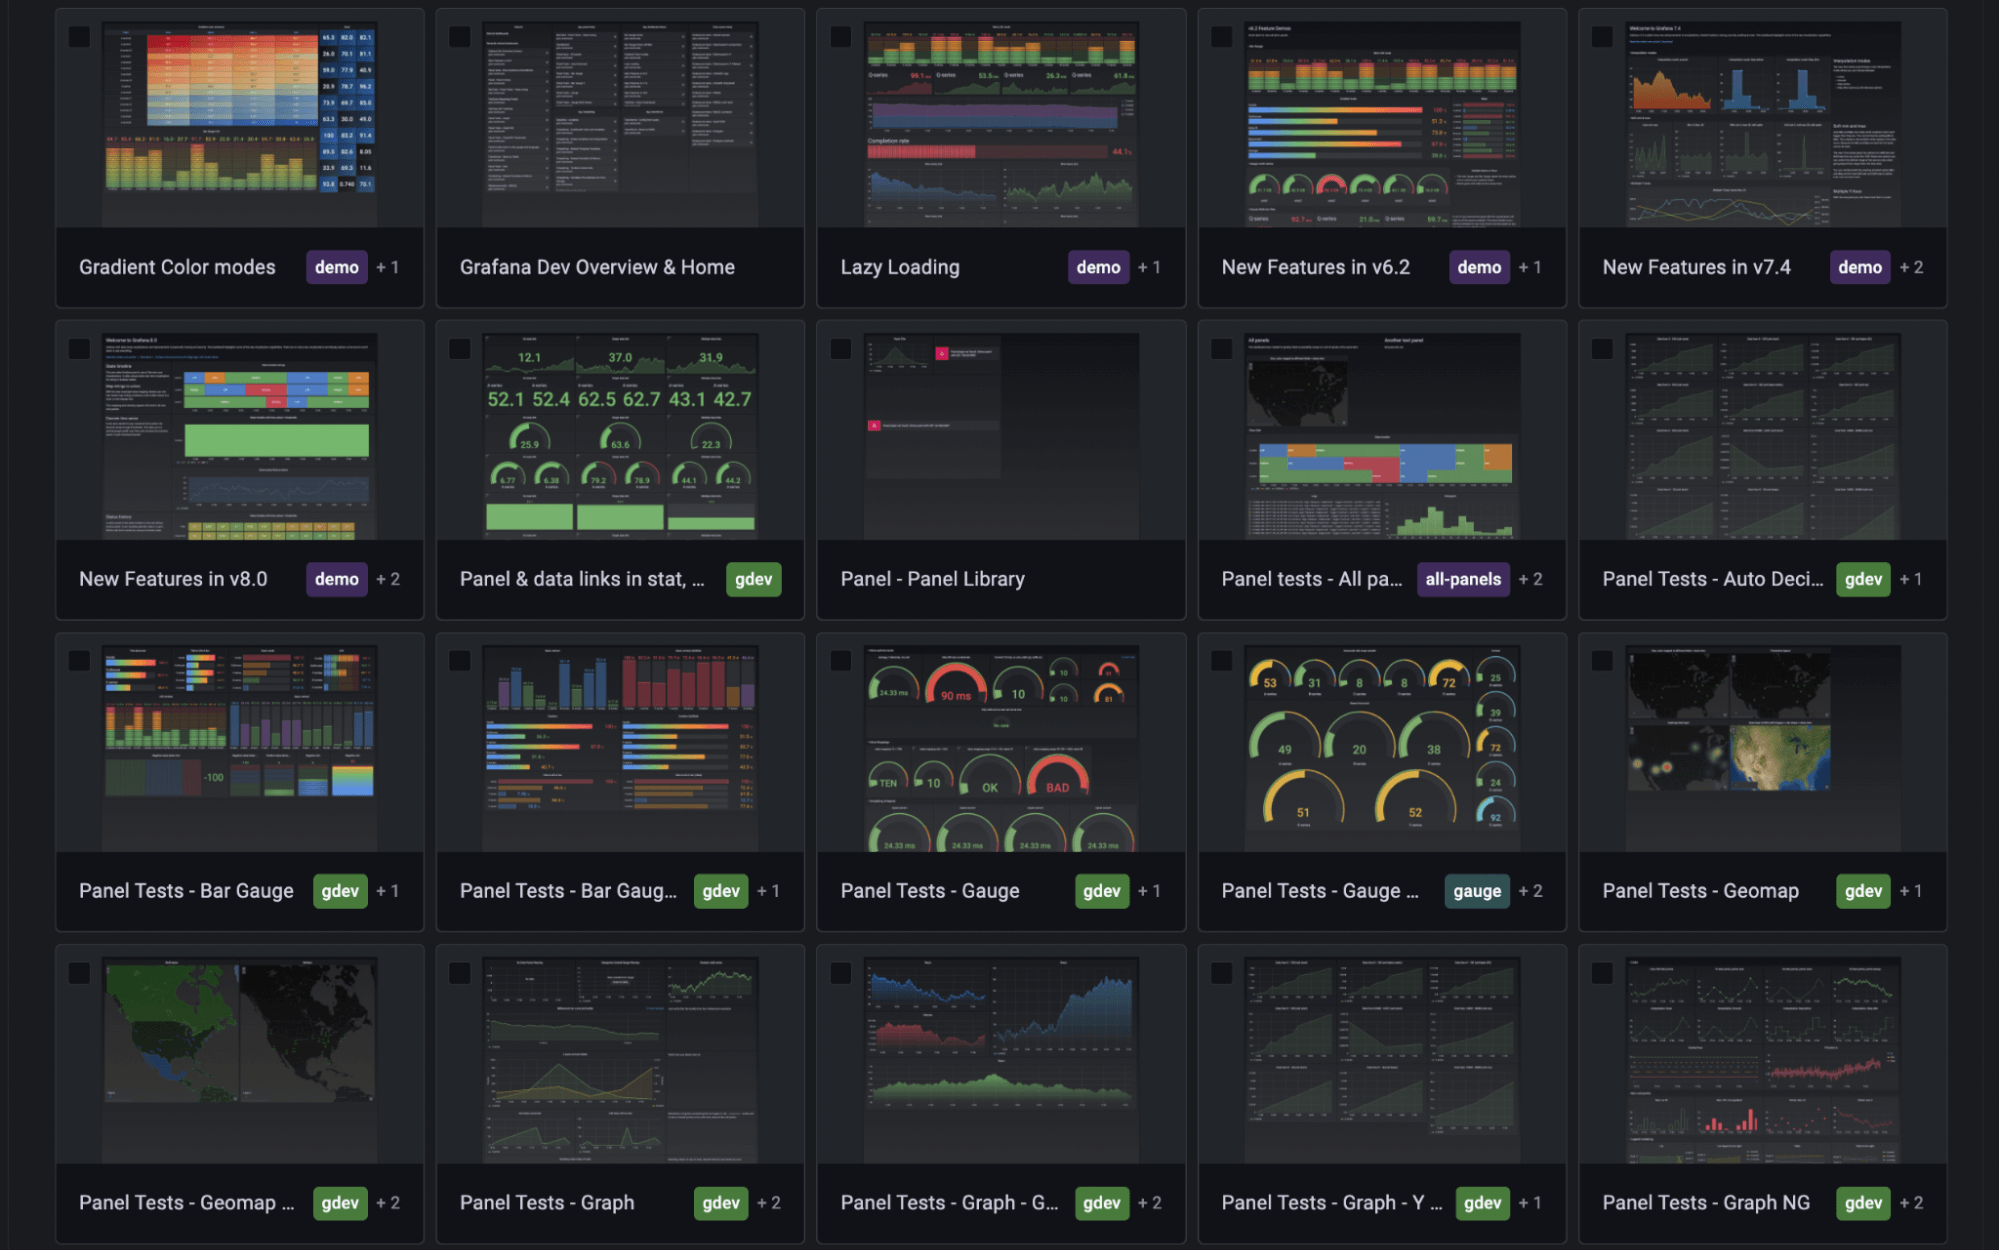
This beta feature provides a summary overview of all available dashboards and helps you quickly find the dashboard you need when the names aren’t enough. If you are interested in opting in to this feature, please read our documentation. You can also learn more about the dashboard preview project in our 2022 Hackathon roundup blog post.
New navigation
Expand the navigation bar for a better overview of Grafana’s features and your installed integrations. Grafana 9 will also introduce a way for you to star your dashboards and easily access them from the navigation menu. You can opt in to access the starred dashboards by switching on the savedItems feature toggle.
Grafana Alerting improvements
In v8.0, we introduced a new opt-in alerting experience that is consistent across our products (OSS, Cloud, and Enterprise) and brings together both Grafana panel alerts and Prometheus-style alerts. With Grafana 9.0, this is now the default, and with that change, we have made enhancements based on your feedback, including improving the UI and documentation.
To find out all the details about what’s new and improved with Grafana Alerting, read our blog post or watch the GrafanaCONline 2022 session “Alerting in Grafana 9: What’s new and improved” on demand
Reporting in Grafana Enterprise
Enterprise users now have improved reporting capabilities: You can add multiple dashboards to a single report to consolidate data spread across multiple dashboards and embed an image of a dashboard in a report for a quick glance on actionable insights.
Default envelope encryption
Grafana 9.0 now supports envelope encryption by default to encrypt secrets in the database.You no longer have to turn on envelope encryption explicitly in your Grafana configuration. Instead of relying on a single key to encrypt all the secrets within a database, envelope encryption offers additional security by depending on a set of keys that are further encrypted by another key. This makes it possible to rotate encryption keys quickly.
In Grafana Enterprise, you can also store your Key Encryption Key (KEK) in an external Key Management Service (KMS), such as AWS KMS or Azure Key Vault, for extra security.
Role-based access control is now generally available
Role-based access control (RBAC), previously known as fine-grained access control, is now extensively supported across Grafana features (dashboards, data sources, annotations, etc.) and is available by default for Grafana Enterprise and Grafana Cloud Advanced.
Get more information
Check out the Grafana 9.0 documentation and release notes for a complete list of new features, changes, and bug fixes.
Sign up for a June 28 live webinar to learn more about dashboarding and the Grafana 9 user interface.
Upgrade to Grafana 9.0
Download Grafana 9.0 today or try Grafana 9.0 on Grafana Cloud.
Refer to our Upgrading Grafana documentation for more information about upgrading your Grafana installation.
Thanks!
A big thanks to all the Grafana users who contributed by submitting PRs, bug reports, and feedback!

