
Unifying VM and microservice monitoring with Kubernetes, Prometheus, and Grafana
According to a 2020 CNCF survey, the use of containers in production has been rapidly increasing for the past several years.
Nutanix, a global leader in cloud software and a pioneer in hyperconverged infrastructure solutions, is part of that trend. During ObservabilityCON 2021, Rohith Subramanyam, a Nutanix software engineer, delivered a presentation about how the company’s service architecture has changed with the adoption of containers; the way its monitoring systems now combine the best features from Prometheus and Nutanix’s own legacy system; and how the company uses Grafana as its observability tool.

Container monitoring vs. traditional monitoring
Subramanyam explained that over the years, Nutanix’s service architecture has evolved from running in virtualized environments to container applications in microservices environments. To enable this, Nutanix built an internal product it calls the microservices platform (MSP). It involves the Kubernetes platform as well as some add-on functionalities (including logging, monitoring, and load balancing), which are leveraged by services running on them.
He then took time to point out that container monitoring has unique challenges compared to traditional monitoring and highlighted three main issues:
- Containers are ephemeral
- Containers share resources
- Insufficient tooling
The “best of both worlds” in alerting
To solve for some of those issues, the Nutanix team works with a custom alerting setup. They have adopted kube-prometheus, an open source project on Github, for its monitoring stack in the MSP. While that uses Alertmanager, the company’s traditional VM-based services use Prism Alerts, an in-house monitoring and alerting system on Nutanix’s management console, Prism.
Prism Alerts has all of the basic features of an alert management system as well as advanced features, such as clickable entities on alerts, grouping and filtering, and automated actions. It also provides a UI for customers to customize each alert policy based on their needs. Prometheus has a similar feature, he said, but it means dealing with yamls, so there’s no UI integration.
Instead of building a UI for Alertmanager, Nutanix’s goal was to integrate Prometheus with Prism and “combine the best of both worlds.” That means defining an alert with a simple PQL expression in a yaml, but still getting all of the advanced features that Prism provides.
To accomplish that, the company built a bridge using a system adapter they call alerts-broker.

The primary job of the alerts-broker is to transform all the alerts from Prometheus to Prism.
How do they do that? Nutanix provides all of the information about a Prometheus alert to Prism using annotations. Subramanyam shared this example of what that looks like:
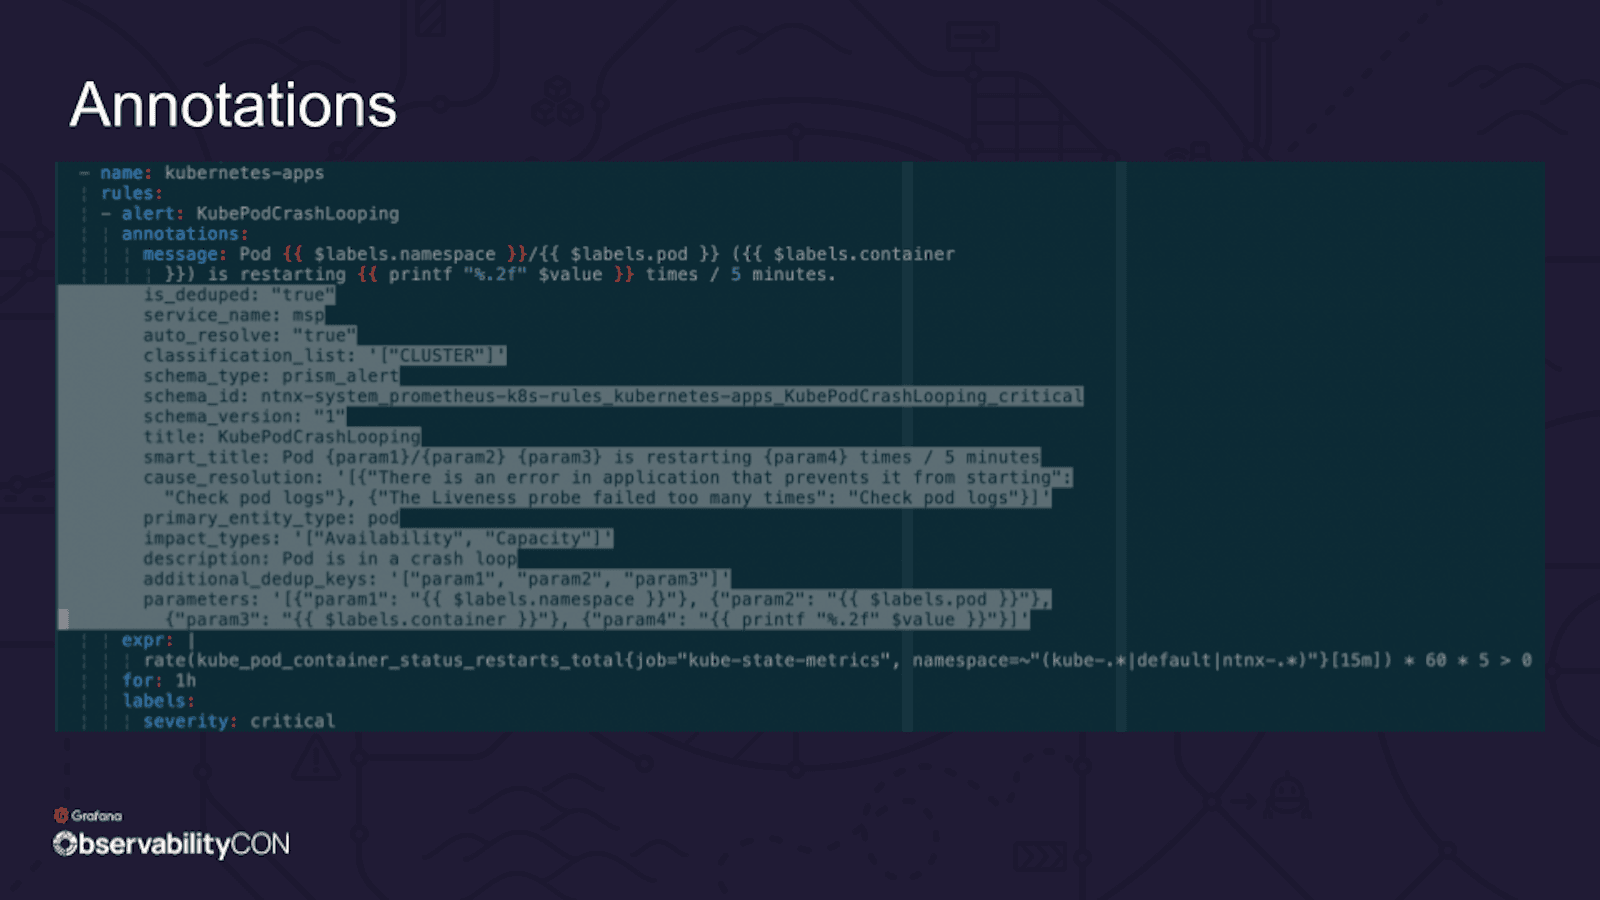
The highlighted annotations embedded within the Prometheus rule object enable the advanced features of a Prism alert. Subramanyam talked through how it works and noted that when an alert fires from Prometheus, it is seamlessly transformed and can be seen instantly on Prism.
Nutanix’s go-to Grafana dashboard
Nutanix relies on several Grafana dashboards for observability, but the pod resource dashboard is used the most. “Because Nutanix’s microservices platform actually uses a user VM as its node, it is essentially eating into our customer’s CPU and memory resources,” Subramanyam said. As a result, the dashboard is essential so the company can ensure its parts are neither over-consuming nor under-resourced (which could lead to stalling).
The pod resource dashboard is also a go-to every time Nutanix makes enhancements or adds new features in their components. “We come back and check how our parts are performing in terms of CPU and memory, and if the resource requests and limits have been rightly set,” he said. If not, they have the information to adjust them accordingly.
“Grafana,” Subramanyam concluded, “is something that we heavily depend on.”
To learn more about monitoring at Nutanix, check out the full ObservabilityCON session. All our sessions from ObservabilityCON 2021 are now available on demand.

