With Grafana and InfluxDB, CSS Electronics visualizes CAN IoT data to monitor vehicles and machinery
Martin Falch, co-owner and head of sales and marketing at CSS Electronics, is an expert on “CAN bus” data. Martin works closely with end users, typically OEM engineers, across diverse industries (automotive, heavy-duty, maritime, industrial). He is passionate about open source software and has been spearheading the integration of the CANedge with InfluxDB databases and Grafana telematics dashboards.
At CSS Electronics, we develop industrial-grade, simple-to-use CAN bus data loggers. In short, CAN bus is the protocol responsible for communicating message-based telemetry within practically all vehicles – heavy-duty vehicles, cars, mining trucks, and more. It is also used extensively in the monitoring of many types of machinery, ships, planes, drones, and robots.

End users typically include engineers at auto equipment manufacturers, who may need to monitor assets in the field in order to perform analyses, diagnose issues, or even perform predictive maintenance.
For many of these users, visualizing CAN data is important, and to support this, we decided to facilitate a plug-and-play integration between our hardware and Grafana.

Below, we’ll outline the key challenges we faced, how we solved them, the top benefits of our solution, and examples of practical use cases. To see more of our public Grafana dashboard playgrounds, check out our full intro article with links to our live demos or view our webinar.
Key challenges to solve in the integration

As part of our integration, we faced five key challenges:
1. Working with “raw” CAN bus data
Our CANedge data loggers record raw CAN bus data. This data consists of timestamped “CAN IDs” and “databytes.” In order for our users to make sense of the data, it needs to be “decoded” to human-readable form via suitable software/API tools and a database file (DBC) that contains information on how to interpret data from a specific application (e.g., a truck or car).
2. Storing binary log files
The CANedge records data in a standardized binary log file format called MF4. While this makes it easy to integrate with many popular CAN bus software tools, there are no plug-and-play tools for storing the data in databases.
3. Processing data from local disk or S3
Furthermore, our users may in some cases need to process data from their local disk (e.g., recorded from our CANedge1), while in other cases, they might need to process the data directly from their S3 server (e.g., when uploaded from our CANedge2). In both cases, the solution also needs to be easily automated.
4. Need for customization
Every user may have unique requirements for more “advanced” processing of their data, some of which cannot be done through database queries.
5. No central hosting
Finally, our business model is a bit special, as we do not host servers and we do not offer our solutions as a service. Rather, we enable our end users to set up everything themselves. This has a number of benefits for the users, such as cost and data control. However, for this to work, the solution needs to be very simple to set up.
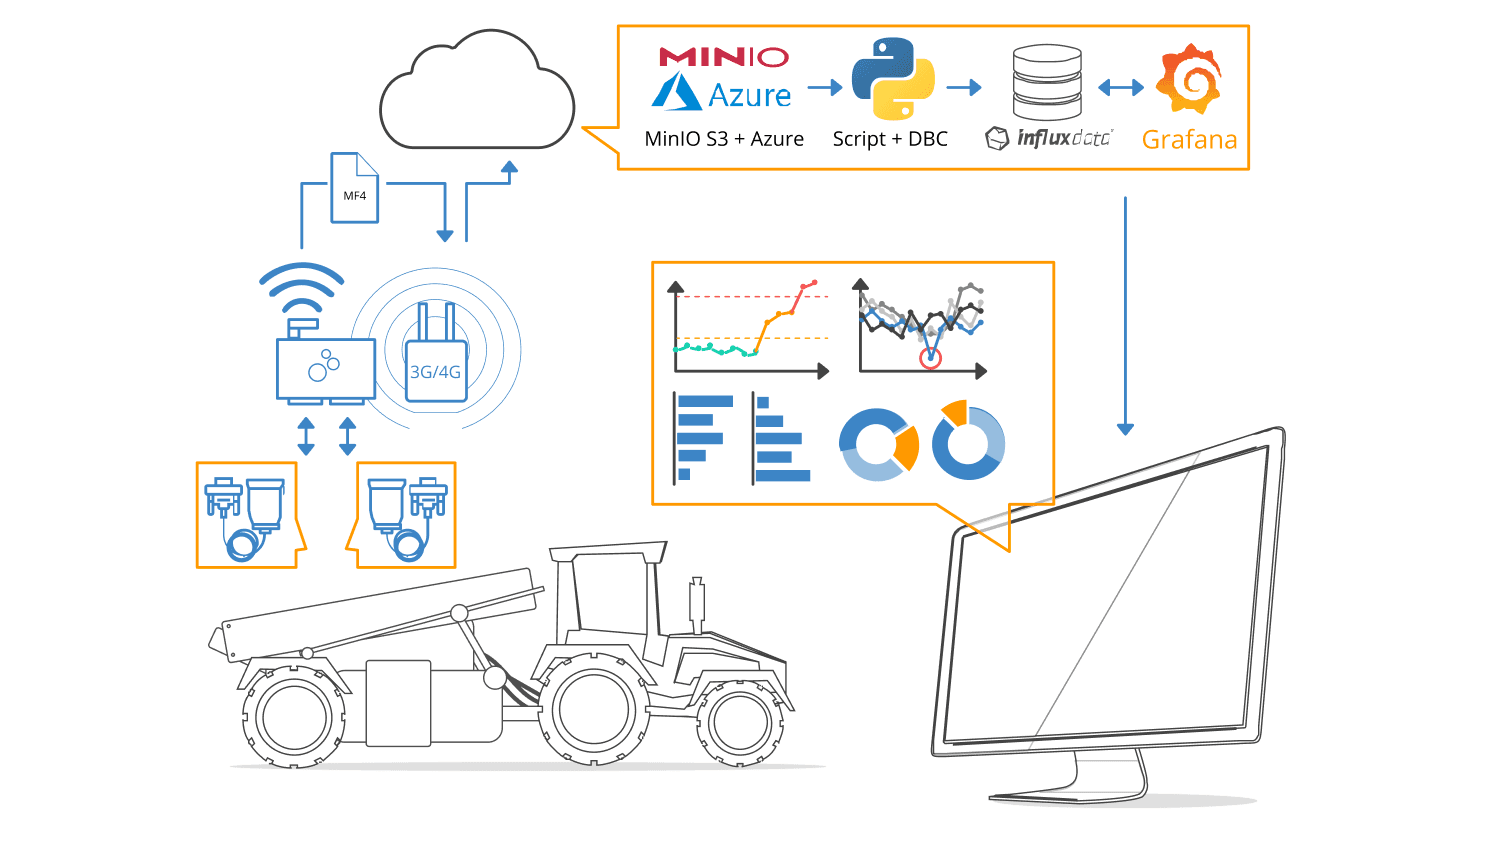
Our solution: Process data via Python and push it to InfluxDB

To solve these key challenges, we designed a simple plug-and-play dashboard integration script that utilizes our free Python API modules.
The first step in the script is to fetch the relevant log files. We achieve this through the use of fsspec and our API module canedge_browser. This lets us list log files from both local disk and S3 in an agnostic way based on a specified time period.
Using this list of log files, the script then loads each binary file into a pandas dataframe using our MF4 iterator module, mdf_iter.
This dataframe of raw CAN data is supplied to our can_decoder module along with the relevant DBC file, telling the module how to interpret the data. The output is a new dataframe with time series data such as speed, rpm, GPS positions, temperatures, etc.
Finally, the script pushes the decoded dataframe into the user’s own InfluxDB database via the InfluxDB Python API. Once the data has been pushed, it is ready for querying through Grafana.
While other databases can be used instead of InfluxDB, we found it to be a very good fit, specifically because – like Grafana Cloud – InfluxDB offers a free cloud starter that makes the initial setup very easy. InfluxDB also supports high frequency data, which can be relevant in, for example, CAN bus diagnostics.
Once the initial testing is done, the script integration can be easily automated via task scheduling or through AWS Lambda functions.
It is worth noting that there are many ways to set this up in practice. For example, some users may prefer to use cloud versions of InfluxDB, Grafana, or both. Others may decide to self-host everything on a local machine or an AWS EC2 virtual machine. Similarly, the Python script can be automated via a task scheduler or through trigger functions (such as AWS Lambda, Azure triggers, etc.).
What makes Grafana awesome for telematics dashboards?
In our opinion, Grafana + InfluxDB is a great solution for setting up telematics dashboards because:
- Grafana offers some of the most visually appealing custom dashboards available.
- Grafana’s entire solution can be set up in minutes without coding experience.
- Both Grafana and InfluxDB offer free cloud starters, reducing “time to awesome.”
- Both tools are open source, but also offer paid cloud alternatives for convenience.
- The Grafana frontend can be fully customized with no coding required.
- The 100+ Grafana plugins offer a lot of flexibility, such as geomap visualizations.
- Grafana variables enable frontend users to easily switch between devices.
- Native Grafana alerts enable users to set thresholds to be quickly informed of equipment issues.
Use cases from customers
Today, many of our users rely on Grafana as one of their core tools for working with their CAN bus data. Some of these are covered in our user case studies.
The international agriculture equipment manufacturer Kverneland uploads CAN data from a harvester via the CANedge2 and a 3G/4G router. Data is uploaded to their own Azure blob storage (using a MinIO S3 gateway). Through Azure trigger functions, the dashboard integration script is automated, thus facilitating the visualization of fresh data in Grafana. This enables various use cases, including remote debugging of equipment issues. “The CANedge2 gives us the opportunity to get an enormous amount of data directly from the field, without physically getting down there – thus saving us a lot of time/costs,” the Kverneland team wrote. “And with the automated script running on our Linux server we are able to visualize and analyze the data directly without any effort.”

Another example is HAVELSAN, a company offering end-to-end technology solutions within defense, simulation, IT, homeland security and cybersecurity. The team uses the CANedge2 to periodically upload data from an unmanned ground vehicle. The device auto-pushes data from the SD card to the team’s S3 server when it comes within the range of a specified WiFi router. The data is processed and pushed to InfluxDB for visualization in Grafana. When abnormal data patterns are observed, the team downloads relevant log files to perform in-depth analyses via other software tools.


Conclusion
Overall, our integration with Grafana and InfluxDB has proven to be a game-changer for many of our end users. Looking ahead, we see great opportunities for further integrating with various Grafana dashboard features such as the real-time streaming solutions introduced as part of Grafana Live in the 8.0 release, which will make equipment diagnostics, cloud metric storage, and fault-based log collection more robust and streamlined.