Open source load testing tool review: 2020

It has been almost three years since we published our first comparison and benchmark articles that have become very popular, and we thought an update seemed overdue as some tools have changed a lot in the past couple of years. For this update, we decided to put everything into one huge article — making it more of a guide for those trying to choose a tool.
First, a disclaimer: I, the author, have tried to be impartial, but given that I helped create one of the tools in the review (k6), I am bound to have some bias towards that tool. Feel free to read between the lines and be suspicious of any positive things I write about k6 ;)
About the review
The list of tools we look at hasn’t changed much. We have left out The Grinder from the review because, despite being a competent tool that we like, it doesn’t seem to be actively developed anymore, making it more troublesome to install (it requires old Java versions) and it also doesn’t seem to have many users out there. A colleague working with k6 suggested we’d add a tool built with Rust and thought Drill seemed a good choice, so we added that to the review. Here is the full list of tools tested, and what versions we have tested:
- ApacheBench 2.3
- Artillery 1.6.0
- Drill 0.5.0 (new)
- Gatling 3.3.1
- Hey 0.1.2
- JMeter 5.2.1
- k6 0.26.0
- Locust 0.13.5
- Siege 4.0.4
- Tsung 1.7.0
- Vegeta 12.7.0
- Wrk 4.1.0
So what did we test then?
Basically, this review centers around two things:
- Tool performance. How efficient is the tool at generating traffic and how accurate are its measurements?
- Developer UX. How easy and convenient is the tool to use, for a developer like myself?
Automating load tests is becoming more and more of a focus for developers who do load testing, and while there wasn’t time to properly integrate each tool into a CI test suite, we tried to figure out how well suited a tool is to automated testing by downloading, installing, and running each tool from the command line and via scripted execution.
The review contains both hard numbers for tool performance, but also a lot of very subjective opinions on various aspects, or behavior, of the tools.
All clear? Let’s do it! The rest of the article is written in first-person format to make it hopefully more engaging (or at least you’ll know who to blame when you disagree with something).
History and status
Tool overview
Here is a table with some basic information about the tools in the review.
| Tool | ApacheBench | Artillery | Drill | Gatling |
|---|---|---|---|---|
| Created by | Apache foundation | Shoreditch Ops LTD | Ferran Basora | Gatling Corp |
| License | Apache 2.0 | MPL2 | GPL3 | Apache 2.0 |
| Written in | C | NodeJS | Rust | Scala |
| Scriptable | No | Yes: JS | No | Yes: Scala |
| Multithreaded | No | No | Yes | Yes |
| Distributed load generation | No | No (Premium) | No | No (Premium) |
| Website | httpd.apache.org | artillery.io | github.com/fcsonline | gatling.io |
| Source code | Link | Link | Link | Link |
| Tool | Hey | JMeter | k6 | Locust |
|---|---|---|---|---|
| Created by | Jaana B Dogan | Apache foundation | Load Impact | Jonathan Heyman |
| License | Apache 2.0 | Apache 2.0 | AGPL3 | MIT |
| Written in | Go | Java | Go | Python |
| Scriptable | No | Limited (XML) | Yes: JS | Yes: Python |
| Multithreaded | Yes | Yes | Yes | No |
| Distributed load generation | No | Yes | No (Premium) | Yes |
| Website | github.com/rakyll | jmeter.apache.org | k6.io | locust.io |
| Source code | Link | Link | Link | Link |
| Tool | Siege | Tsung | Vegeta | Wrk |
|---|---|---|---|---|
| Created by | Jeff Fulmer | Nicolas Niclausse | Tomás Senart | Will Glozer |
| License | GPL3 | GPL2 | MIT | Apache 2.0 modified |
| Written in | C | Erlang | Go | C |
| Scriptable | No | Limited (XML) | No | Yes: Lua |
| Multithreaded | Yes | Yes | Yes | Yes |
| Distributed load generation | No | Yes | Limited | No |
| Website | joedog.org | erland-projects.org | tsenart@github | wg@github |
| Source code | Link | Link | Link | Link |
Development status
OK, so which tools are being actively developed today, early 2020?
I looked at the software repositories of the different tools and counted commits and releases since late 2017, when I did the last tool review. ApacheBench doesn’t have its own repo but is a part of Apache httpd so I skipped it here as ApacheBench is fairly dead, development-wise anyway.
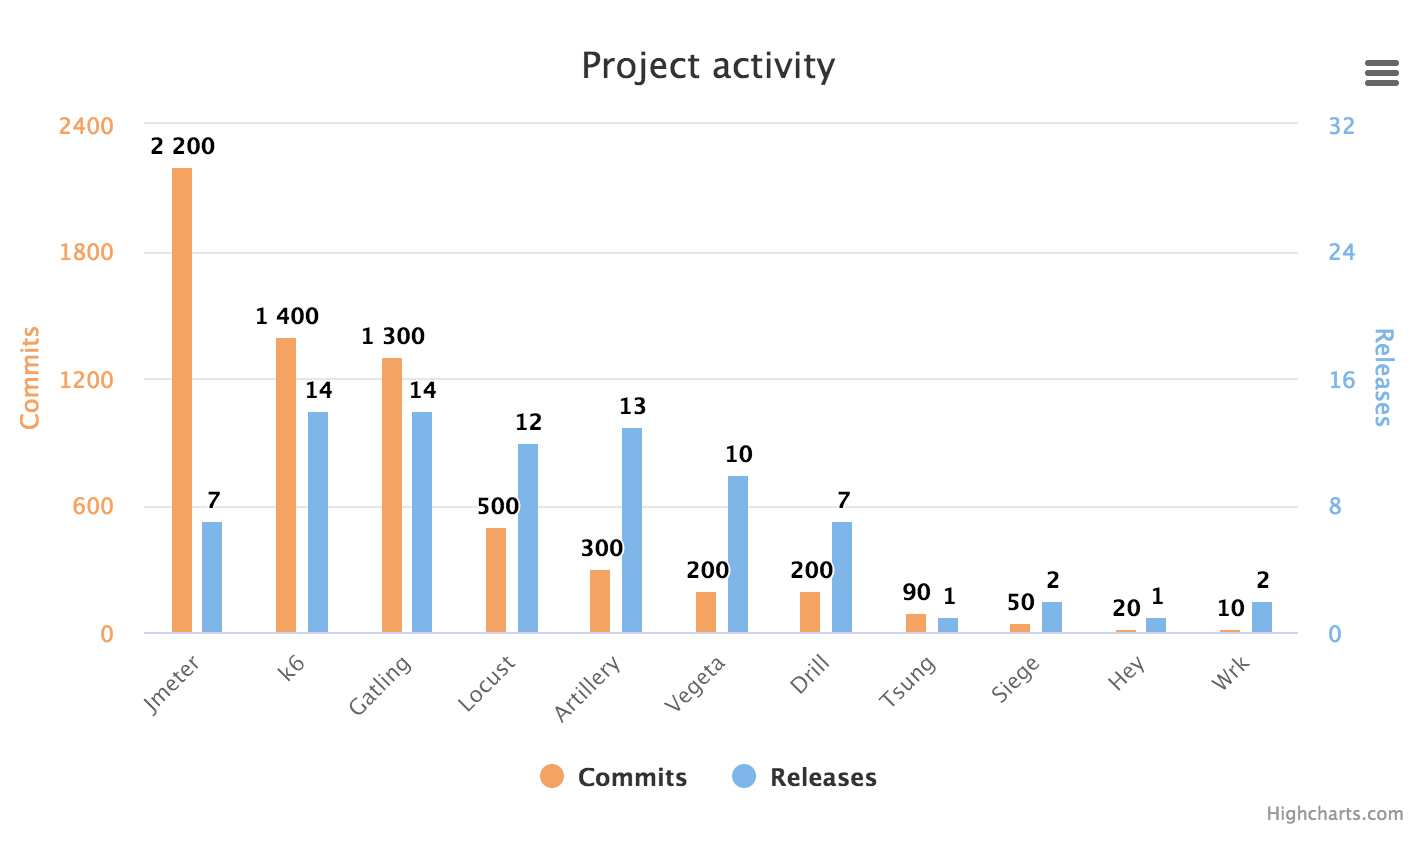
It’s positive to see that several of the projects seem to be moving fast! Could JMeter do with more frequent releases, perhaps? Locust seems to have picked up speed the past year, as it had only 100 commits and one release in 2018, but in 2019 it had 300 commits and 10 releases. And looking at the sheer number of commits, Gatling, JMeter and k6 seem to be moving very fast.
Looking at Artillery gives me the feeling that the open source version gets a lot less attention than the premium version. Reading the Artillery Pro Changelog (there seems to be no changelog for Artillery open source) it looks as if Artillery Pro has gotten a lot of new features the past two years, but when checking commit messages in the GitHub repo of the open source Artillery, I see what looks mostly like occasional bug fixes.
ApacheBench
This old-timer was created as part of the tool suite for the Apache httpd web server. It’s been around since the late 90s and was apparently an offshoot of a similar tool created by Zeus Technology, to test the Zeus web server (an old competitor to Apache’s and Microsoft’s web servers). Not much is happening with ApacheBench these days, development-wise, but due to it being available to all who install the tool suite for Apache httpd, it is very accessible and most likely used by many, many people to run quick-and-dirty performance tests against, for example, a newly installed HTTP server. It might also be used in quite a few automated test suites.
Artillery
Shoreditch Ops LTD in London created Artillery. These guys are a bit anonymous, but I seem to remember them being some kind of startup that pivoted into load testing either before or after Artillery became popular out there. Of course, I also remember other things that never happened, so who knows. Anyway, the project seems to have started sometime 2015 and was named Minigun before it got its current name.
Artillery is a written in JavaScript, and using NodeJS as its engine.
Drill
Drill is the very newest newcomer of the bunch. It appeared in 2018 and is the only tool written in Rust. Apparently, the author — Ferran Basora — wrote it as a side project in order to learn Rust.
Gatling
Gatling was first released in 2012 by a bunch of former consultants in Paris, France, who wanted to build a load testing tool that was better for test automation. In 2015, Gatling Corp. was founded and the next year the premium SaaS product Gatling Frontline was released. On their website they say they have seen over 3 million downloads to date — I’m assuming this is downloads of the OSS version.
Gatling is written in Scala, which is a bit weird of course, but it seems to work quite well anyway.
Hey
Hey used to be named Boom, after a Python load testing tool of that name, but the author apparently got tired of the confusion that caused, so she changed it. The new name keeps making me think “horse food” when I hear it, so I’m still confused, but the tool is quite OK. It’s written in the fantastic Go language, and it’s fairly close to ApacheBench in terms of functionality. The author stated that one aim when she wrote the tool was to replace ApacheBench.
JMeter
This is the old giant of the bunch. It also comes from the Apache Software Foundation, and it’s a big, old Java app that has a ton of functionality; plus, it is still being actively developed. The last two years it has seen more commits to its codebase than any other tool in the review. I suspect that JMeter is slowly losing market share to newer tools, like Gatling. But given how long it’s been around and how much momentum it still has, it’s a sure bet that it’ll be here a long time yet. There are so many integrations, add-ons, and whole SaaS services built on top of it (like BlazeMeter). Plus, people have spent so much time learning how to use it that it will be going strong for many more years.
k6
A super-awesome tool! Uh, well, like I wrote earlier, I am somewhat biased here. But objective facts are these: k6 was released in 2017, so it’s quite new. It is written in Go, and a fun thing I just realized is that we then have a tie between Go and C — three tools in the review are written in C, and three in Go. My two favorite languages — is it coincidence or a pattern?!
k6 was originally built, and is maintained by Load Impact — a SaaS load testing service. Load Impact has several people working full time on k6 and that, together with community contributions, means development is very active. Less known is why this tool is called k6, but I’m happy to leak that information here: After a lengthy internal name battle that ended in a standoff, we had a seven-letter name starting with “k” that most people hated, so we shortened it to “k6” and that seemed to resolve the issue. You gotta love first-world problems!
Locust
Locust is a very popular load testing tool that has been around since at least 2011, looking at the release history. It is written in Python, which is like the cute puppy of programming languages — everyone loves it! This love has made Python huge, and Locust has also become very popular as there aren’t really any other competent load testing tools that are Python-based. (And Locust is scriptable in Python too!)
Locust was created by a bunch of Swedes who needed the tool themselves. It is still maintained by the main author, Jonathan Heyman, but now has many external contributors also. Unlike Artillery, Gatling, and k6, there is no commercial business steering the development of Locust. It is (as far as I know) a true community effort. Development of Locust has been alternating between very active and not-so-active. I’m guessing it depends on Jonathan’s level of engagement mainly. After a lull in 2018, the project has seen quite a few commits and releases the past 18 months or so.
Siege
Siege has also been around quite a while — since the early 2000s. I’m not sure how much it is used, but it is referenced in many places online. It was written by Jeff Fulmer and is still maintained by him. Development is ongoing, but a long time can pass between new releases.
Tsung
Our only Erlang contender! Tsung was written by Nicolas Niclausse and is based on an older tool called IDX-Tsunami. It is also old (i.e., from the early 2000s) and like Siege, it’s still developed but in a snail-like manner.
Vegeta
Vegeta is apparently some kind of Manga superhero, or something. Damn it, now people will understand how old I am. Really, though, aren’t all these aggressive-sounding names and word choices used for load testing software pretty silly? Like, you do vegeta attack ... to start a load test. And don’t get me started on Artillery, Siege, Gatling, and the rest. Are we trying to impress an audience of five-year olds? Locust is at least a little better, though the “hatching” and “swarming” it keeps doing is pretty cheesy.
See? Now I went off on a tangent here. Mental slap! OK, back again. Vegeta seems to have been around since 2014, it’s also written in Go and seems very popular (almost 14k stars on GitHub! The very popular Locust, for reference, has about 12k stars). The author of Vegeta is Tomás Senart and development seems quite active.
Wrk
Wrk is written in C, by Will Glozer. It’s been around since 2012 so it isn’t exactly new, but I have been using it as kind of a performance reference point because it is ridiculously fast and efficient and seems like a very solid piece of software in general. It actually has over 23k stars on GitHub, so it probably has a user base that is quite large even though it is less accessible than many other tools. (You’ll need to compile it). Unfortunately, Wrk isn’t so actively developed. New releases are rare.
I think someone should design a logotype for Wrk. It deserves one.
Usability review
I’m a developer, and I generally dislike point-and-click applications. I want to use the command line. I also like to automate things through scripting. I’m impatient and want to get things done. I’m kind of old, which in my case means I’m often a bit distrustful of new tech and prefer battle-proven stuff. You’re probably different, so try to figure out what you can accept that I can’t, and vice versa. Then you might get something out of reading my thoughts on the tools.
What I’ve done is to run all the tools manually, on the command line, and interpreted results either printed to stdout, or saved to a file. I have then created shell scripts to automatically extract and collate results.
Working with the tools has given me some insight into each one and what its strengths and weaknesses are, for my particular use case. I imagine that the things I’m looking for are similar to what you’re looking for when setting up automated load tests, but I might not consider all aspects, as I haven’t truly integrated each tool into some CI test suite; just a disclaimer.
Also, note that the performance of the tools has colored the usability review. If I feel that it’s hard for me to generate the traffic I want to generate, or that I can’t trust measurements from the tool, then the usability review will reflect that. If you want details on performance you’ll have to scroll down to the performance benchmarks, however.
RPS
You will see the term RPS used liberally throughout this blog article. That acronym stands for “requests per second,” which is a measurement of how much traffic a load testing tool is generating.
VU
This is another term used quite a lot. It is a (load) testing acronym that is short for “virtual user.” A virtual user is a simulated human/browser. In a load test, a VU usually means a concurrent execution thread/context that sends out HTTP requests independently, allowing you to simulate many simultaneous users in a load test.
Scriptable tools vs. non-scriptable ones
I’ve decided to make a top list of my favorites both for tools that support scripting, and for those that don’t. The reason for this is that whether you need scripting or not depends a lot on your use case, and there are a couple of very good tools that do not support scripting that deserve to be mentioned here.
What’s the difference between a scriptable and a non-scriptable tool?
A scriptable tool supports a real scripting language that you use to write your test cases in, e.g., Python, JavaScript, Scala, or Lua. That means you get maximum flexibility and power when designing your tests. You can use advanced logic to determine what happens in your test; you can pull in libraries for extra functionality; you can often split your code into multiple files. It is, really, the “developer way” of doing things.
Non-scriptable tools, on the other hand, are often simpler to get started with as they don’t require you to learn any specific scripting API. They often also tend to consume fewer resources than the scriptable tools, as they don’t have to have a scripting language runtime and execution contexts for script threads. So they are (generally) faster and consume less memory. The negative side is they’re more limited in what they can do.
OK, let’s get into the subjective tool review!
The top non-scriptable tools
Here are my favorite non-scriptable tools, in alphabetical order.
Hey
Hey is a simple tool, written in Go, with good performance and the most common features you’ll need to run simple static URL tests. It lacks any kind of scripting but can be a good alternative to tools like ApacheBench or Wrk, for simple load tests. Hey supports HTTP/2, which neither Wrk nor ApacheBench does. And while I didn’t think HTTP/2 support was a big deal in 2017, today we see that HTTP/2 penetration is a lot higher than back then, so I’d say it’s more of an advantage for Hey today.
Another potential reason to use Hey instead of ApacheBench is that Hey is multi-threaded while ApacheBench isn’t. ApacheBench is very fast, so often you will not need more than one CPU core to generate enough traffic. But if you do, then you’ll be happier using Hey as its load generation capacity will scale pretty much linearly with the number of CPU cores on your machine.
Hey has rate limiting, which can be used to run fixed-rate tests.
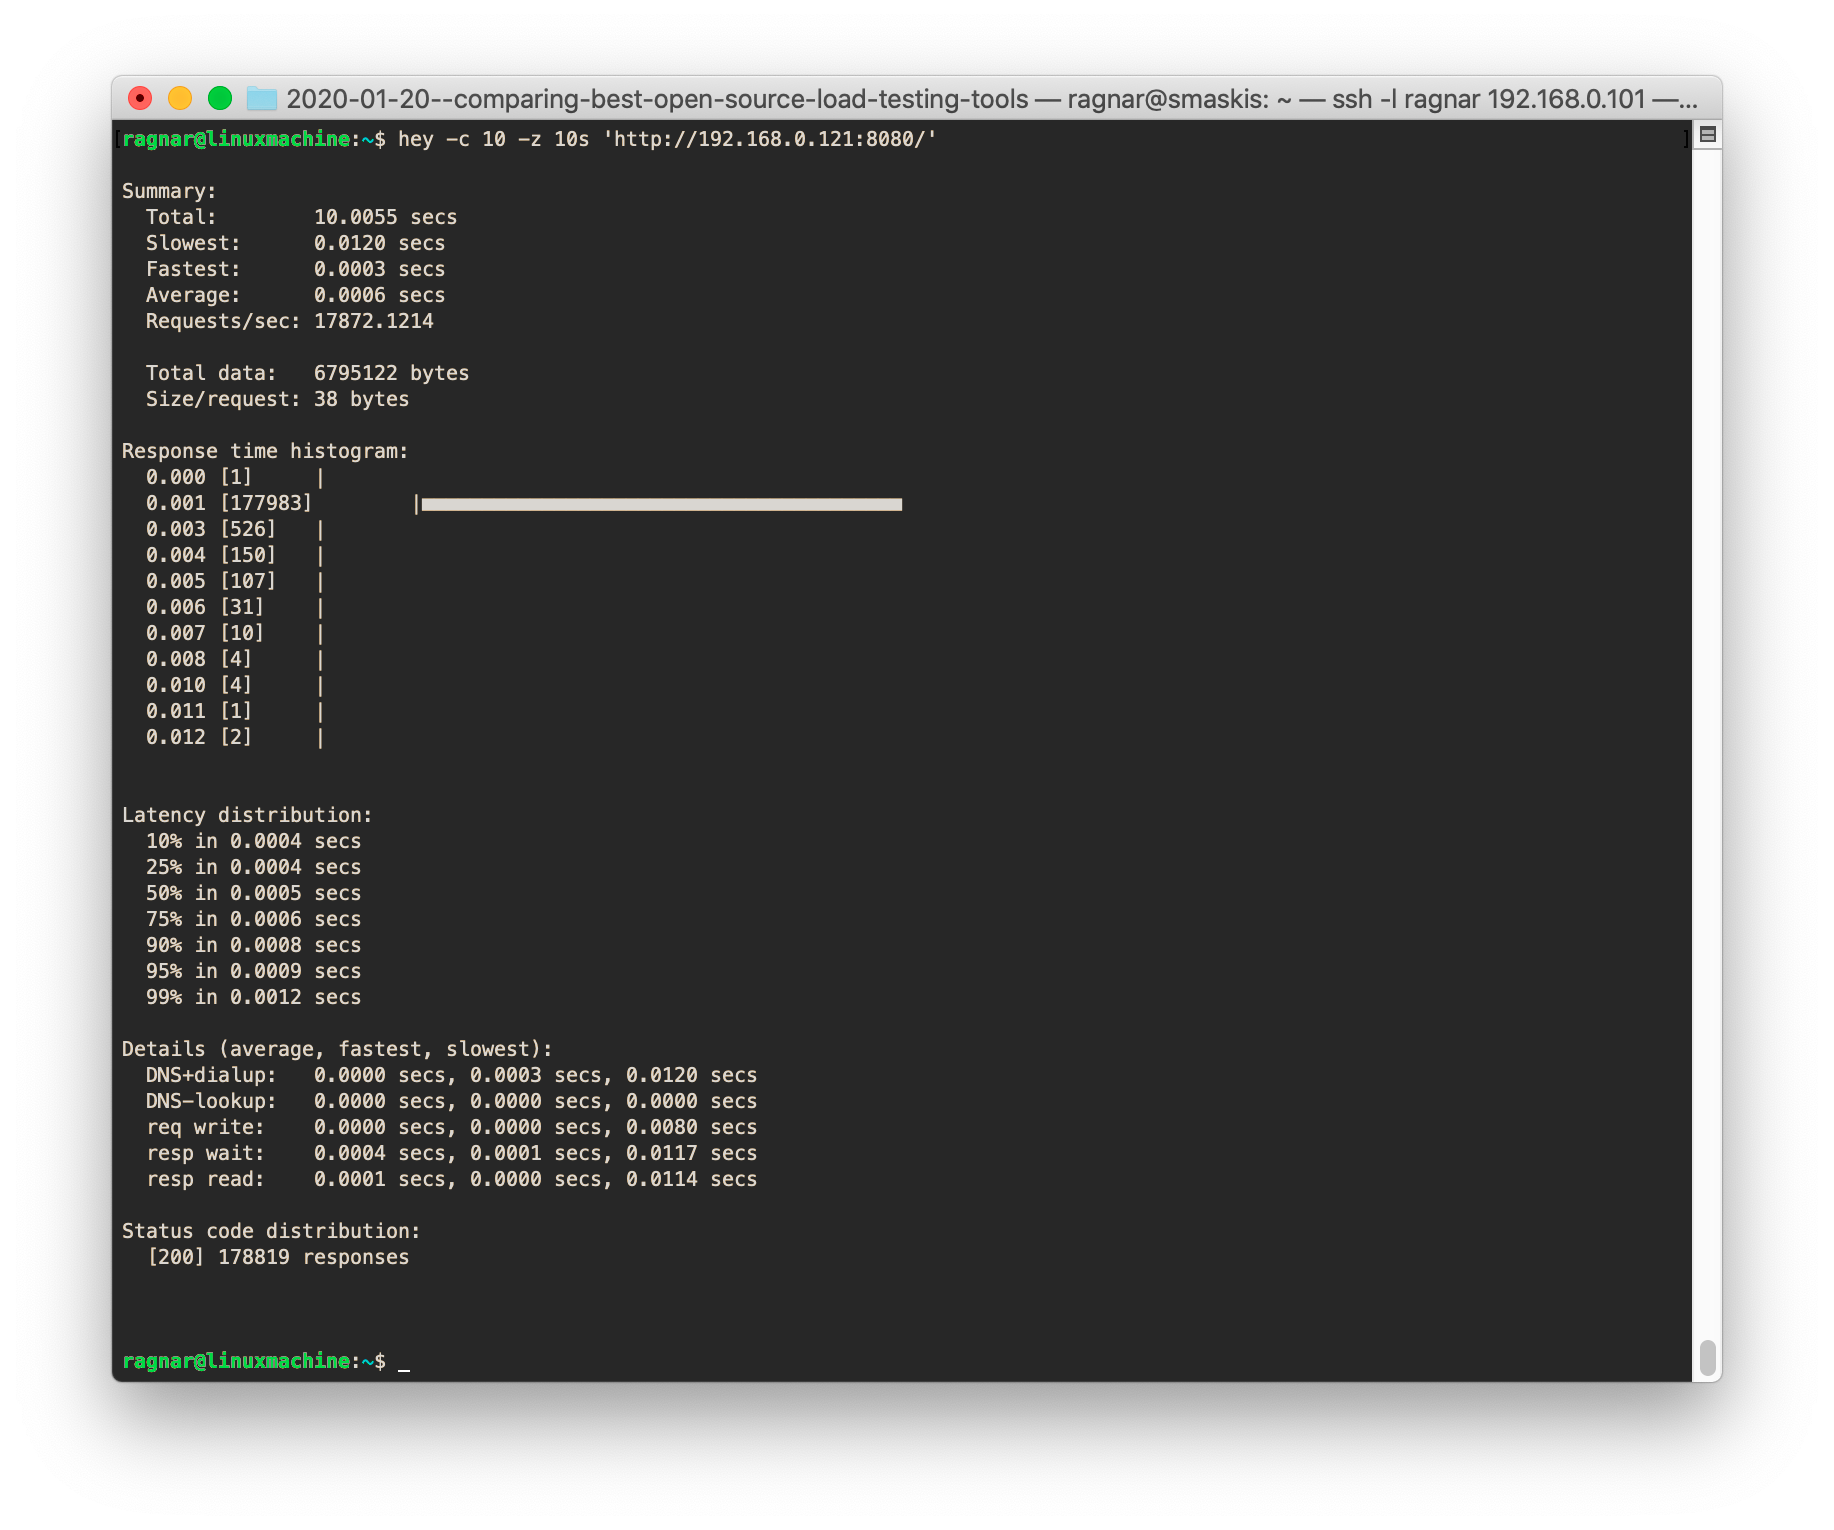
Hey help output
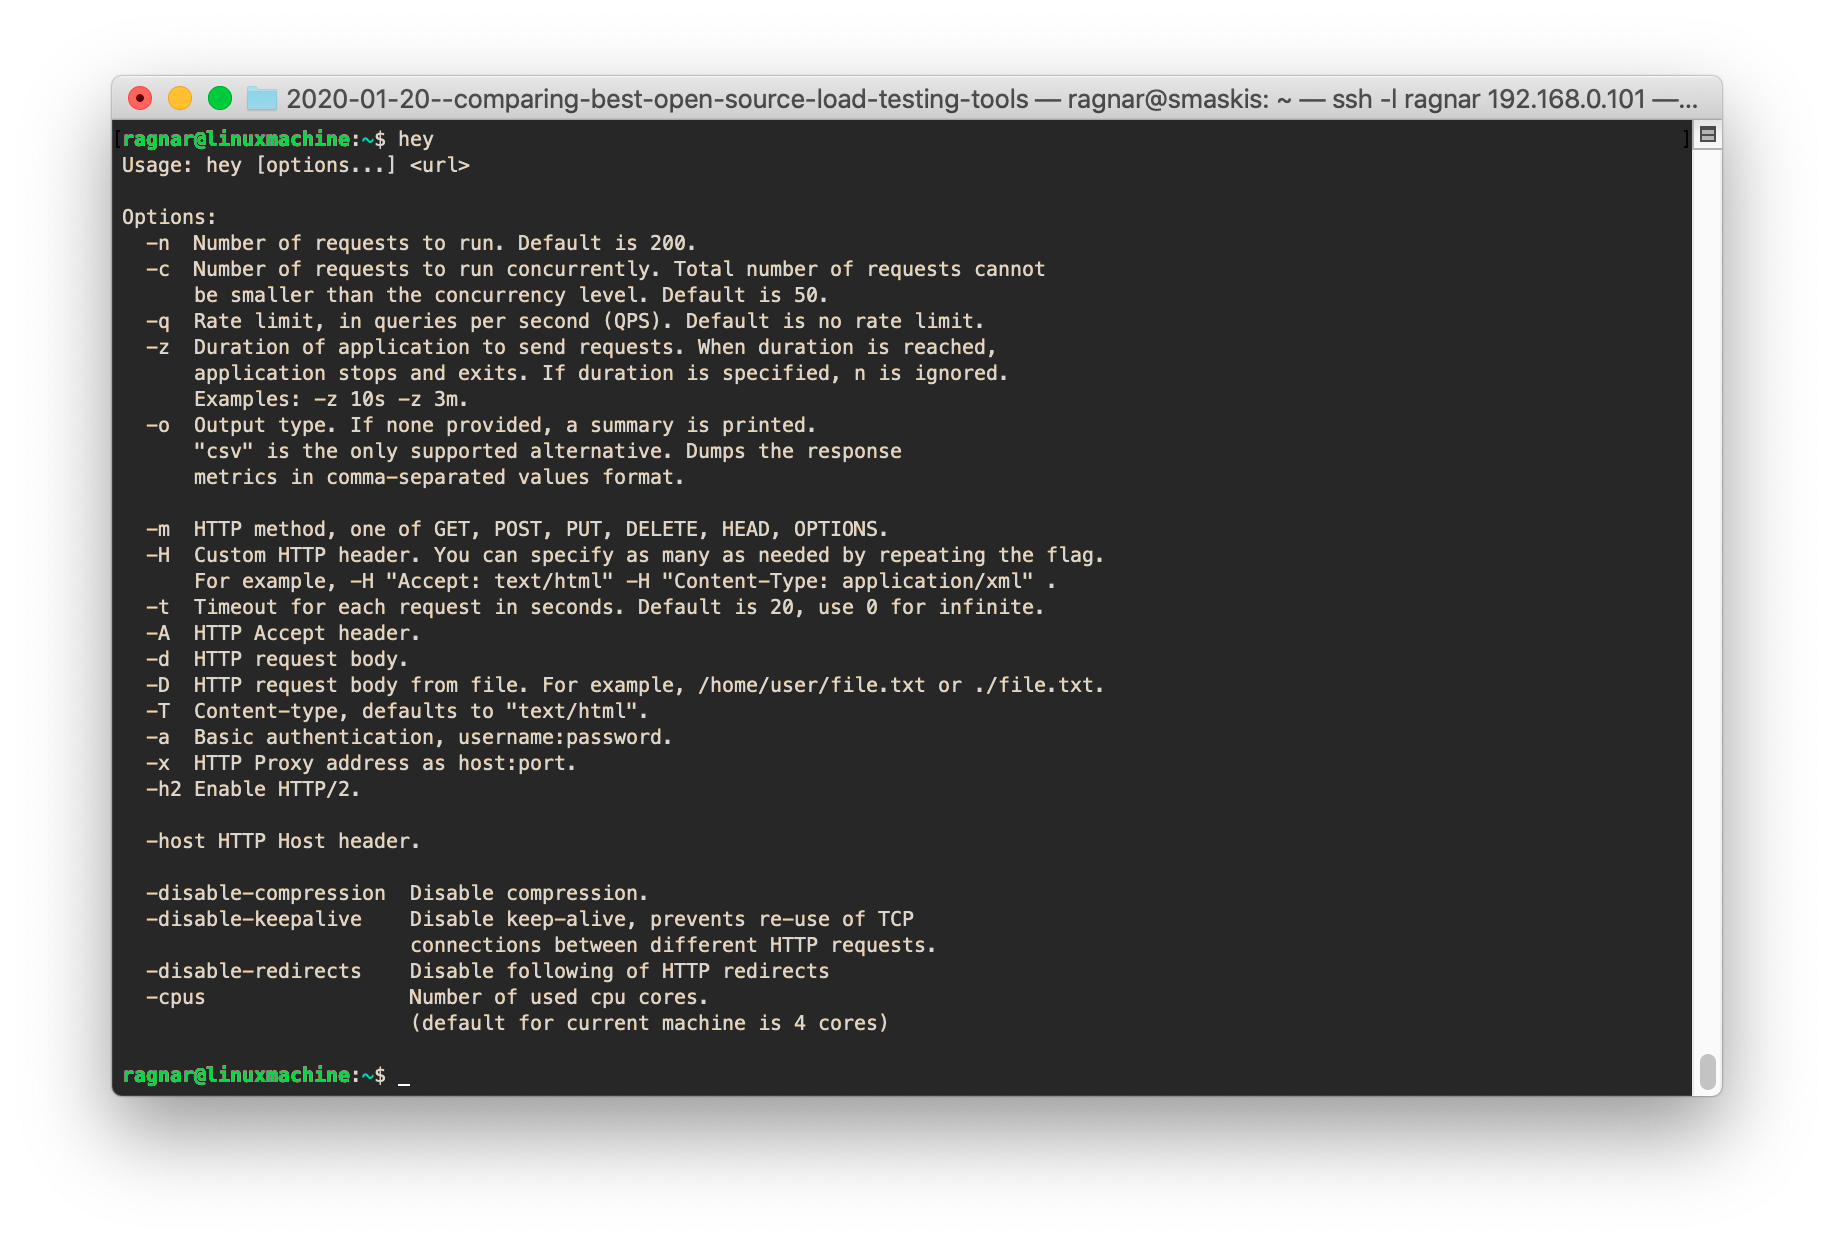
Hey summary
Hey is simple, but it does what it does very well. It’s stable, among the more performant tools in the review, and it has very nice output with response time histograms, percentiles, and stuff. It also has rate limiting, which is something many tools lack.
Vegeta

Vegeta has a lot of cool features, like the fact that its default mode is to send requests at a constant rate and it adapts concurrency to try and achieve this rate. This is very useful for regression/automated testing, where you often want to run tests that are as identical to each other as possible, as that will make it more likely that any deviating results are the result of a regression in newly committed code.
Vegeta is written in Go (yay!), performs very well, supports HTTP/2, has several output formats, flexible reporting, and can generate graphical response time plots.
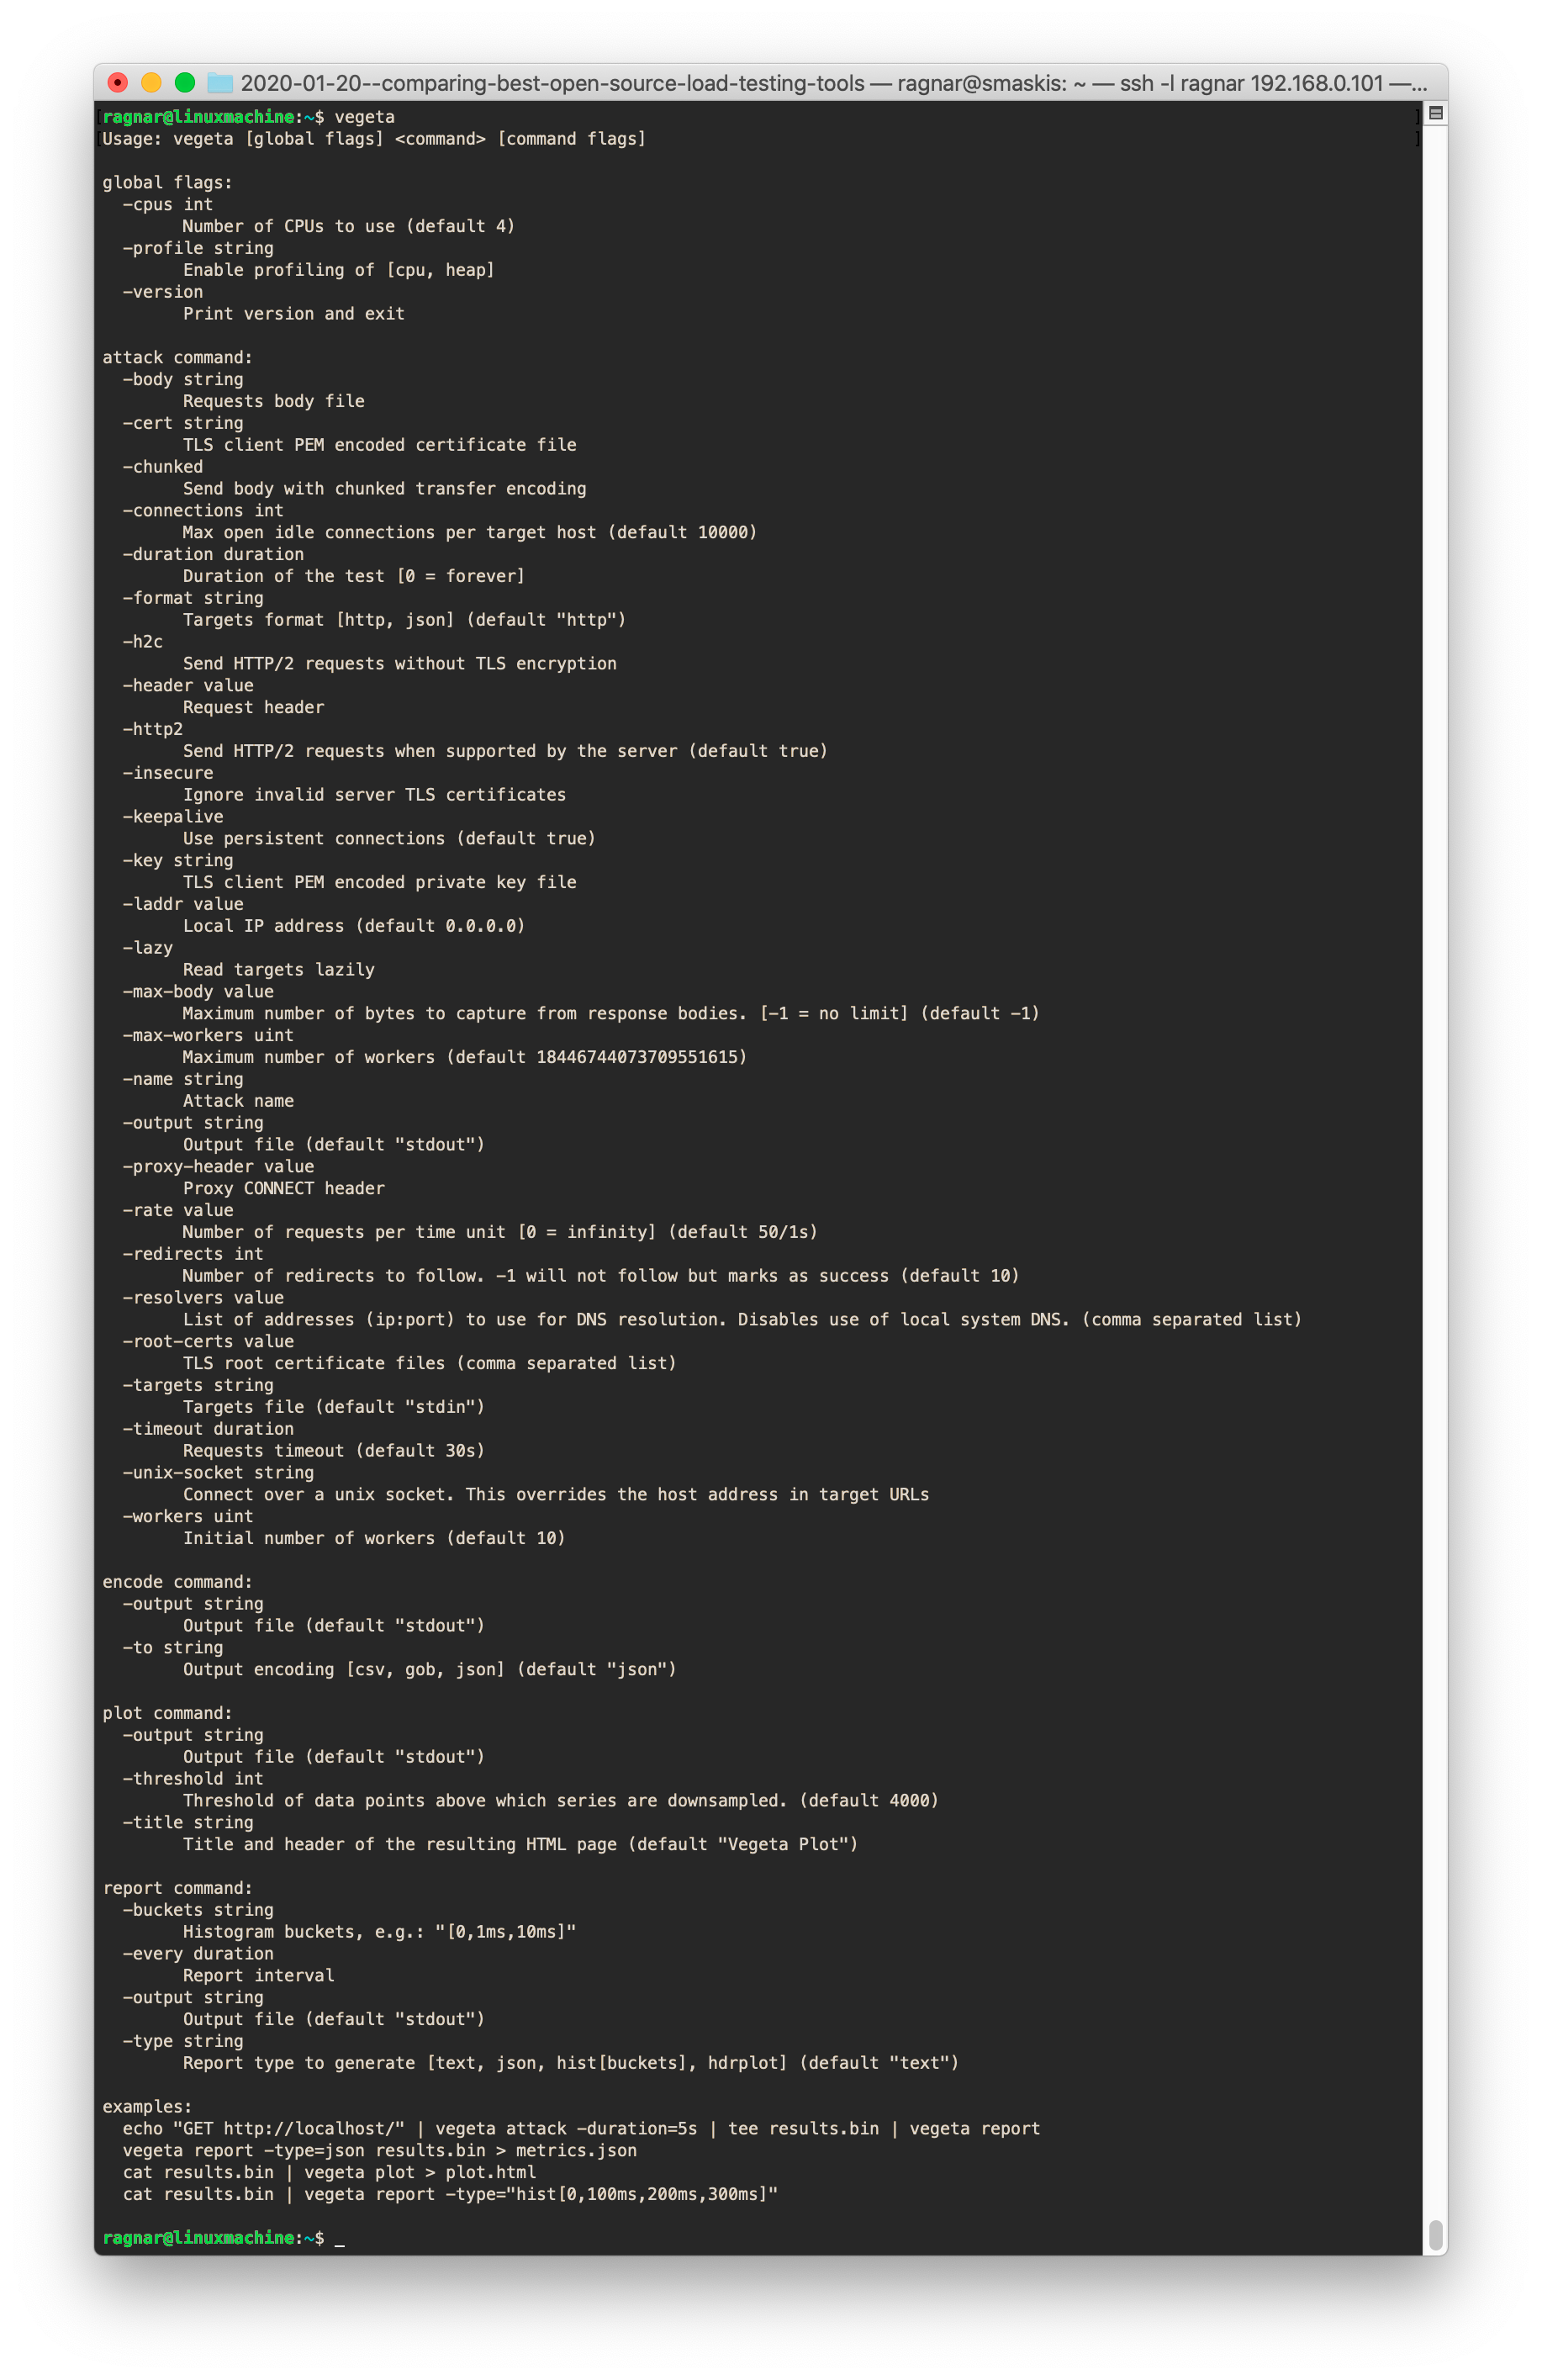
If you look at the runtime screenshot above, you’ll see that it is quite obvious that Vegeta was designed to be run on the command line; it reads from stdin a list of HTTP transactions to generate, and sends results in binary format to stdout, where you’re supposed to redirect to a file or pipe them directly to another Vegeta process that then generates a report from the data.
This design provides a lot of flexibility and supports new use cases, like basic load distribution through remote shell-execution of Vegeta on different hosts and then copying the binary output from each Vegeta “slave” and piping it all into one Vegeta process that generates a report. You also “feed” (over stdin) Vegeta its list of URLs to hit, which means you could have a piece of software executing complex logic that generates this list of URLs (though that program would not have access to the results of transactions, so it is doubtful how useful such a setup would be I guess).
The slightly negative side is that the command line UX is not what you might be used to, if you’ve used other load testing tools. Also, it’s not the simplest if you just want to run a quick command-line test hitting a single URL with some traffic.
Vegeta help output
Vegeta summary
Overall, Vegeta is a really strong tool that caters to people who want a tool to test simple, static URLs (perhaps API endpoints) but also want a bit more functionality. It’s also helpful for people who want to assemble their own load testing solution and need a flexible load generator component that they can use in different ways. Vegeta can even be used as a Golang library/package if you want to create your own load testing tool.
The biggest flaw (when I’m the user) is the lack of programmability/scripting, which makes it a little less developer-centric.
I would definitely use Vegeta for simple, automated testing.
Wrk
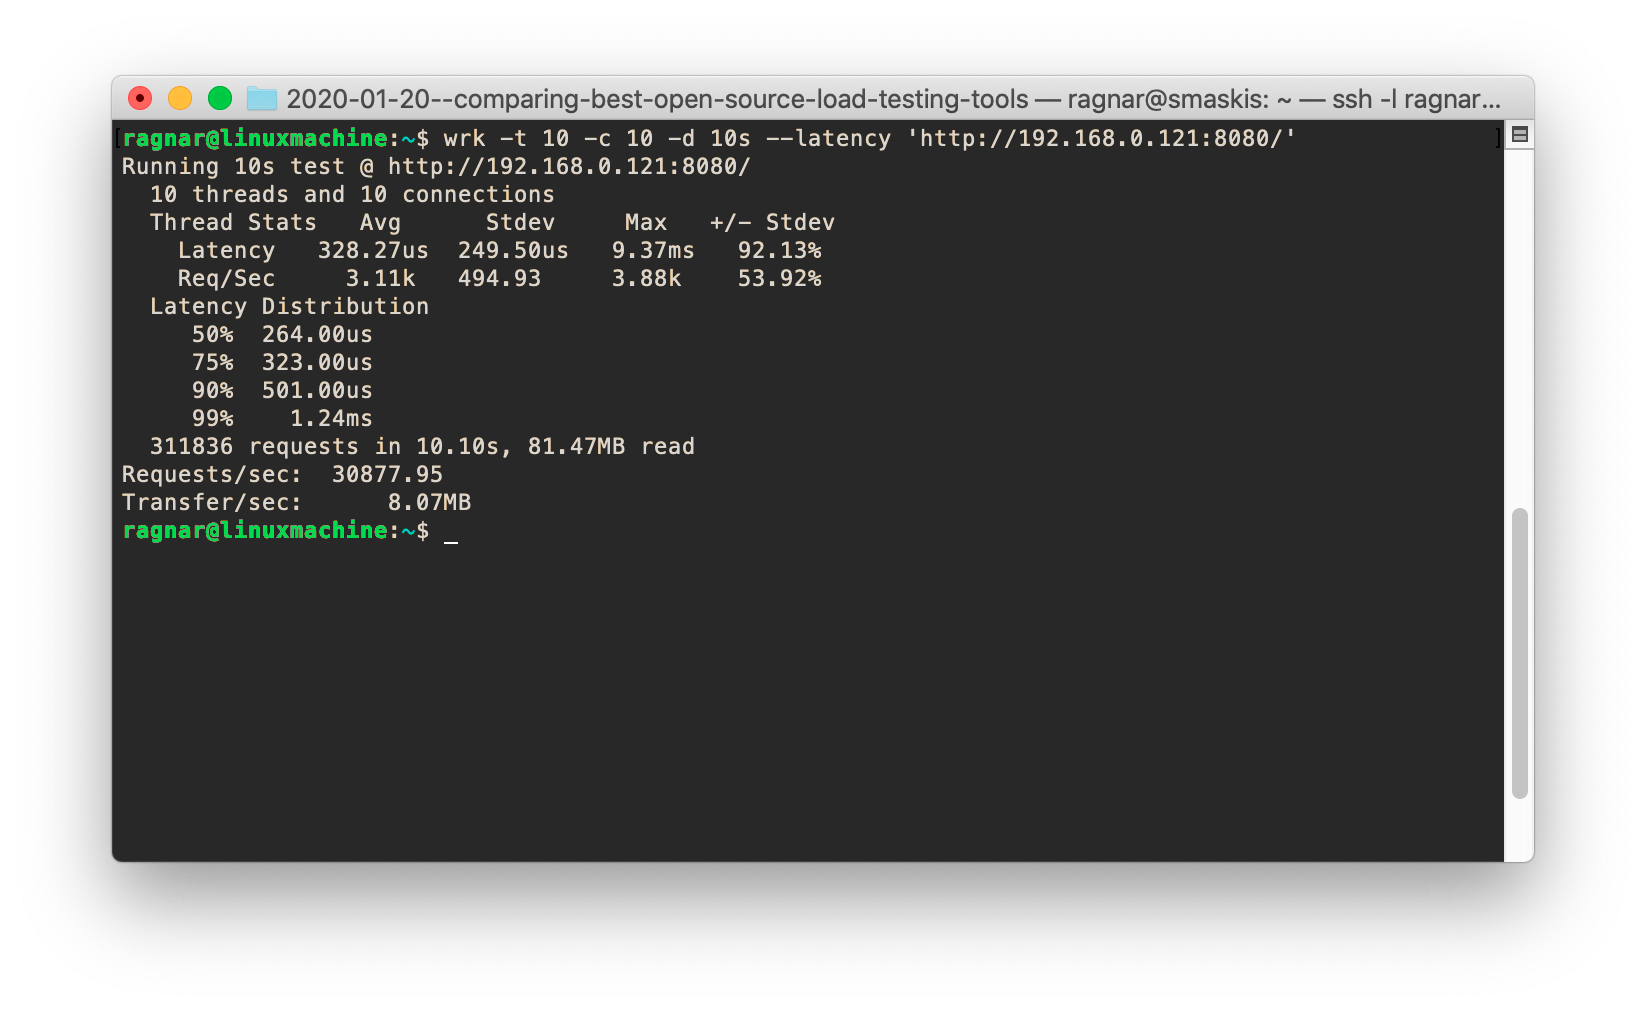
Wrk may be a bit dated, and doesn’t get a lot of new features these days, but it is such a !#&%€ solid piece of code. It always behaves like you expect it to, and it is running circles around all other tools in terms of speed/efficiency. If you use Wrk you will be able to generate five times as much traffic as you will with k6, on the same hardware. If you think that makes k6 sound bad, think again. It’s not that k6 is slow, it’s just that Wrk is so damn fast. Comparing it to other tools, Wrk is 10 times faster than Gatling, 15 to 20 times faster than Locust, and over 100 times faster than Artillery.
The comparison is a bit unfair as several of the tools let their VU threads run much more sophisticated script code than what Wrk allows, but still. You’d think Wrk offered no scripting at all, but it actually allows you to execute Lua code in the VU threads and, theoretically, you can create test code that’s quite complex. In practice, however, the Wrk scripting API is callback-based and not very suitable at all for writing complicated test logic. But it is also very fast. I did not execute Lua code when testing Wrk this time; I used the single-URL test mode instead, but previous tests have shown Wrk performance to be only minimally impacted when executing Lua code.
However, being fast and measuring correctly is about all that Wrk does. It has no HTTP/2 support, no fixed request rate mode, no output options, no simple way to generate pass/fail results in a CI setting, etc. In short, it is quite feature-sparse.
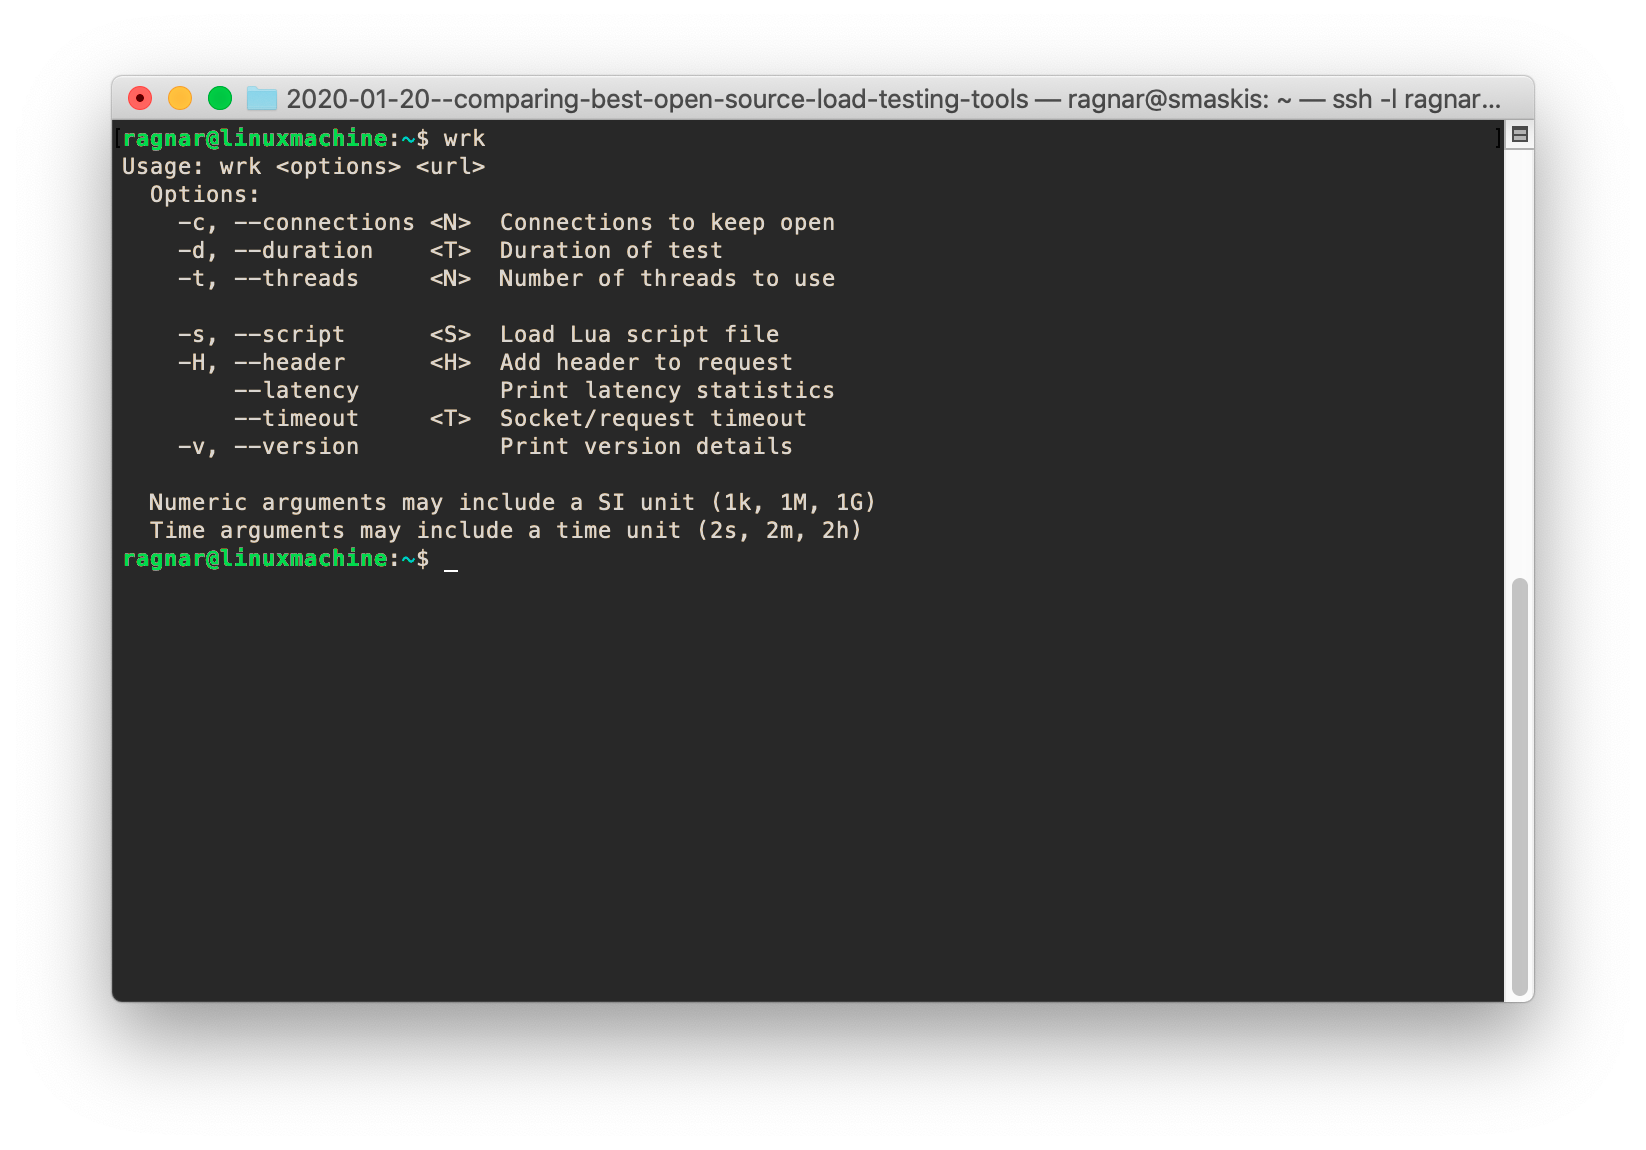
Wrk help output
Wrk summary
Wrk is included among the top non-scriptable tools because if your only goal is to generate a truckload of simple traffic against a site, there is no tool that does it more efficiently. It will also give you accurate measurements of transaction response times, which is something many other tools fail at when they’re being forced to generate a lot of traffic.
The top scriptable tools
To me, this is the most interesting category because here you’ll find the tools that can be programmed to behave in whatever strange ways you desire!
Or, to put it in a more boring way, here are the tools that allow you to write test cases as pure code, like you’re used to if you’re a developer.
Note: I list the top tools in alphabetical order; I won’t rank them because lists are silly. Read the information and then use that lump that sits on top of your neck to figure out which tool YOU should use.
Gatling
Gatling isn’t actually a favorite of mine because it is a Java app and I don’t like Java apps. Java apps are probably easy to use for people who spend their whole day working in a Java environment, but for others they are definitely not user-friendly.
Whenever something fails in an app written in mostly any other language you’ll get an error message that often helps you figure out what the problem is. If a Java app fails, you’ll get 1,000 lines of stack trace and repeated, generic error messages that are of absolutely zero help whatsoever. Also, running Java apps often requires manual tweaking of JVM runtime parameters. Perhaps Java is well suited for large enterprise backend software, but not for command-line apps like a load testing tool, so being a Java app is a clear minus in my book.
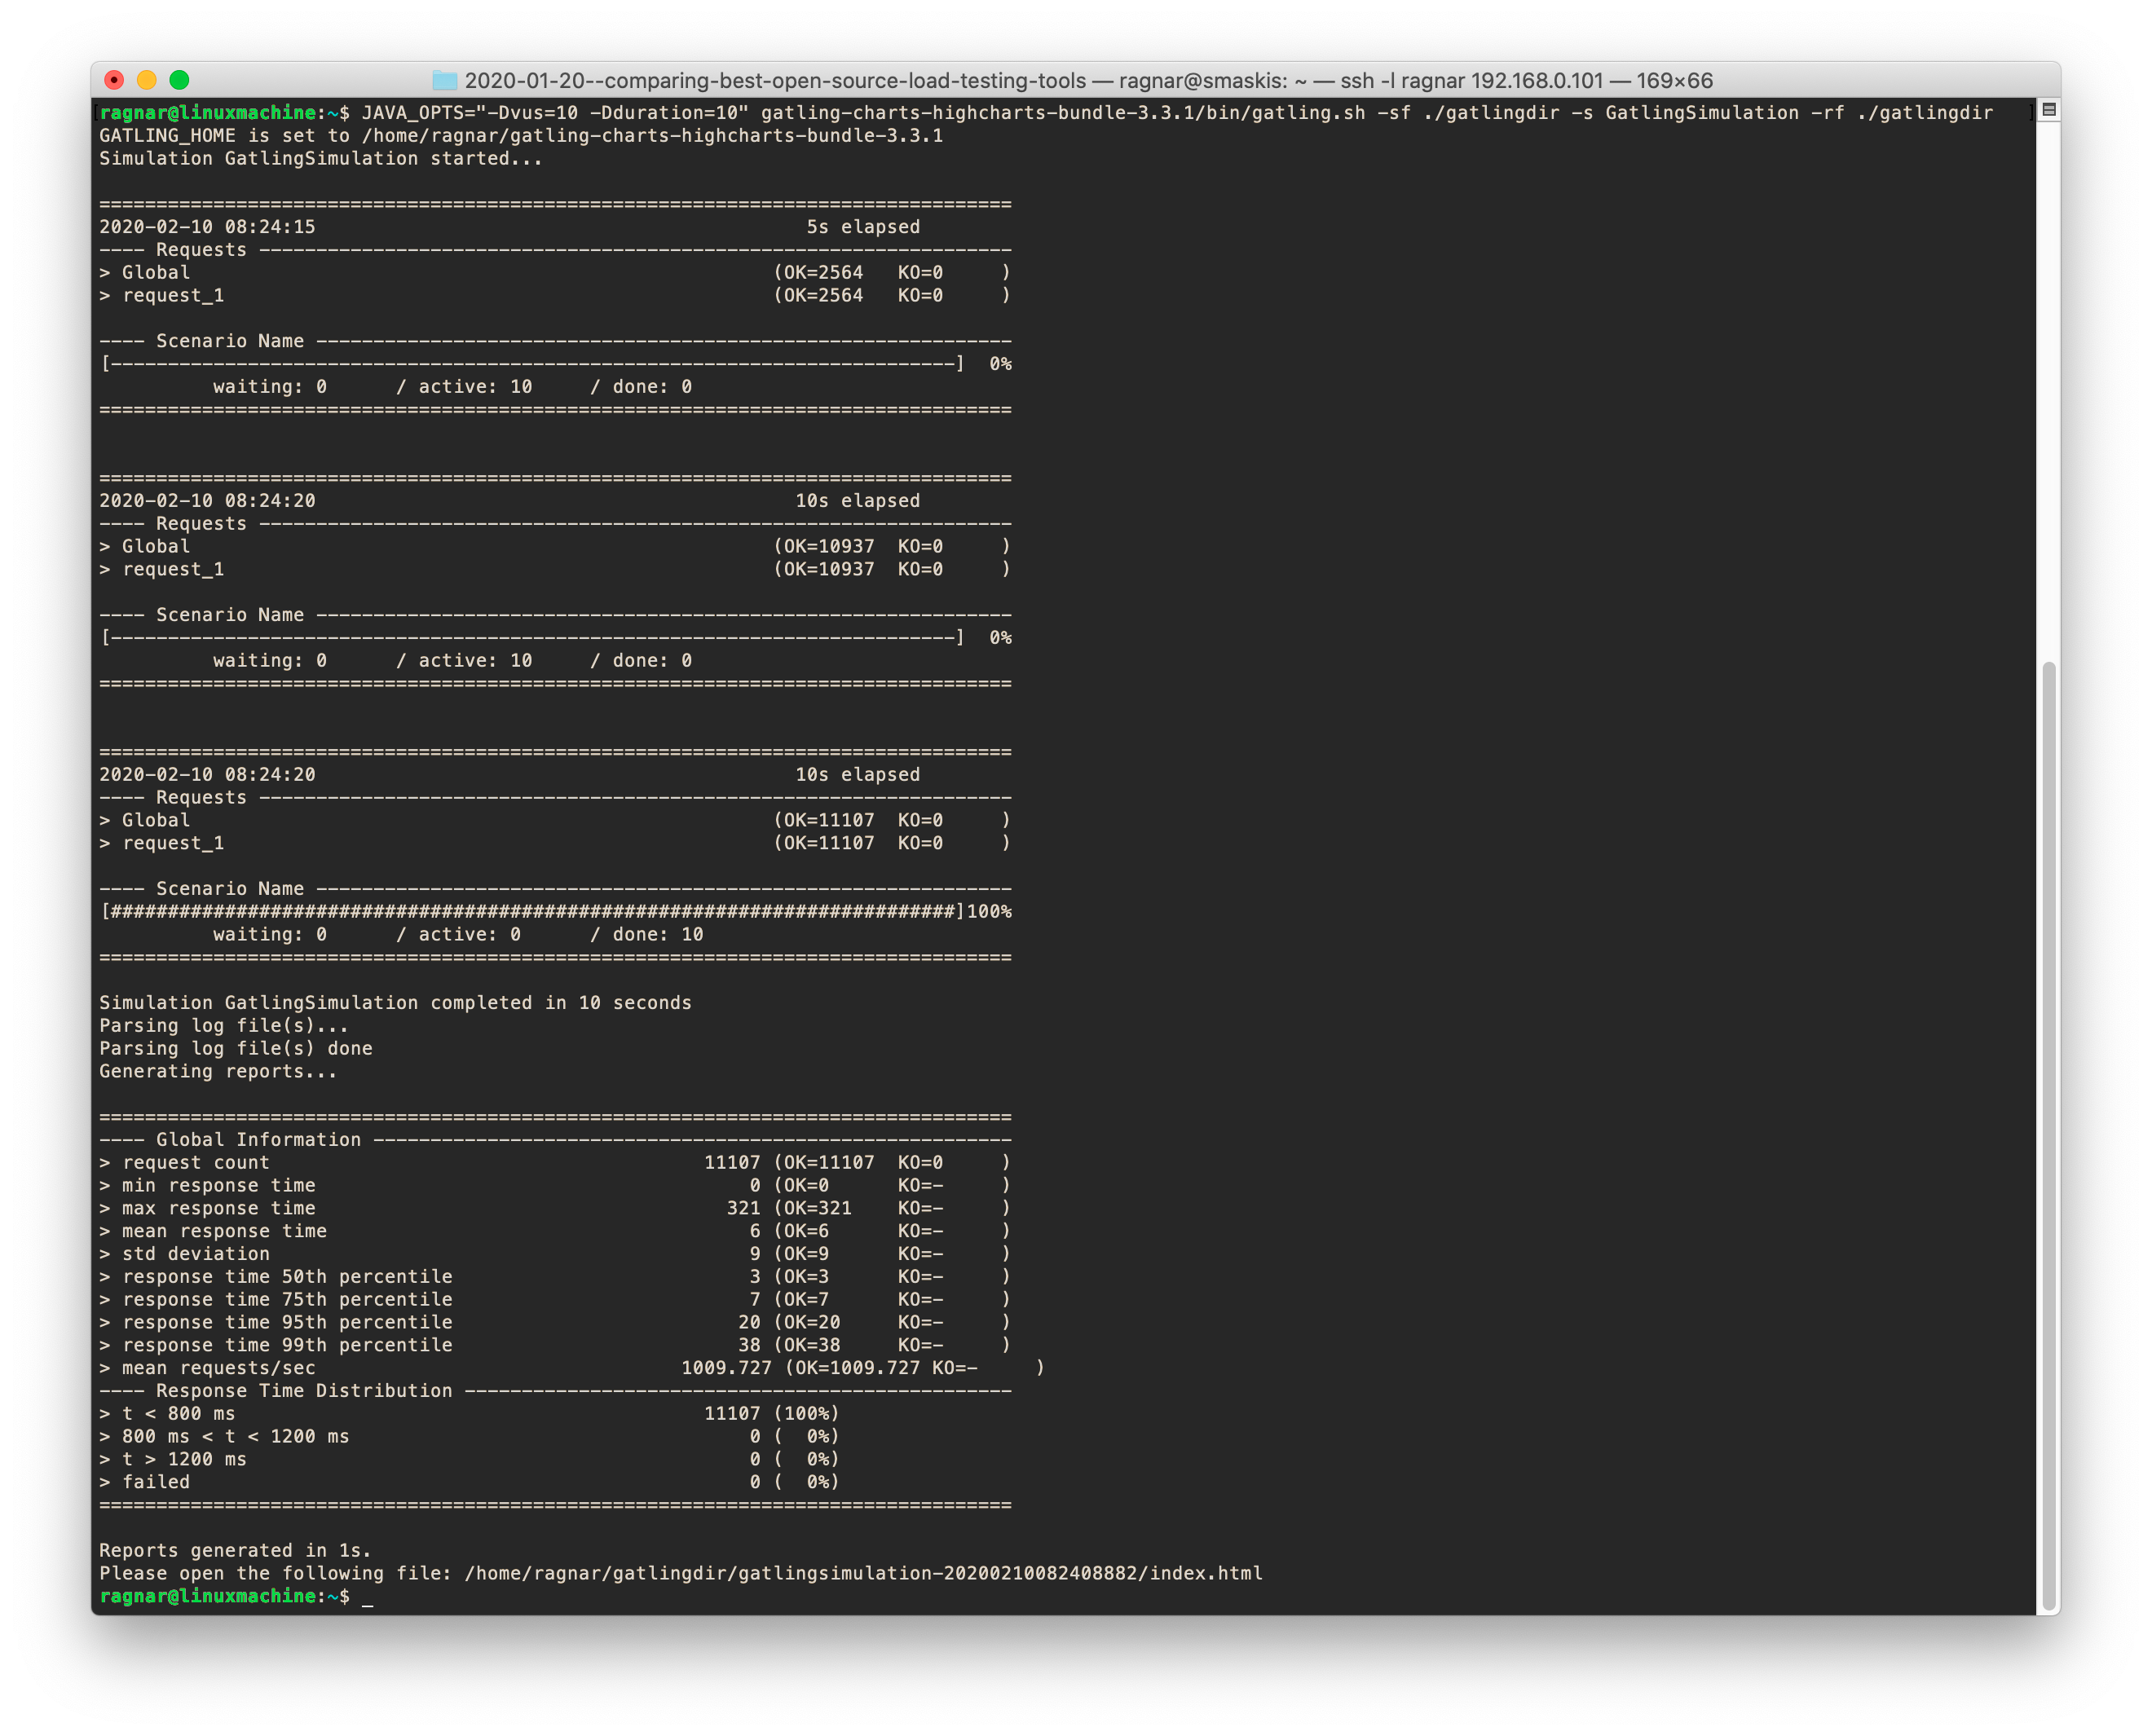
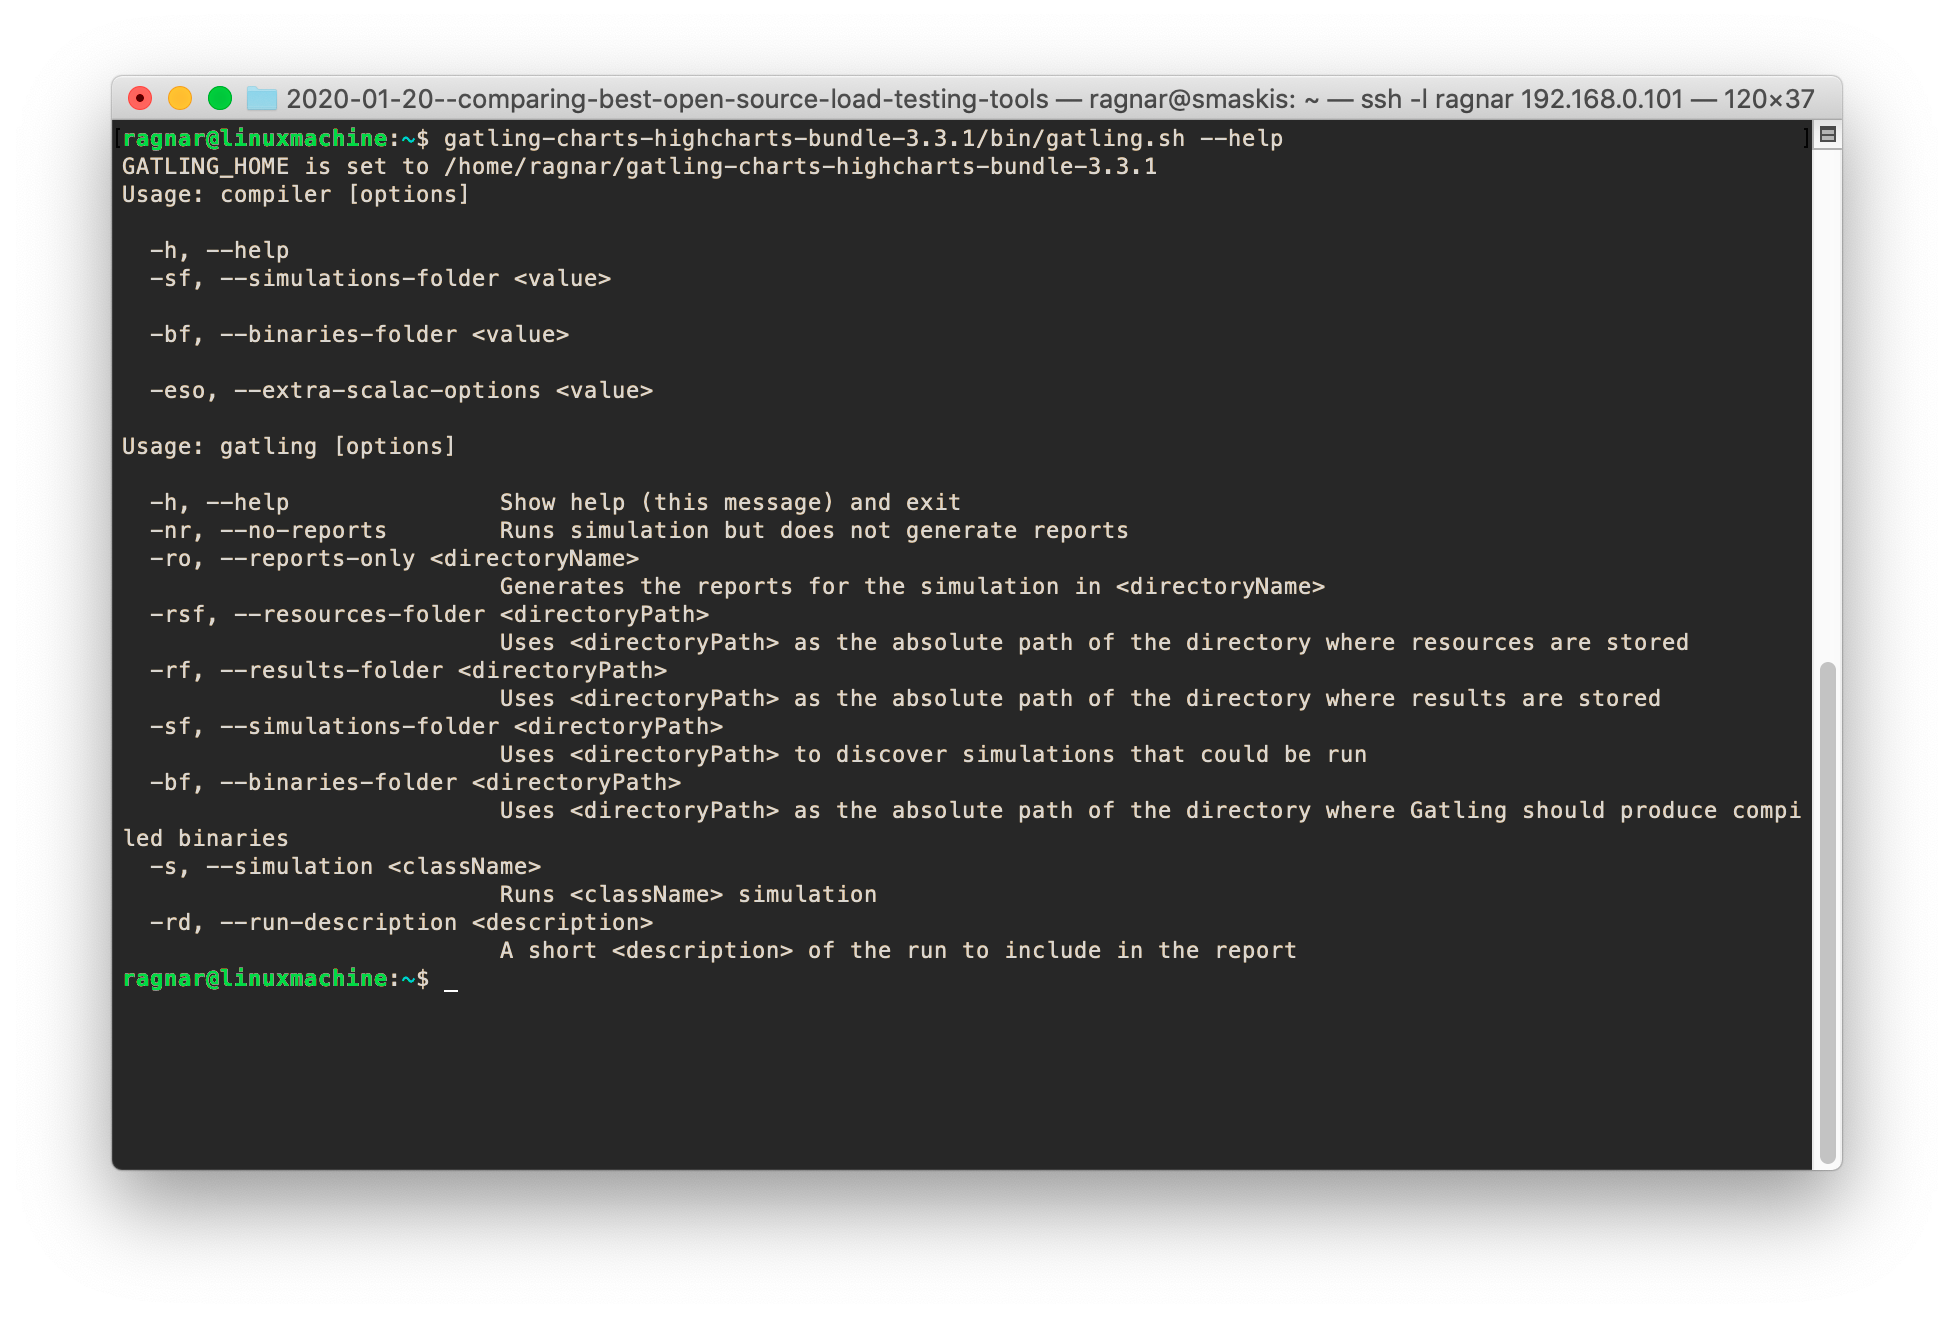
If you look at the screenshot above, you’ll note that you have to add parameters to your test inside a “JAVA_OPTS” environment variable, that is then read from your Gatling Scala script. There are no parameters you can give Gatling to affect concurrency/VUs, duration or similar, but this has to come from the Scala code itself. This way of doing things is nice when you’re only running something in an automated fashion, but kind of painful if you want to run a couple of manual tests on the command line.
Despite the Java-centricity (or is it “Java-centrism”?), I have to say that Gatling is a quite nice load testing tool. Its performance is not great, but probably adequate for most people. It has a decent scripting environment based on Scala. Again, Scala is not my thing but if you’re into it, or Java, it should be quite convenient for you to script test cases with Gatling.
Here is what a very simple Gatling script may look like:
import io.gatling.core.Predef._
import io.gatling.http.Predef._
import scala.concurrent.duration._

class GatlingSimulation extends Simulation {

  val vus = Integer.getInteger("vus", 20)
  val duration = Integer.getInteger("duration", 10)

  val scn = scenario("Scenario Name") // A scenario is a chain of requests and pauses
    .during (duration) {
      exec(http("request_1").get("http://192.168.0.121:8080/"))
        }
        setUp(scn.inject(atOnceUsers(vus)))
}
The scripting API seems capable and it can generate pass/fail results based on user-definable conditions.
I don’t like the text-based menu system you get by default when starting Gatling. Luckily, that can be skipped by using the right command-line parameters. If you dig into it just a little bit, Gatling is quite simple to run from the command line.
The documentation for Gatling is very good, which is a big plus for any tool.
Gatling has a recording tool that looks competent, though I haven’t tried it myself as I’m more interested in scripting scenarios to test individual API end points, not record “user journeys” on a website. But I imagine many people who run complex load test scenarios simulating end user behavior will be happy the recorder exists.
Gatling will by default report results to stdout and generate nice HTML reports (using my favorite charting library, Highcharts) after the test has finished. It’s nice to see that it has lately also gotten support for results output to Graphite/InfluxDB and visualization using Grafana.
Gatling help output
Gatling summary
Overall, Gatling is a very competent tool that is actively maintained and developed. If you’re using JMeter today, you should definitely take a look at Gatling, just to see what you’re missing. (hint: usability!)
k6
As I was involved in the creation of k6, it’s not strange that I like the choices that project has made. The idea behind k6 was to create a high-quality load testing tool for the modern developer, which allowed you to write tests as pure code, had a simple and consistent command-line UX, had useful results output options, and had good enough performance. I think all these goals have been pretty much fulfilled, and this makes k6 a very compelling choice for a load testing tool. Especially for a developer like myself.
k6 is scriptable in plain JavaScript and has what I think is the nicest scripting API of all tools I’ve tested. This API that makes it easy to perform common operations, test that things behave as expected, and control pass/fail behavior for automated testing. Here is what a very simple k6 script might look like:
import http from 'k6/http';
import { check } from 'k6';

export default function () {
  const res = http.get('http://192.168.0.121:8080/');
  check(res, {
    'is status 200': (r) => r.status === 200,
  });
}
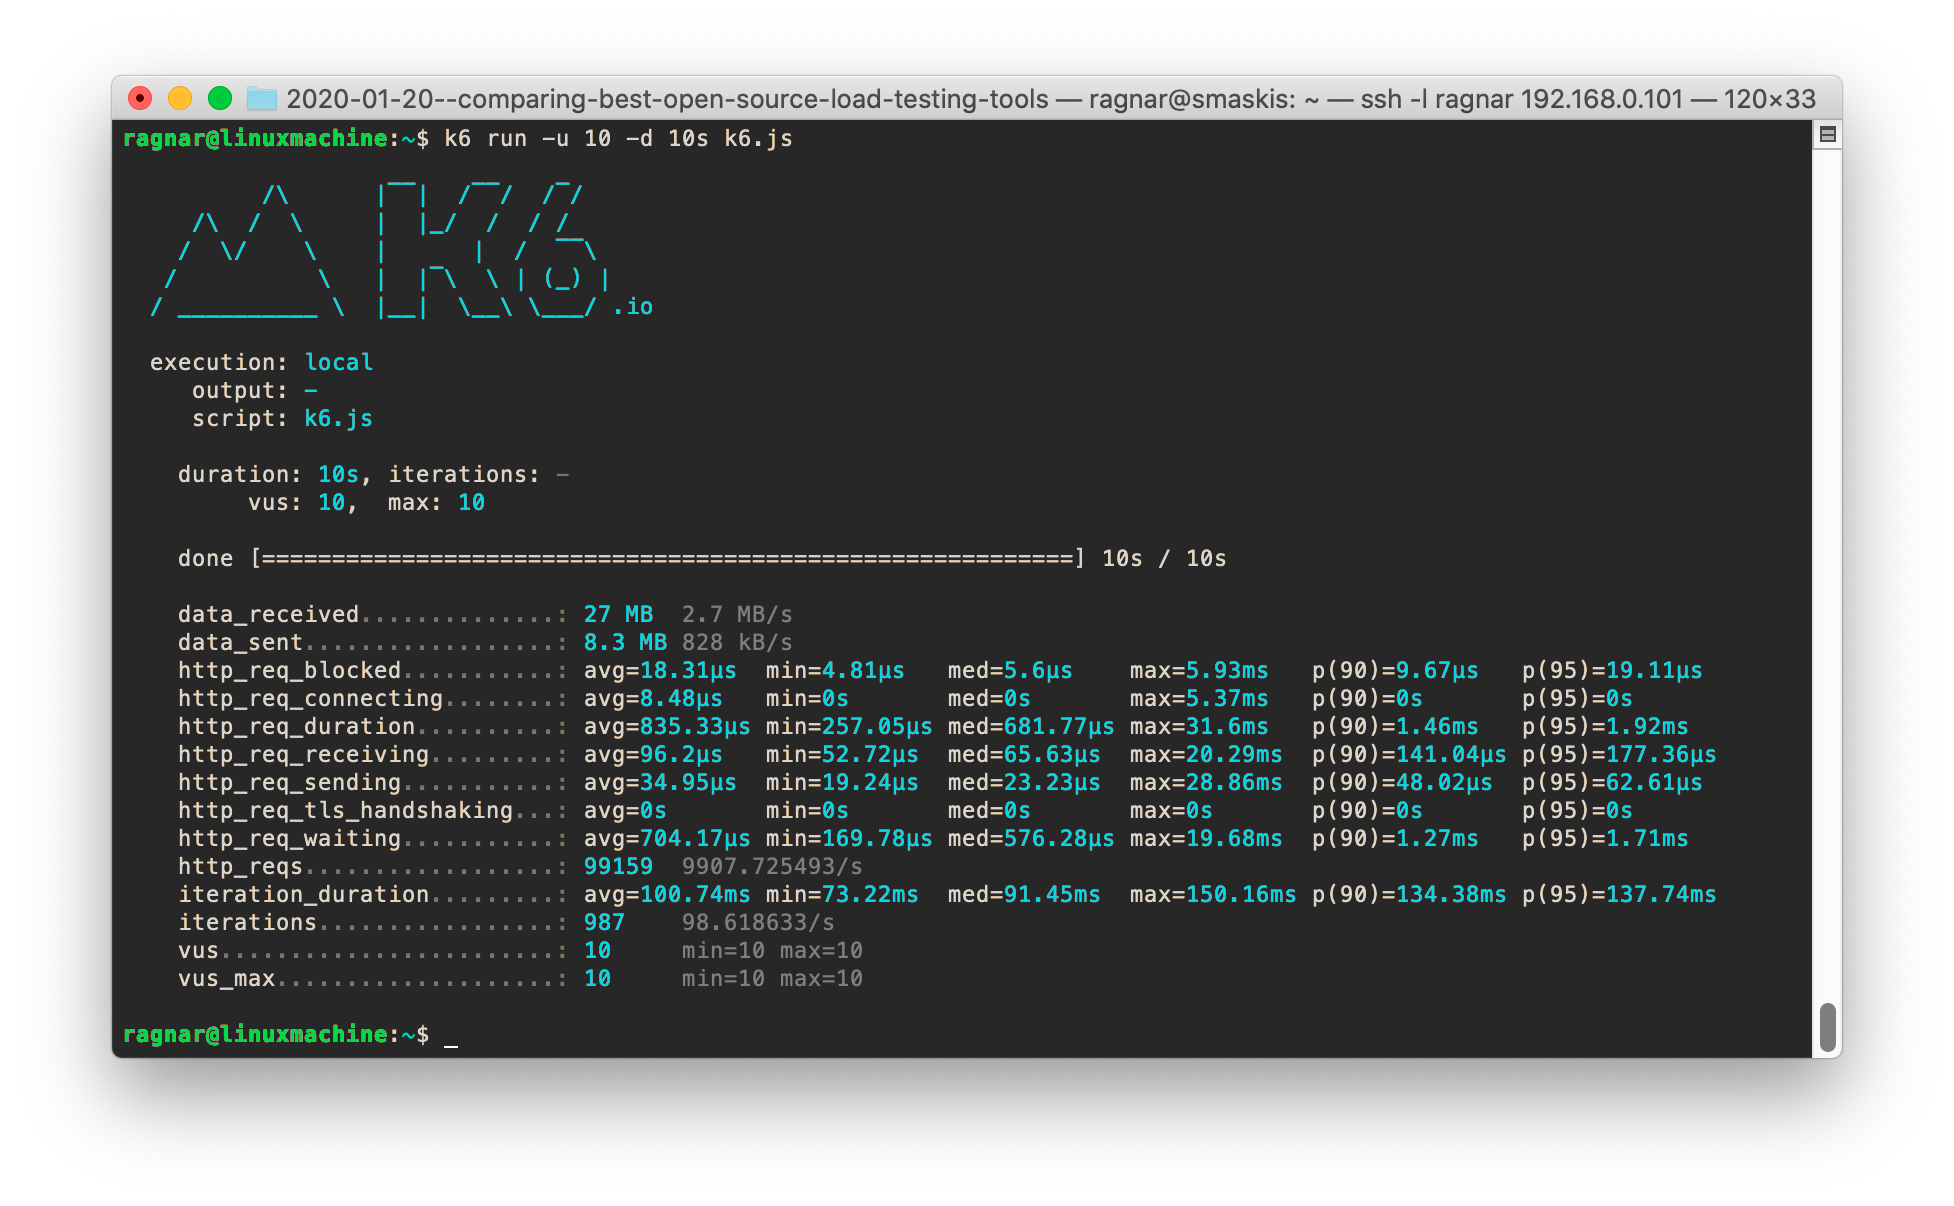
The above script will make each VU generate a HTTP transaction and then check that the response code was 200. The status of a check like this is printed on stdout, and you can set up thresholds to fail the test if a big enough percentage of your checks are failing. The k6 scripting API makes writing automated performance tests a very nice experience, IMO.
The k6 command line interface is simple, intuitive and consistent — It feels modern. k6 is among the faster tools in this review; it supports all the basic protocols (HTTP 1/2/Websocket); and it has multiple output options (text, JSON, InfluxDB, StatsD, Datadog, Kafka). Recording traffic from a browser is pretty easy as k6 can convert HAR files to k6 script, and the major browsers can record sessions and save them as HAR files. Also, there are options to convert Postman collections to k6 script code. Oh yeah, and the documentation is stellar overall (though I just spoke to a guy working on the docs and he was dissatisfied with the state they’re in today, which I think is great. When a product developer is satisfied, the product stagnates).
What does k6 lack then? Well, load generation distribution is not included, so if you want to run really large-scale tests you’ll have to buy the premium SaaS version (that has distributed load generation). On the other hand, its performance means you’re not very likely to run out of load generation capacity on a single physical machine anyway. It doesn’t come with any kind of web UI, if you’re into such things. I’m not.
One thing people may expect, but which k6 doesn’t have, is NodeJS-compatibility. Many (perhaps even most?) NodeJS libraries cannot be used in k6 scripts. If you need to use NodeJS libraries, Artillery may be your only safe choice. (Oh nooo!)
Otherwise, the only thing I don’t like about k6 is the fact that I have to script my tests in JavaScript! JS is not my favorite language, and personally, I would have preferred using Python or Lua — the latter being a scripting language Load Impact has been using for years to script load tests and which is very resource-efficient. But in terms of market penetration, Lua is a fruit fly whereas JS is an elephant, so choosing JS over Lua was wise. And to be honest, as long as the scripting is not done in XML (or Java), I’m happy.
Like mentioned earlier, the open source version of k6 is being very actively developed, with new features added all the time. Do check out the Release notes/Changelog which, BTW, are some of the best written that I’ve ever seen (thanks to the maintainer @na– who is an ace at writing these things).
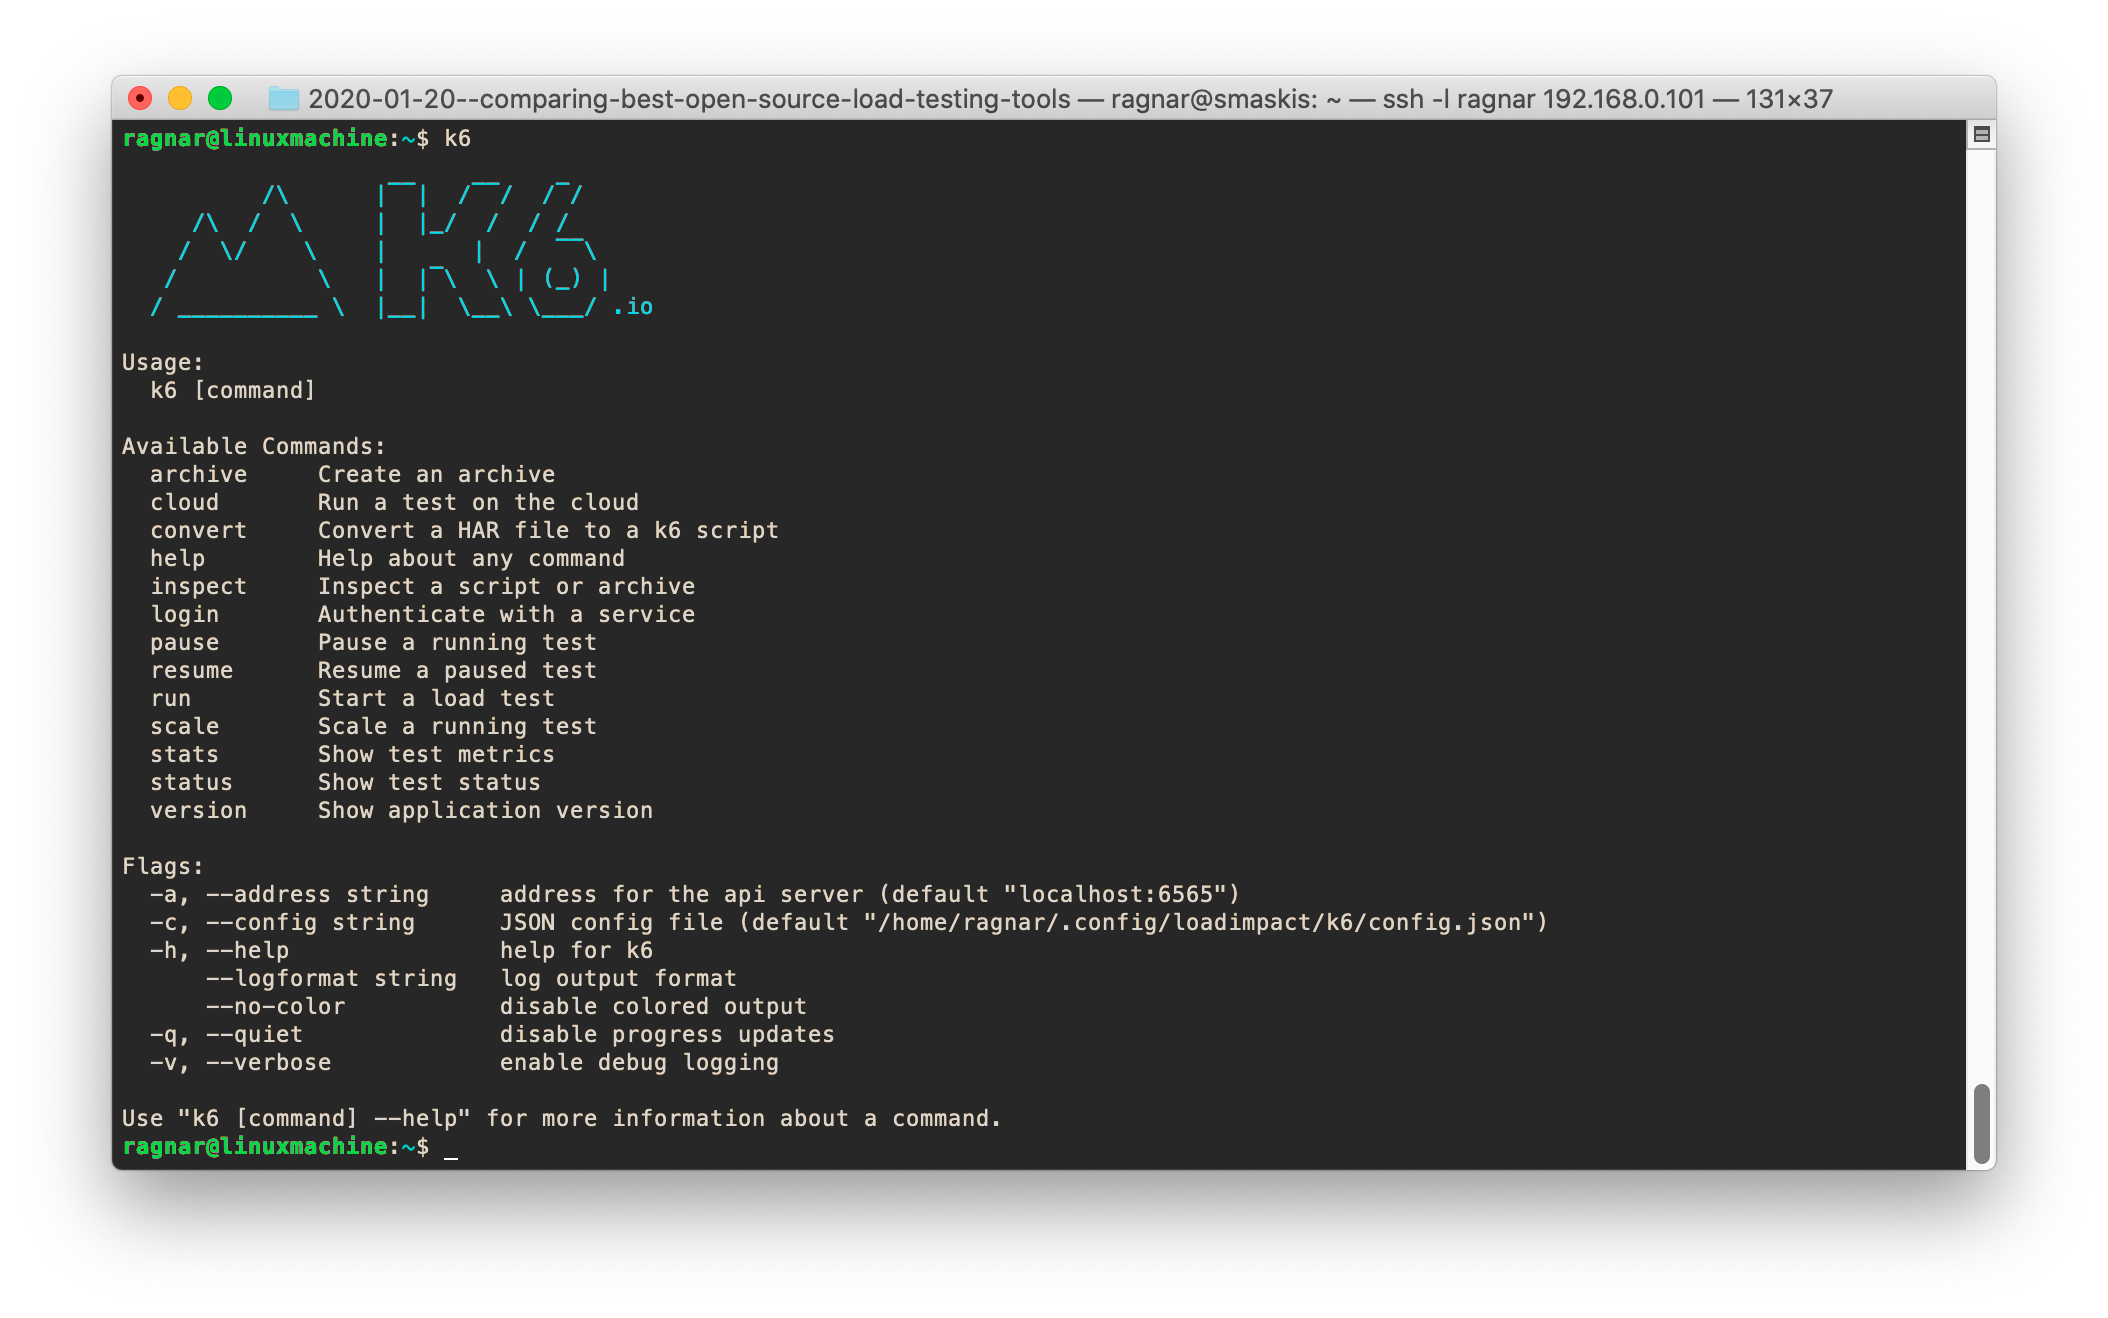
k6 help output
k6 also deserves a shout out for its built-in help, which is way nicer than that of any other tool in this review. It has a Docker-style, multi-level k6 help command where you can give arguments to display help for specific commands. For example, k6 help run will give you an extensive help text showing how to use the run command.
k6 summary
Not that I’m biased or anything, but I think k6 is way ahead of the other tools when you look at the whole experience for a developer. There are faster tools, but none faster that also supports sophisticated scripting. There are tools that support more protocols, but k6 supports the most important ones. There are tools with more output options, but k6 has more than most. In practically every category, k6 is average or better. In some categories (documentation, scripting API, command line UX) it is outstanding.
Locust
The scripting experience with Locust is very nice. The Locust scripting API is pretty good though somewhat basic and lacks some useful things other APIs have, such as custom metrics or built-in functions to generate pass/fail results when you want to run load tests in a CI environment.
The big thing with Locust scripting though is this — you get to script in Python! Your mileage may vary, but if I could choose any scripting language to use for my load tests I would probably choose Python. Here’s what a Locust script can look like:
from locust import TaskSet, task, constant
from locust.contrib.fasthttp import FastHttpLocust

class UserBehavior(TaskSet):
  @task
  def bench_task(self):
    while True:
      self.client.get("/")

class WebsiteUser(FastHttpLocust):
  task_set = UserBehavior
  wait_time = constant(0)
Nice, huh? Arguably even nicer than the look of a k6 script, but the API does lack some things like built-in support for pass/fail results BlazeMeter has an article about how you can implement your own assertions for Locust, which involves generating a Python exception and getting a stack trace. (Sounds a bit like rough terrain to me). Also, the new FastHttpLocust class (read more about it below) seems a bit limited in functionality (e.g., I’m not sure if there is HTTP/2 support).
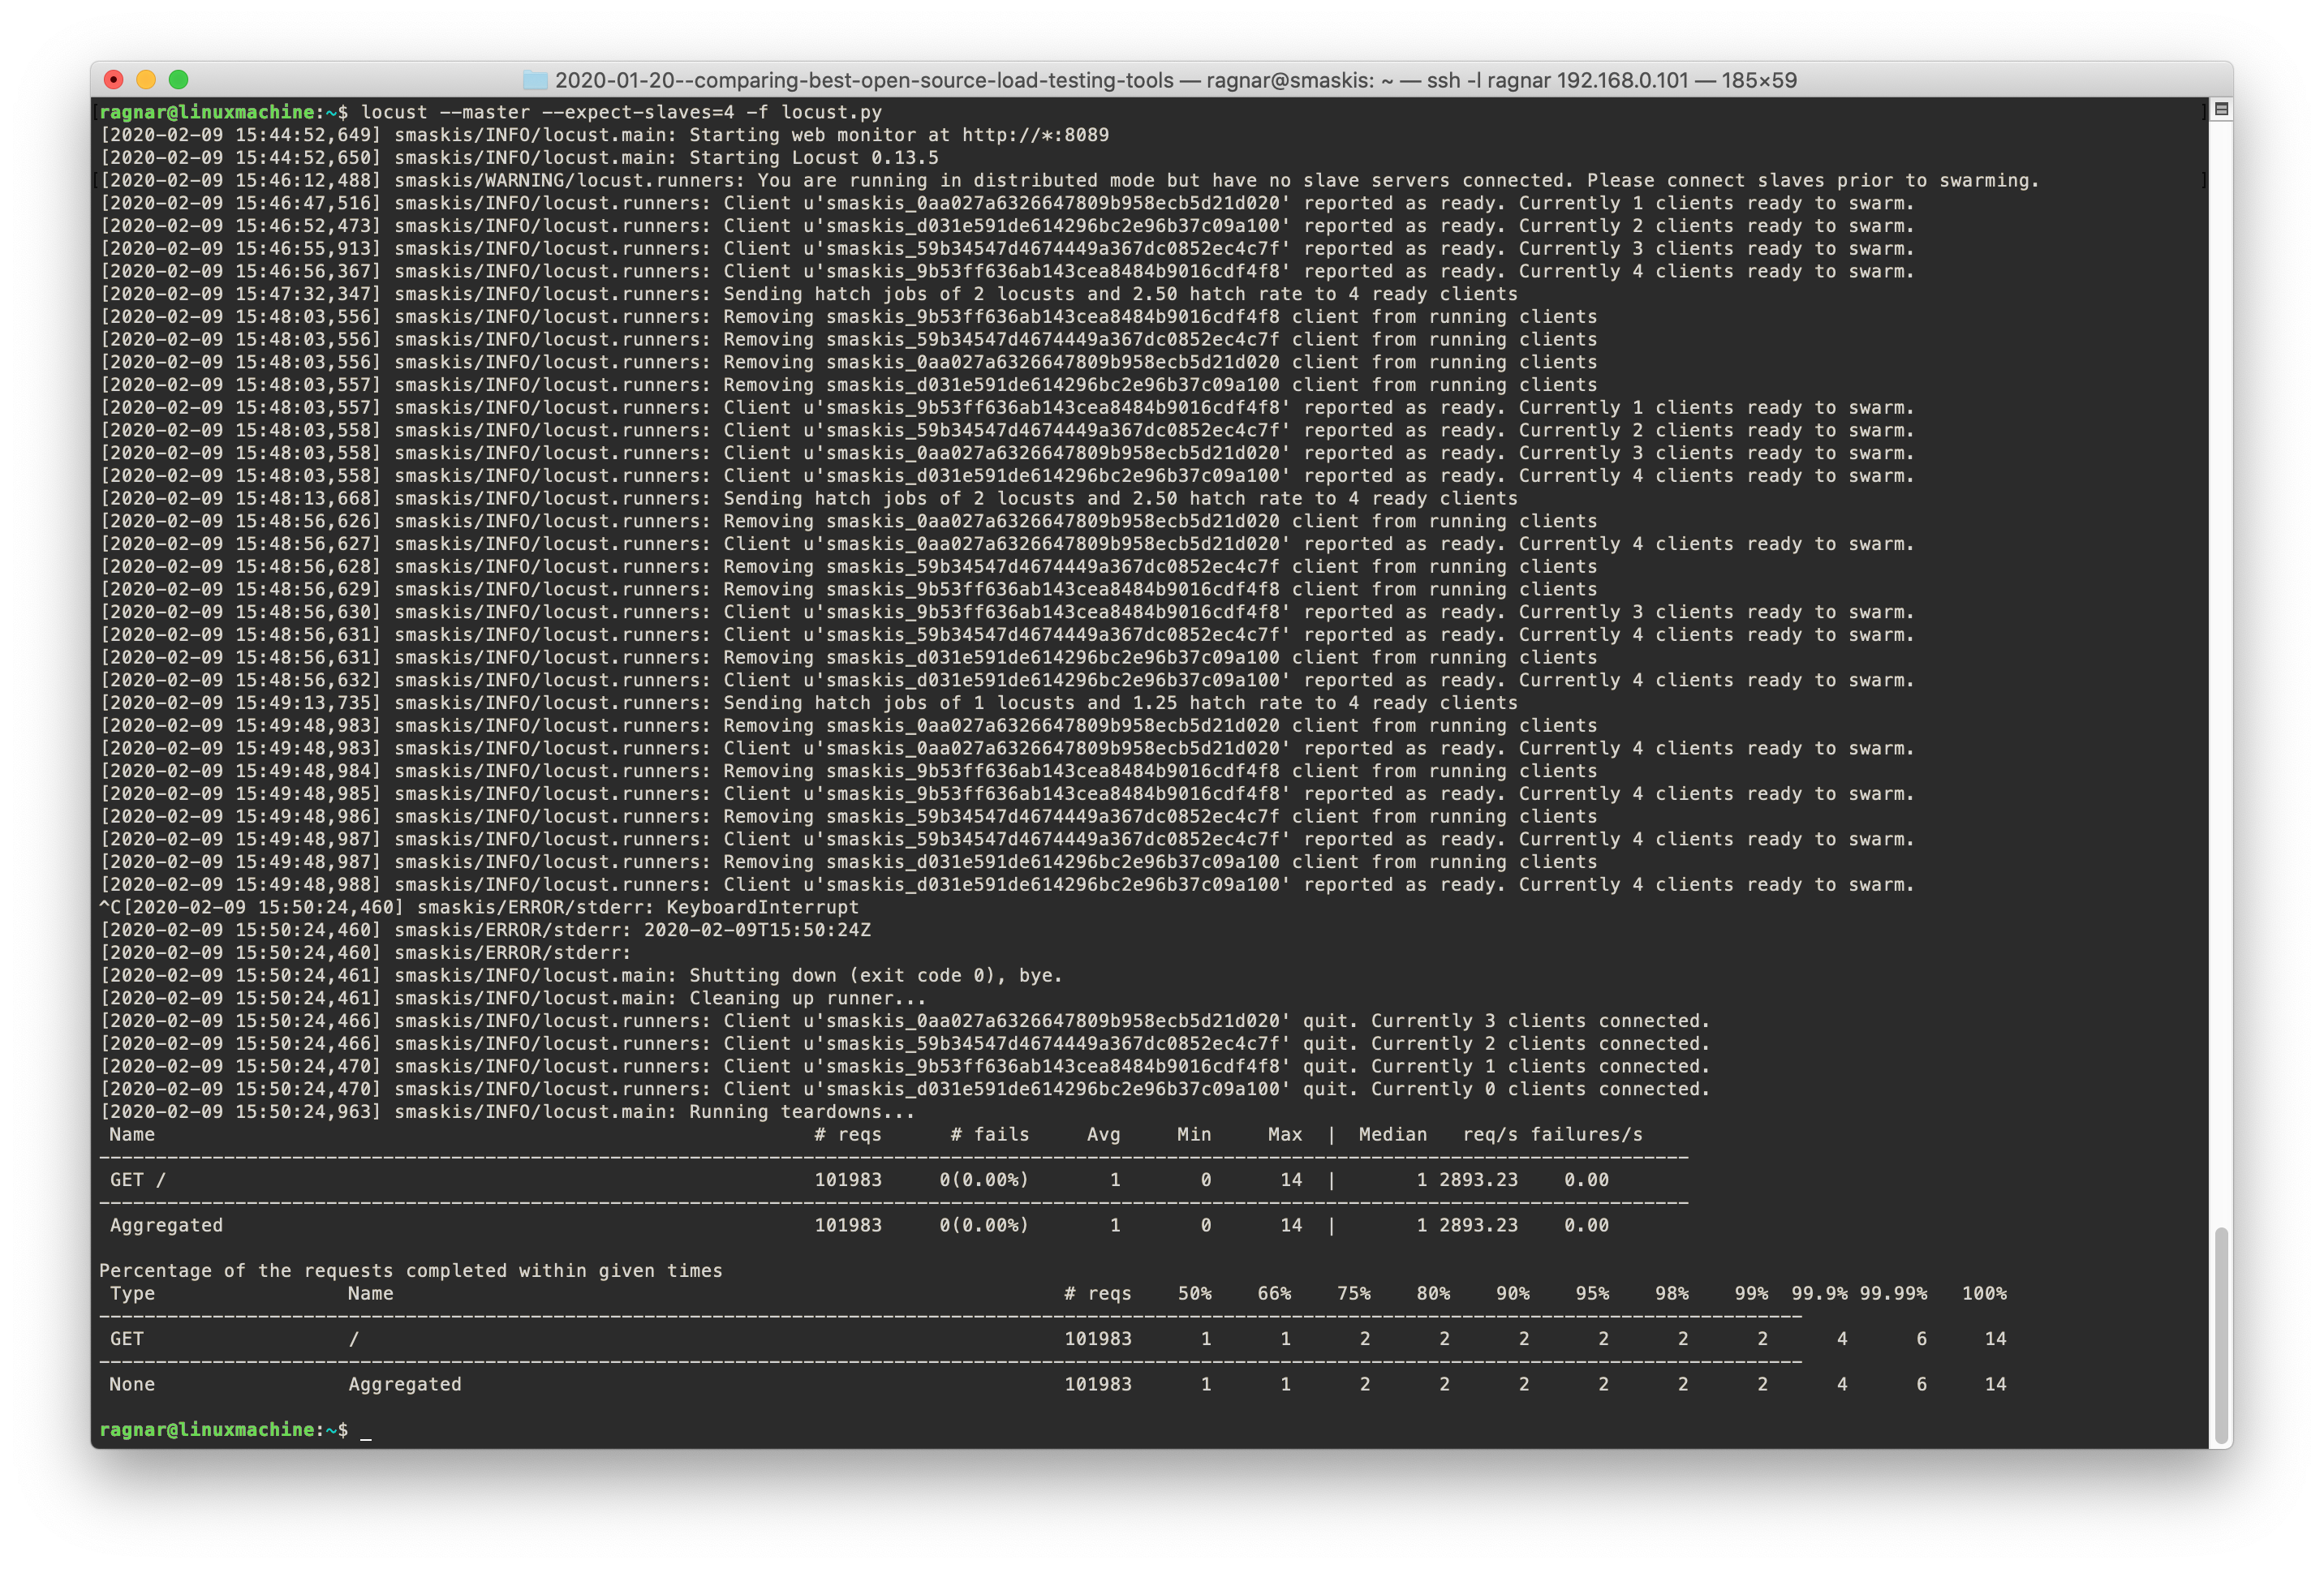
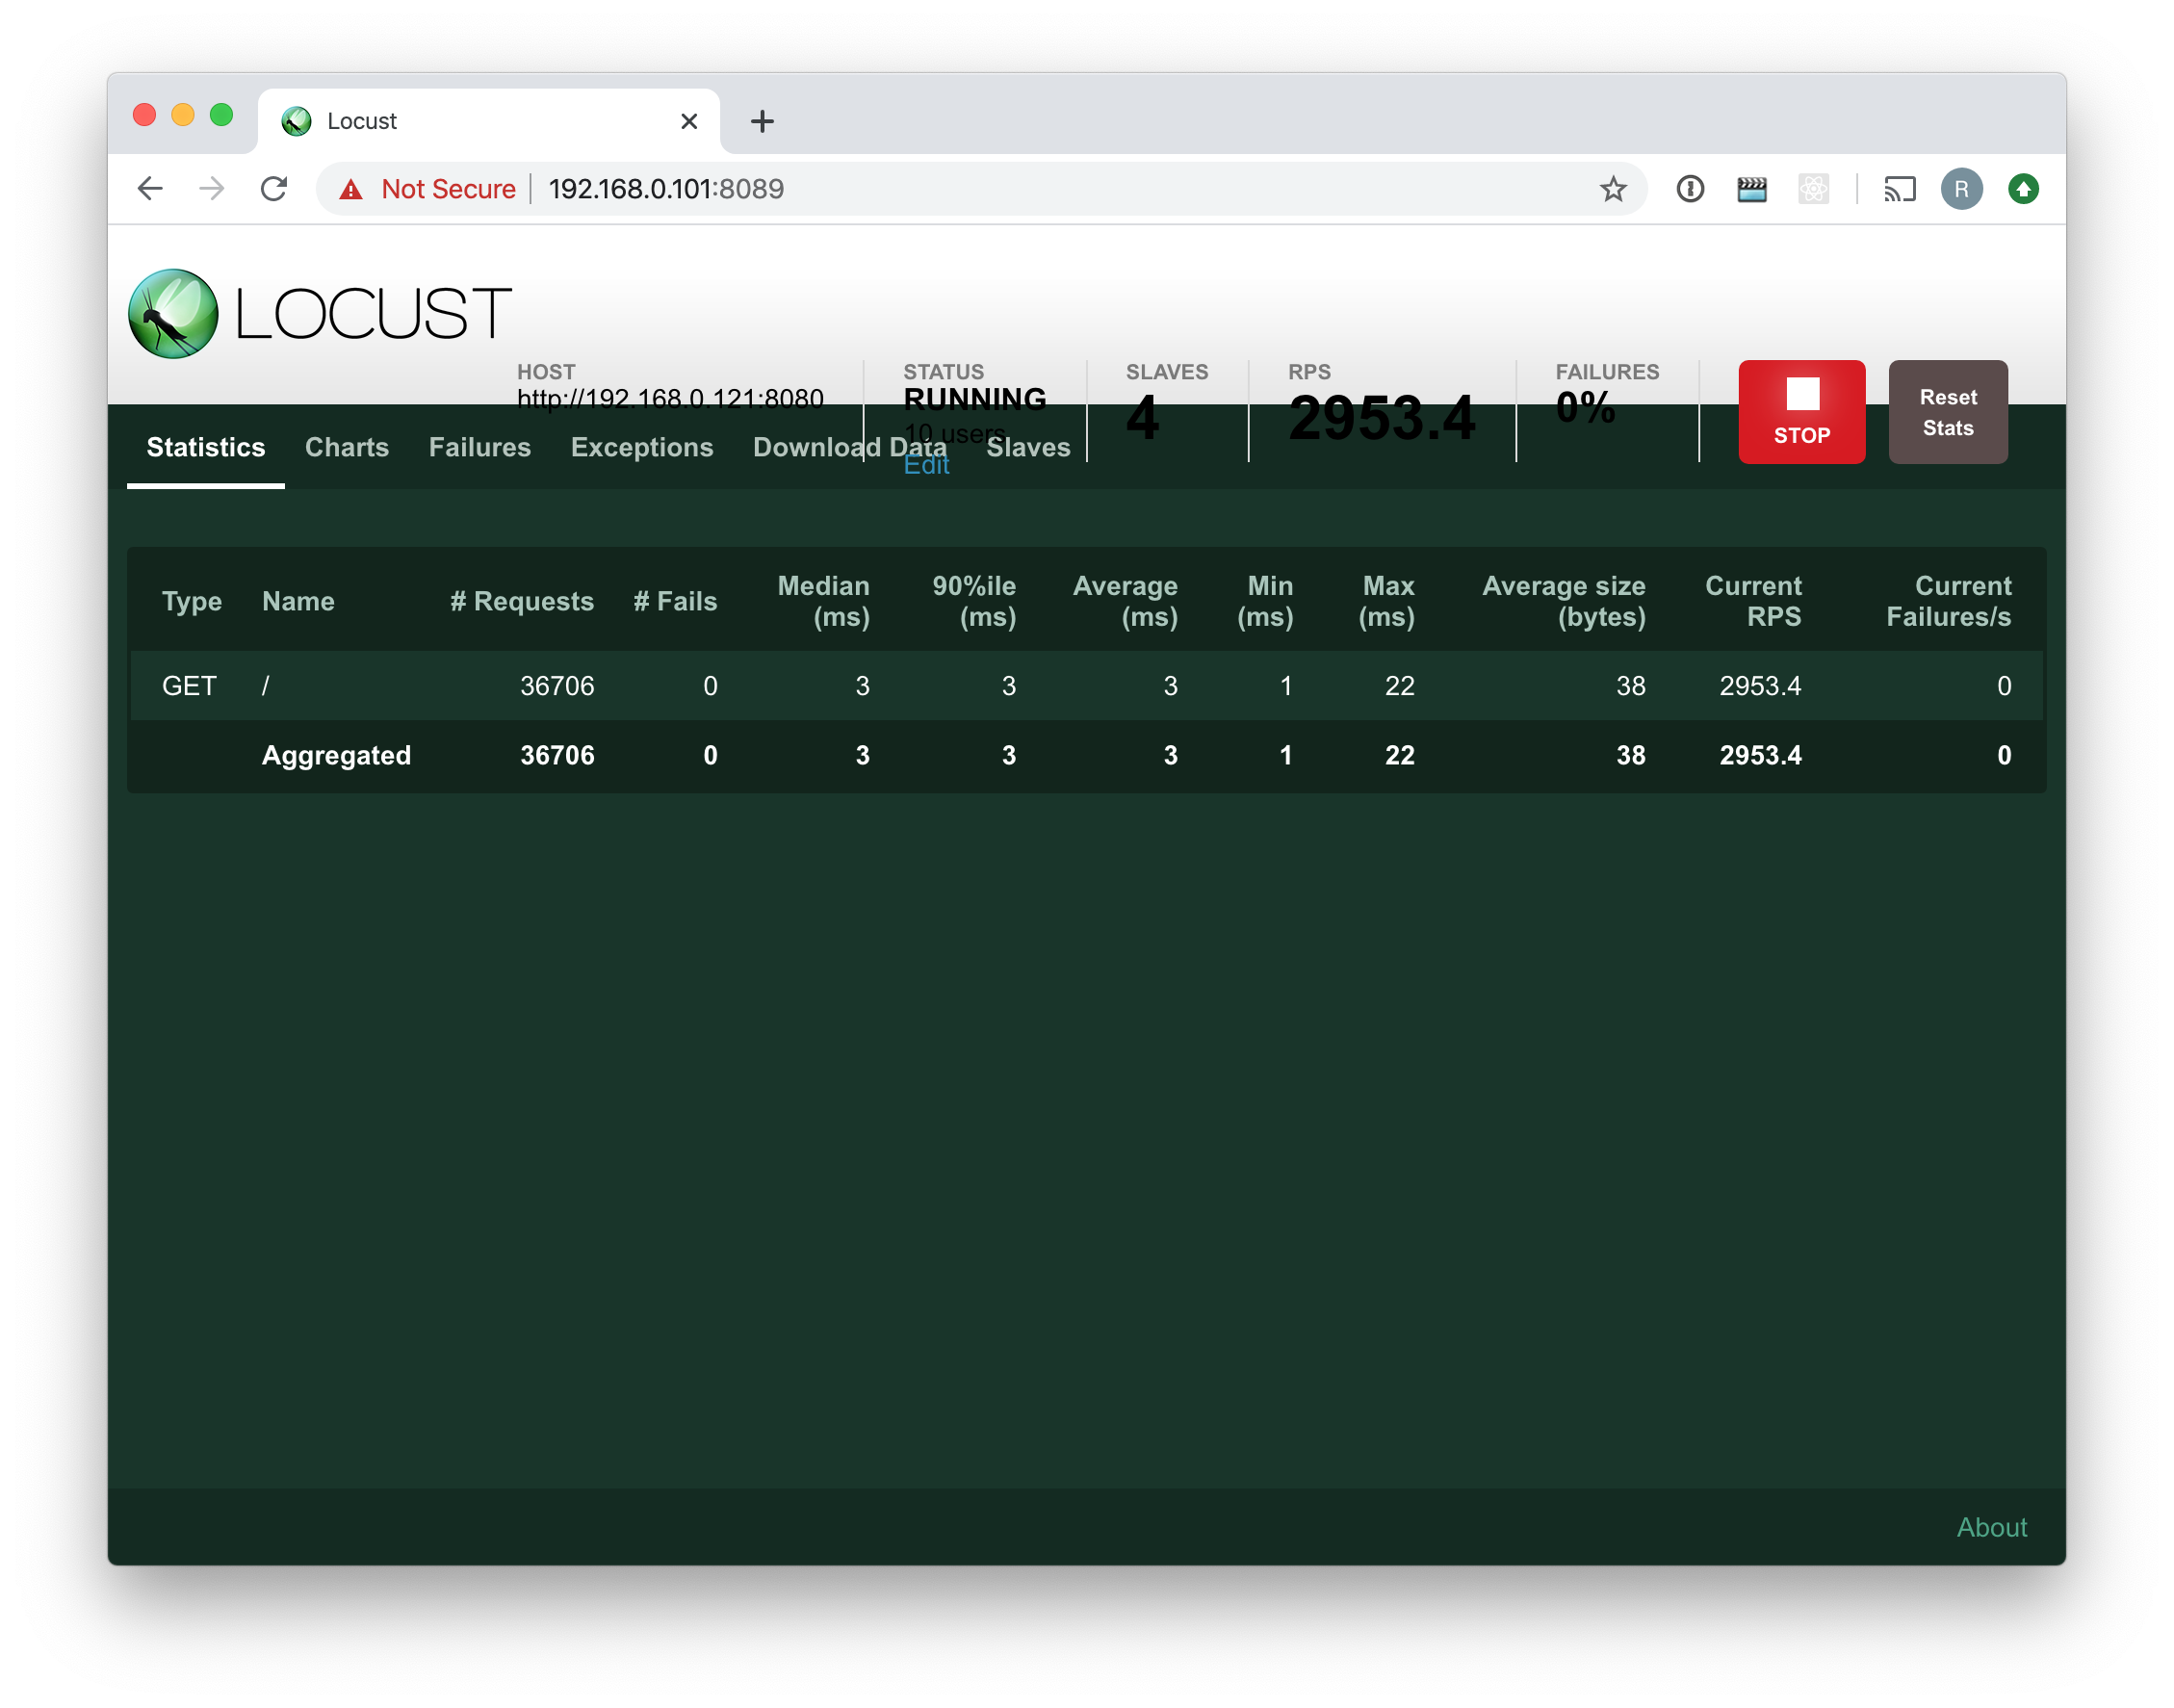
Locust has a nice command-and-control web UI that shows you live status updates for your tests and where you can stop the test or reset statistics. Plus it has easy-to-use load generation distribution built in. Starting a distributed load test with Locust is as simple as starting one Locust process with the --master switch, then multiple processes with the --slave switch and point them at the machine where the master is located.
Here is a screenshot from the UI when running a distributed test. As you can see I experienced some kind of UI issue (using Chrome 79.0.3945.130) that caused the live status data to get printed on top of the navigation menu bar (perhaps the host string was too long?) but otherwise this web UI is neat and functional. Even if I wrote somewhere else that I’m not into web UIs, they can be quite nice sometimes when you’re trying to control a number of slave load generators and stay on top of what’s happening.
Python is actually both the biggest upside and the biggest downside with Locust. The downside part of it stems from the fact that Locust is written in Python. Python code is slow, and that affects Locust’s ability to generate traffic and provide reliable measurements.
The first time I benchmarked Locust, back in 2017, the performance was horrible. Locust used more CPU time to generate one HTTP request than any other tool I tested. What made things even worse was that Locust was single-threaded, so if you did not run multiple Locust processes, Locust could only use one CPU core and would not be able to generate much traffic at all. Luckily, Locust had support for distributed load generation even then, and that made it go from the worst performer to the second worst, in terms of how much traffic it could generate from a single physical machine. Another negative thing about Locust back then was that it tended to add huge amounts of delay to response time measurements, making them very unreliable.
The cool thing is that since then, the Locust developers have made some changes and really sped up Locust. This is unique as all other tools have stayed still or regressed in performance the past two years. Locust introduced a new Python class/library called FastHttpLocust, which is a lot faster than the old HttpLocust class (that was built on the Requests library). In my tests now, I see a four to five times speedup in terms of raw request generation capability, and that is in line with what the Locust authors describe in the docs also. This means that a typical, modern server with 4-8 CPU cores should be able to generate 5-10,000 RPS running Locust in distributed mode.
Note: Distributed execution will often still be necessary as Locust is still single-threaded. In the benchmark tests I also note that Locust measurement accuracy degrades more gracefully with increased workload when you run it in distributed mode.
The nice thing with these improvements, however, is that now, chances are a lot of people will find that a single physical server provides enough power for their load testing needs when they run Locust. They’ll be able to saturate most internal staging systems, or perhaps even the production system (or a replica of it). Locust is still among the lower-performing tools in the review, but now it feels like performance is not making it unusable anymore.
Personally, I’m a bit schizophrenic about Locust. I love that you can script in Python (and use a million Python libraries!). That is the by far biggest selling point for me. I like the built-in load generation distribution, but wouldn’t trust that it scales for truly large-scale tests (I suspect the single --master process will become a bottleneck pretty fast; it would be interesting to test). I like the scripting API, although it wouldn’t hurt if it had better support for pass/fail results and the HTTP support with FastHttpLocust seems basic. I like the built-in web UI. I don’t like the overall low performance that may force me to run Locust in distributed mode even when on a single host. Having to provision multiple Locust instances is an extra complication I don’t really want, especially for automated tests. I don’t like the command line UX so much.
About distributed execution on a single host: I don’t know how hard it would be to make Locust launch in
--mastermode by default and then have it automatically fire off multiple--slavedaughter processes. Maybe one per detected CPU core? (Everything of course configurable if the user wants to control it.) Make it work more like NGINX. That would result in a nicer user experience, IMO, with a less complex provisioning process — at least when you’re running it on a single host
Locust help output
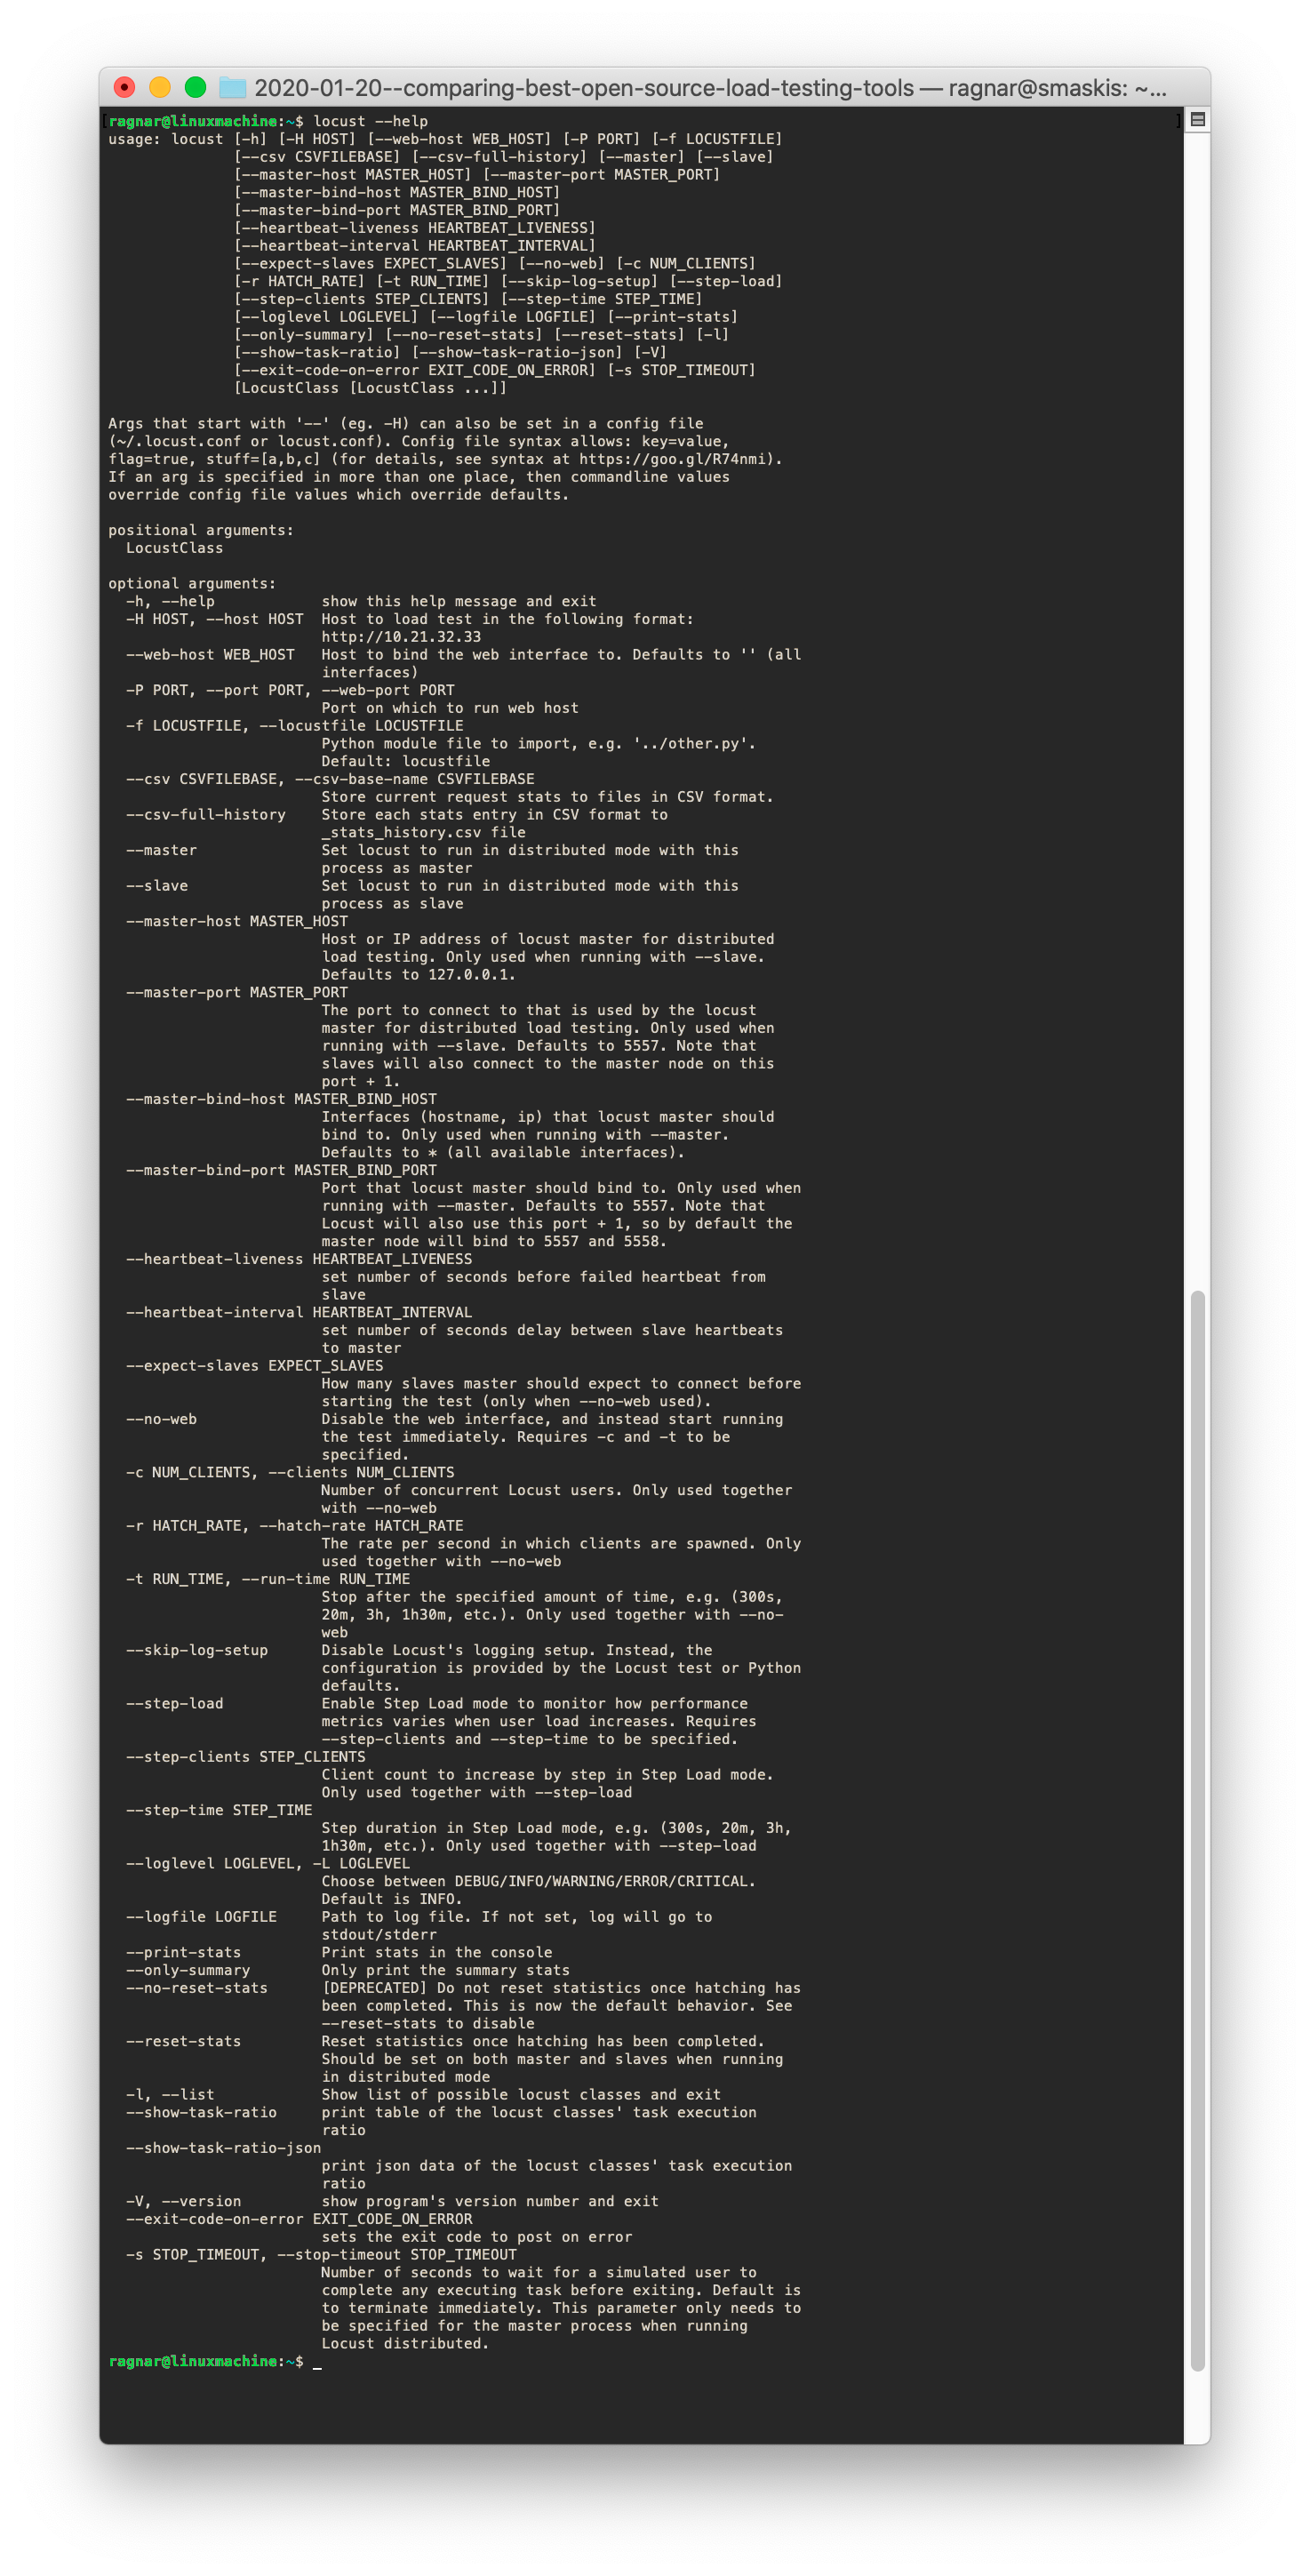
Locust summary
If it wasn’t for k6, Locust would be my top choice. If you’re really into Python you should absolutely take a look at Locust first and see if it works for you. I’d just make sure the scripting API allows you to do what you want to do in a simple manner and that performance is good enough, before going all in.
The rest of the tools
Here are my comments on the rest of the tools.
ApacheBench
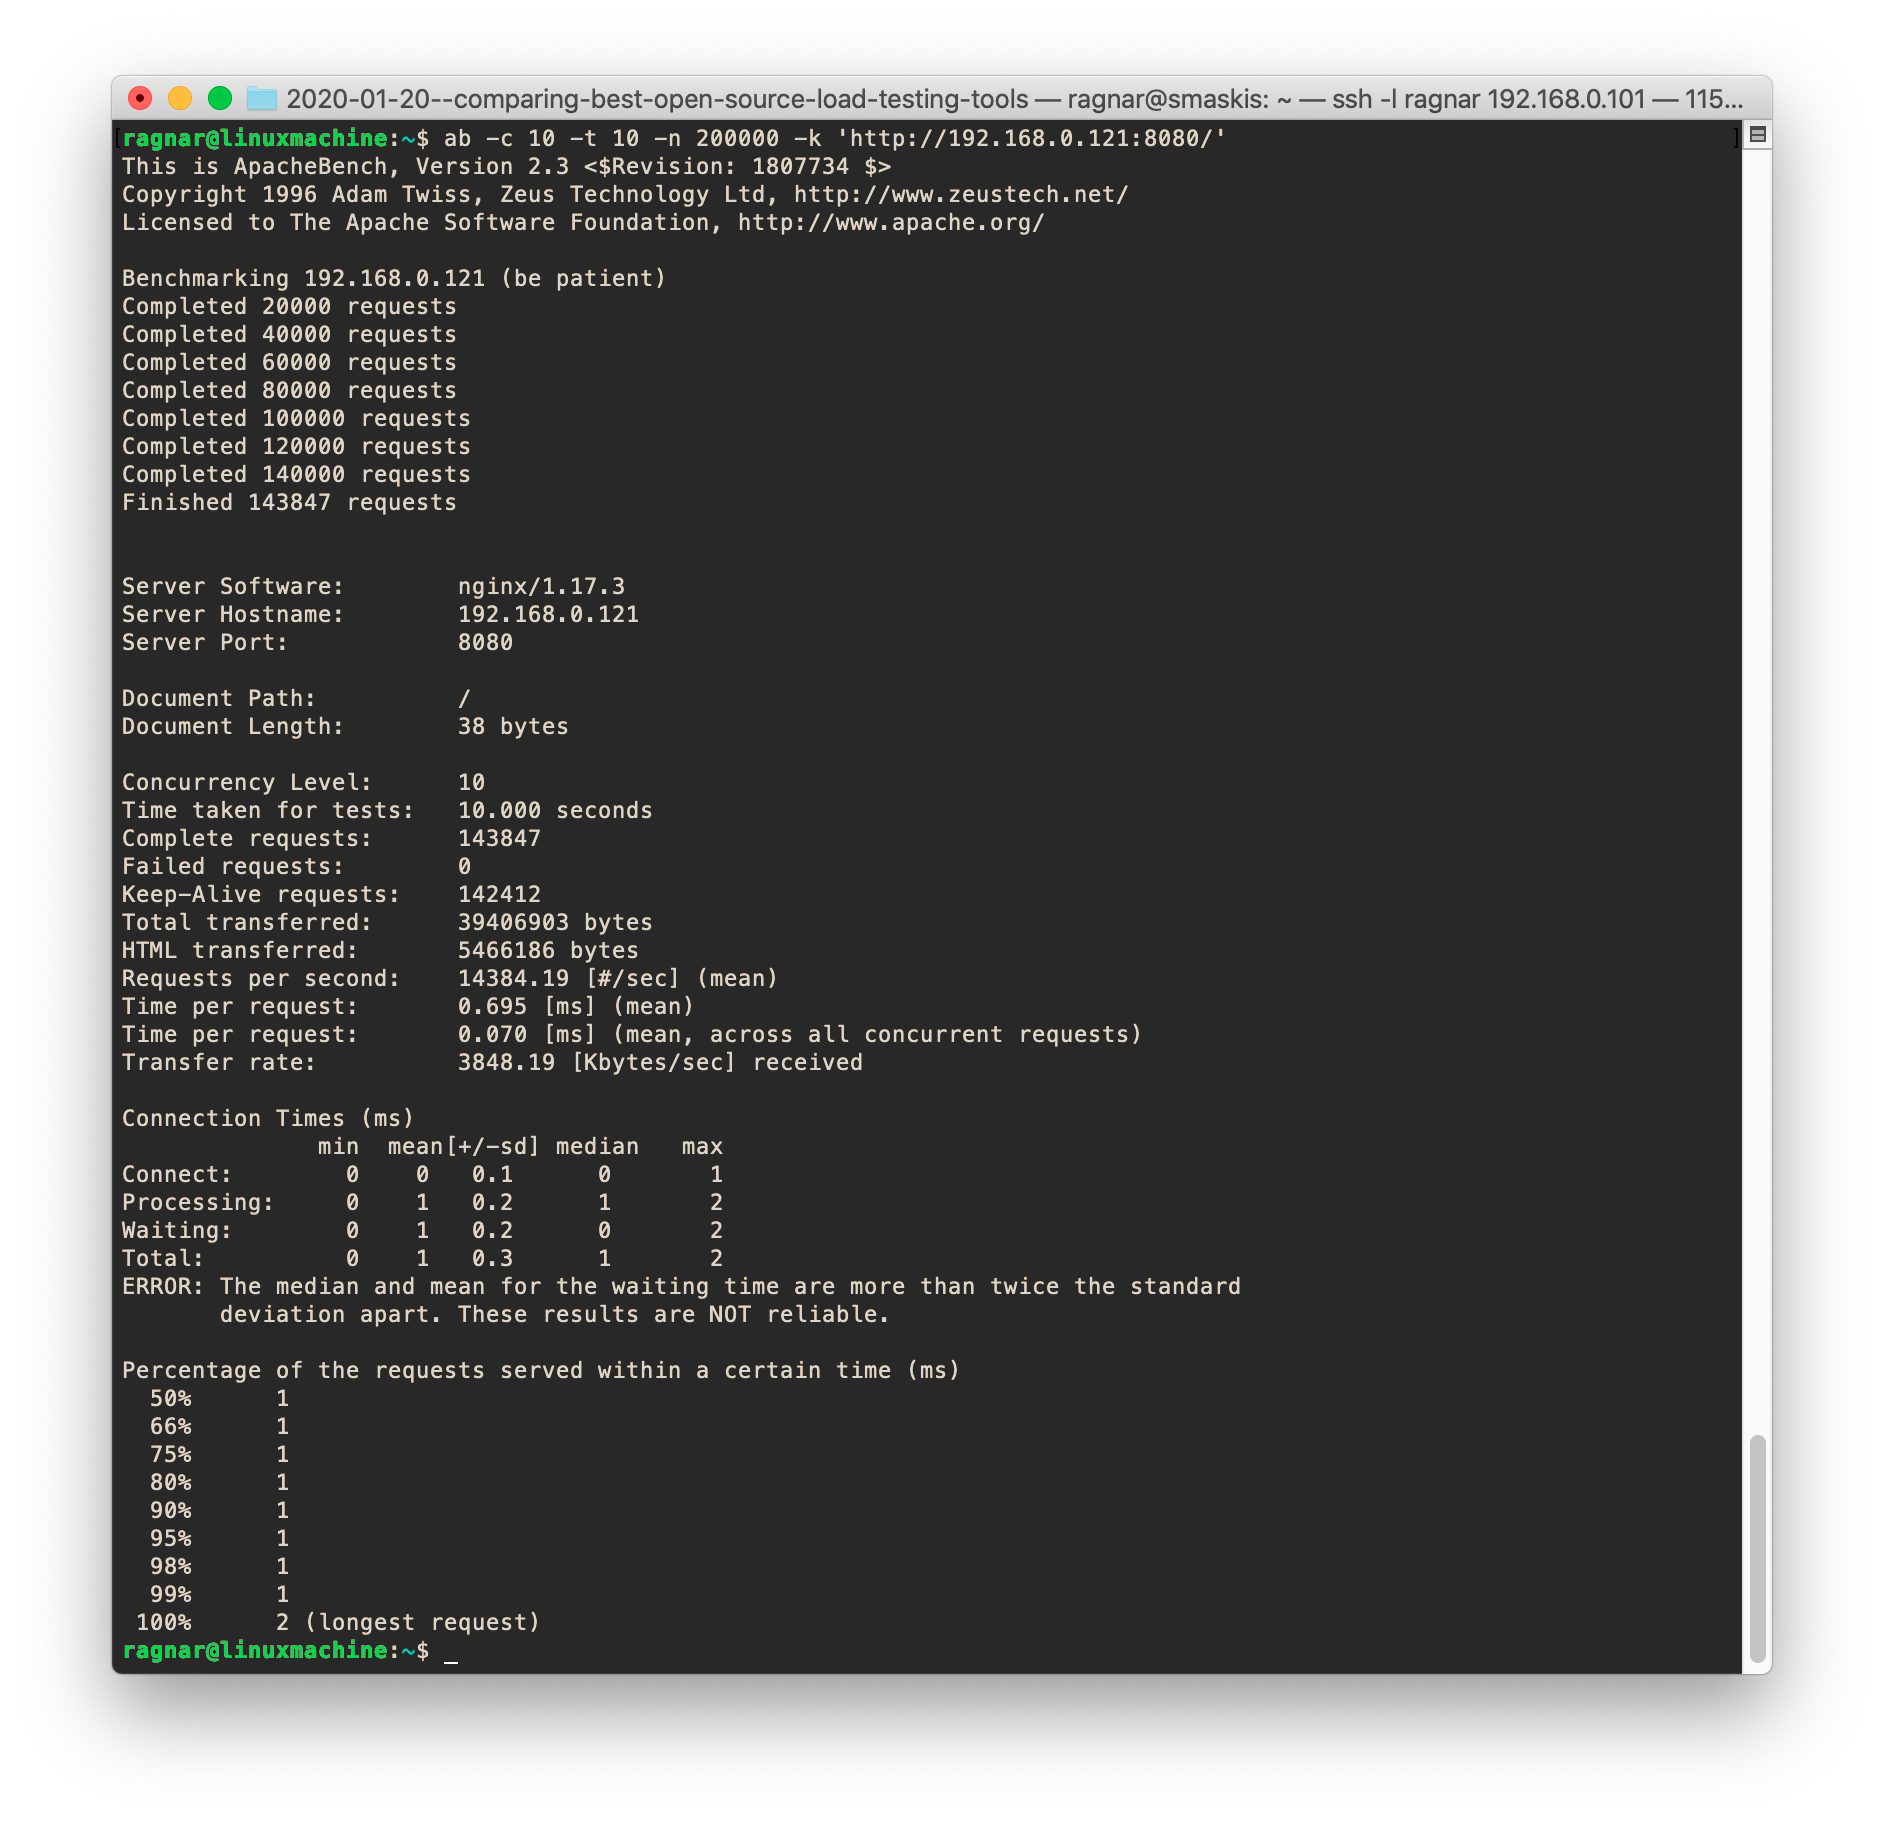
ApacheBench isn’t very actively developed and getting kind of old. I’m including it mainly because it is so common out there, being part of the bundled utilities for Apache httpd. ApacheBench is fast, but single-threaded. It doesn’t support HTTP/2 and there is no scripting capability.
ApacheBench summary
ApacheBench is good for simple hammering of a single URL. Its only competitor for that use case would be Hey, which is multi-threaded and supports HTTP/2.
Artillery
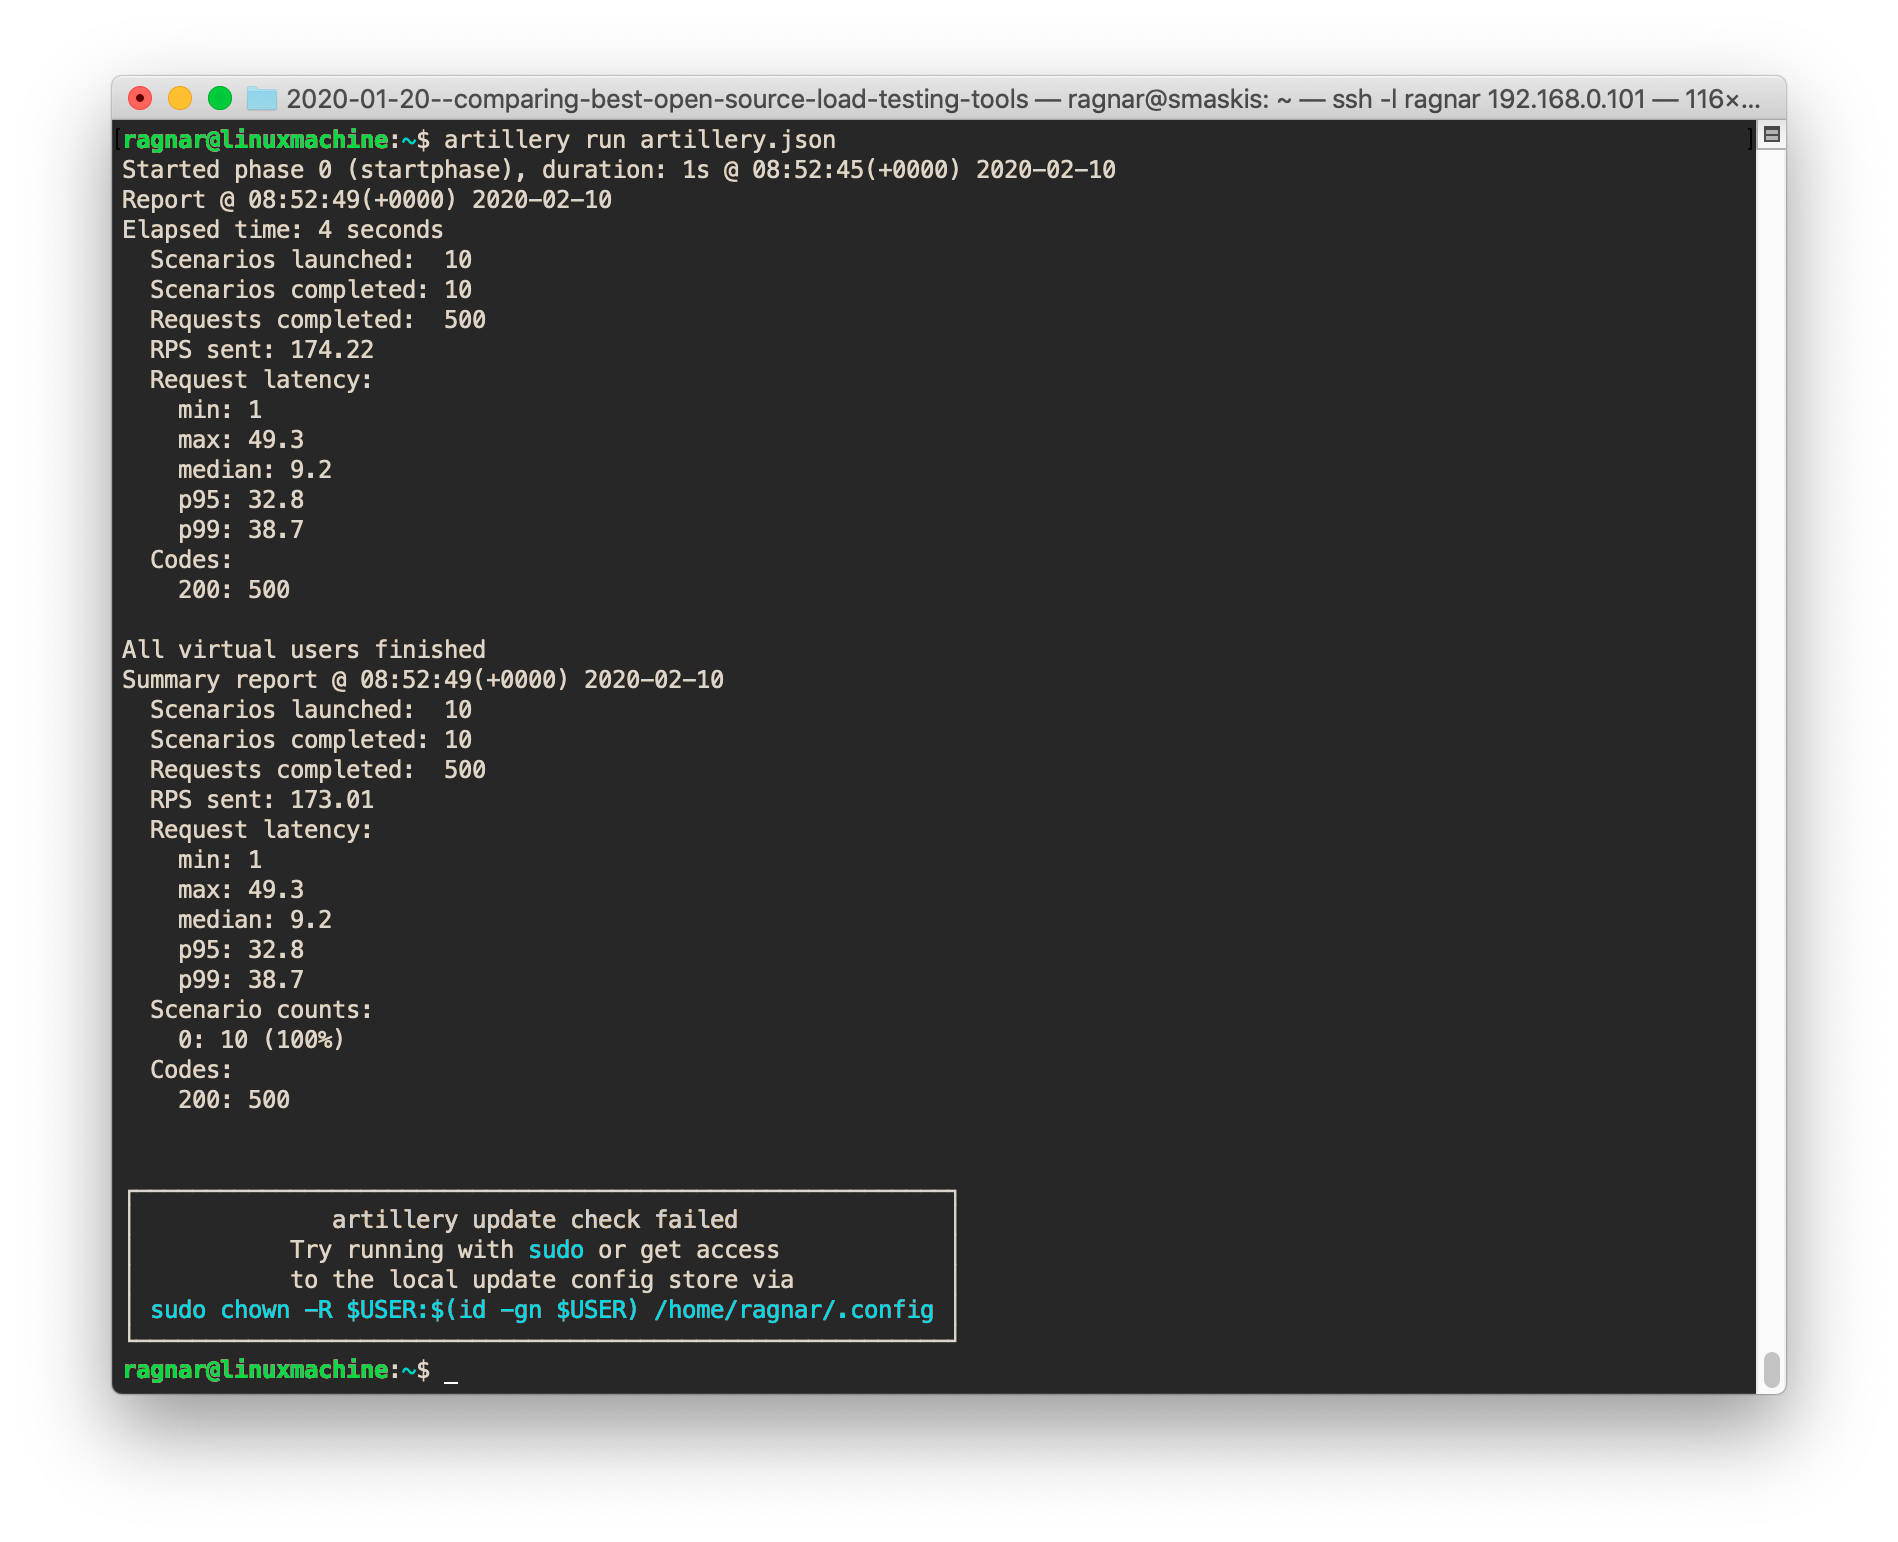
Artillery is a seriously slow, very resource-hungry, and possibly not-very-actively developed open source load testing tool. Not a very flattering summary I guess, but read on.
It is written in JavaScript, using NodeJS as its engine. The nice thing about building on top of NodeJS is NodeJS-compatibility: Artillery is scriptable in Javascript and can use regular NodeJS libraries, which is something k6 can’t do, despite k6 also being scriptable in regular JavaScript. The bad thing about being a NodeJS app, however, is performance: In the 2017 benchmark tests, Artillery proved to be the second-worst performer, after Locust. It was using a ton of CPU and memory to generate pretty unimpressive RPS numbers and response time measurements that were not very accurate at all.
I’m sad to say that things have not changed much here since 2017. If anything, Artillery seems a bit slower today.
In 2017, Artillery could generate twice as much traffic as Locust, running on a single CPU core. Today, Artillery can only generate one-third of the traffic Locust can produce, when both tools are similarly limited to using a single CPU core. Partly, this is because Locust has improved in performance, but the change is bigger than expected so I’m pretty sure Artillery performance has also dropped. Another data point that supports that theory is Artillery vs. Tsung. In 2017, Tsung was 10 times faster than Artillery. Today, Tsung is 30 times faster. I believe Tsung hasn’t changed in performance at all, which means Artillery is much slower than it used to be (and it wasn’t exactly fast back then either).
The performance of Artillery is definitely an issue, and an aggravating factor is that open source Artillery still doesn’t have any kind of distributed load generation support, so you’re stuck with a very low-performing solution unless you buy the premium SaaS product.
The artillery.io site is not very clear on what differences there are between Artillery open source and Artillery Pro, but there appears to be a Changelog only for Artillery Pro, and looking at the GitHub repo, the version number for Artillery open source is 1.6.0 while Pro is at 2.2.0, according to the Changelog. Scanning the commit messages of the open source Artillery, it seems there are mostly bug fixes there, and not too many commits over the course of two-plus years.
The Artillery team should make a better effort at documenting the differences between Artillery open source and the premium product Artillery Pro, and they should also write something about their intentions with the open source product. Is it being slowly discontinued? It sure looks that way.
Another thing to note related to performance is that nowadays Artillery will print “high-cpu” warnings whenever CPU usage goes above 80% (of a single core) and it is recommended to never exceed that amount so as not to “lower performance.” I find that if I stay at about 80% CPU usage so as to avoid these warnings, Artillery will produce a lot less traffic — about one-eighth the number of requests per second that Locust can do. If I ignore the warning messages and let Artillery use 100% of one core, it will increase RPS to one-third of what Locust can do. But at the cost of a pretty huge measurement error.
All the performance issues aside, Artillery has some good sides. It is quite suitable for CI/automation as it is easy to use on the command line, has a simple and concise YAML-based config format, has plugins to generate pass/fail results, and it outputs results in JSON format. And like I previously mentioned, it can use regular NodeJS libraries, which offer a huge amount of functionality that is simple to import. But all this is irrelevant to me when a tool performs the way Artillery does. The only situation where I’d even consider using Artillery would be if my test cases had to rely on some NodeJS libraries that k6 can’t use, but Artillery can.
Artillery summary
Only ever use it if you’ve already sold your soul to NodeJS (i.e., if you have to use NodeJS libraries).
Drill
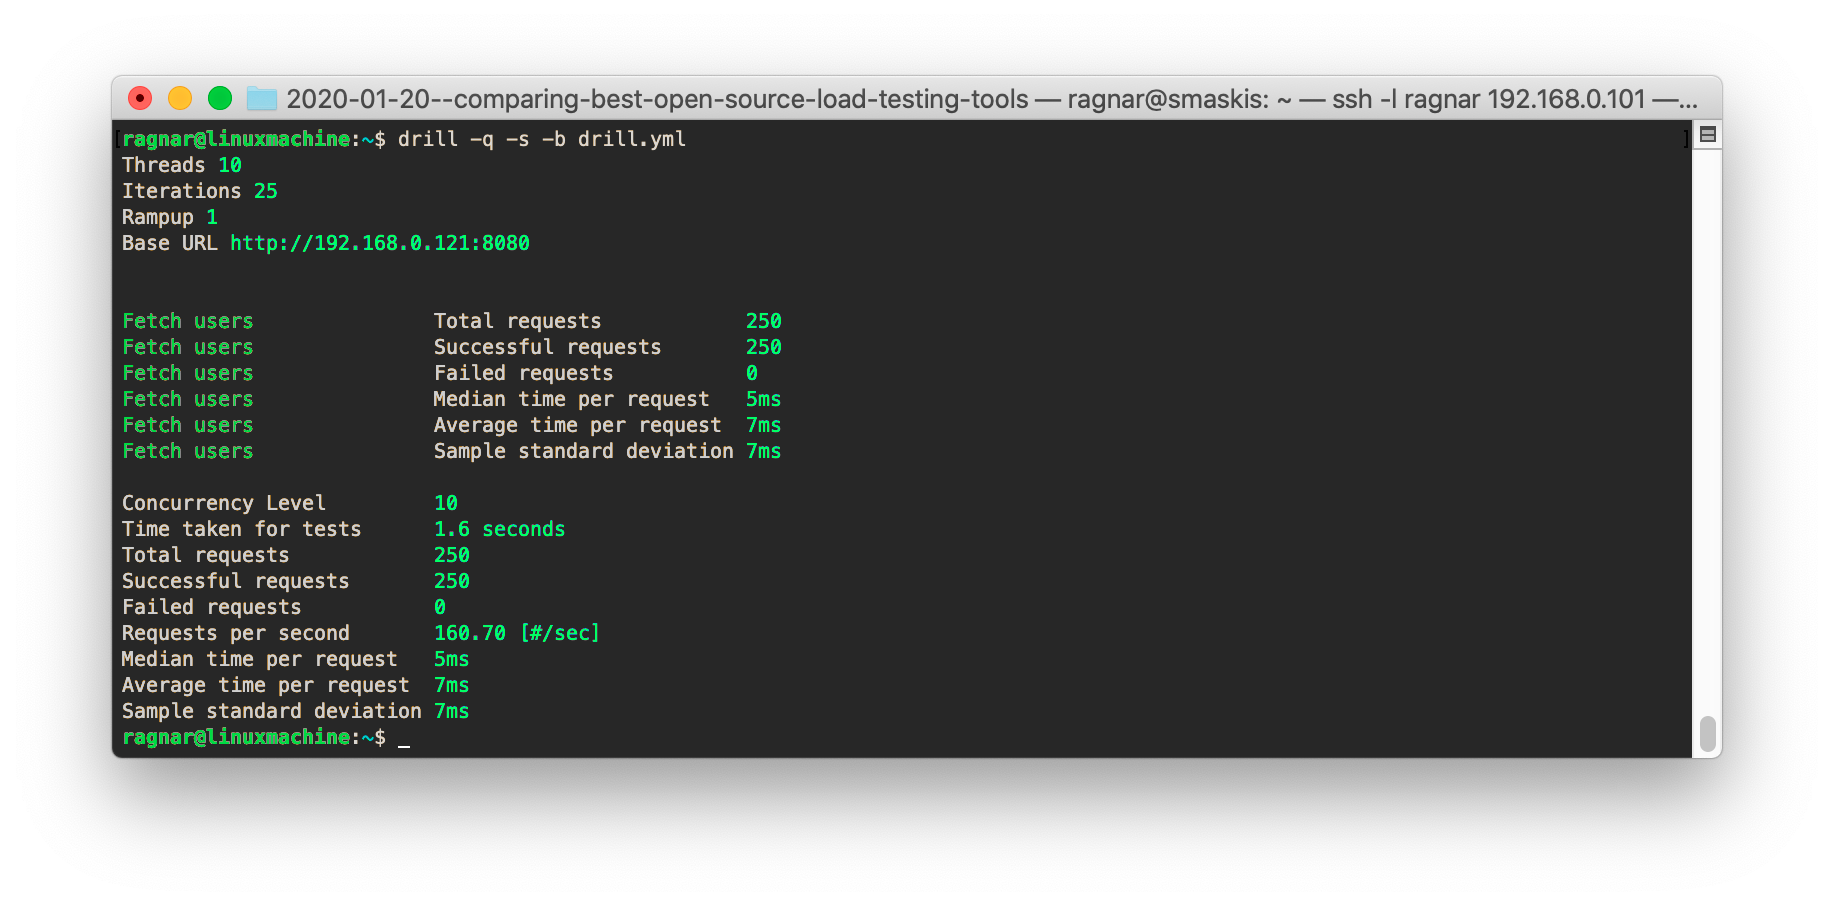
Drill is written in Rust. I’ve avoided Rust because I’m scared I may like it and I don’t want anything to come between me and Golang. But that is probably not within the scope of this article. What I meant to write was that Rust is supposed to be fast, so my assumption is that a load testing tool written in Rust would be fast too.
Running some benchmarks, however, it quickly becomes apparent that this particular tool is incredibly slow! Maybe I shouldn’t have been so quick to include Drill in the review, seeing as it is both quite new and not yet widely used. Maybe it was not meant to be a serious effort at creating a new tool, given that the author claims that Drill was created because he wanted to learn Rust? On the other hand it does have a lot of useful features, like a pretty powerful YAML-based config file format and thresholds for pass/fail results, so it does look like a semi-serious effort to me.
So, the tool seems fairly solid, if simple (no scripting). But when I run it in my test setup it maxes out four CPU cores to produce a mindbogglingly low ~180 requests/second. I ran many tests, with many different parameters, and that was the best number I could squeeze out of Drill. The CPUs are spending cycles like there is no tomorrow, but there are so few HTTP transactions coming out of this tool that I could probably respond to them using pen and paper. It’s like it is mining a Bitcoin between each HTTP request! Compare this to Wrk (written in C) that does over 50,000 RPS in the same environment and you see what I mean. Drill is not exactly a poster child for the claim that Rust is faster than C.
What is the point of using a compiled language like Rust if you get no performance out of your app?? You might as well use Python. Or no, Python-based Locust, which is much faster than this. If the aim is ~200 RPS on my particular test setup I could probably use Perl! Or, hell, maybe even a shell script??
I just had to try it. Behold the curl-basher
So this Bash script actually gives Drill a run for its money, by executing curl on the command line multiple times, concurrently. It even counts errors. With curl-basher.sh I manage to eke out 147 RPS in my test setup (a very stable 147 RPS, I have to say) and Drill does 175 RPS to 176 RPS, so it is only 20% faster. This makes me wonder what the Drill code is actually doing to manage to consume so much CPU time. It has for sure set a new bottom record for inefficiency in generating HTTP requests. If you’re concerned about global warming, don’t use Drill!
Drill summary
For tiny, short-duration load tests it could be worth considering Drill, or if the room is a bit chilly.
JMeter
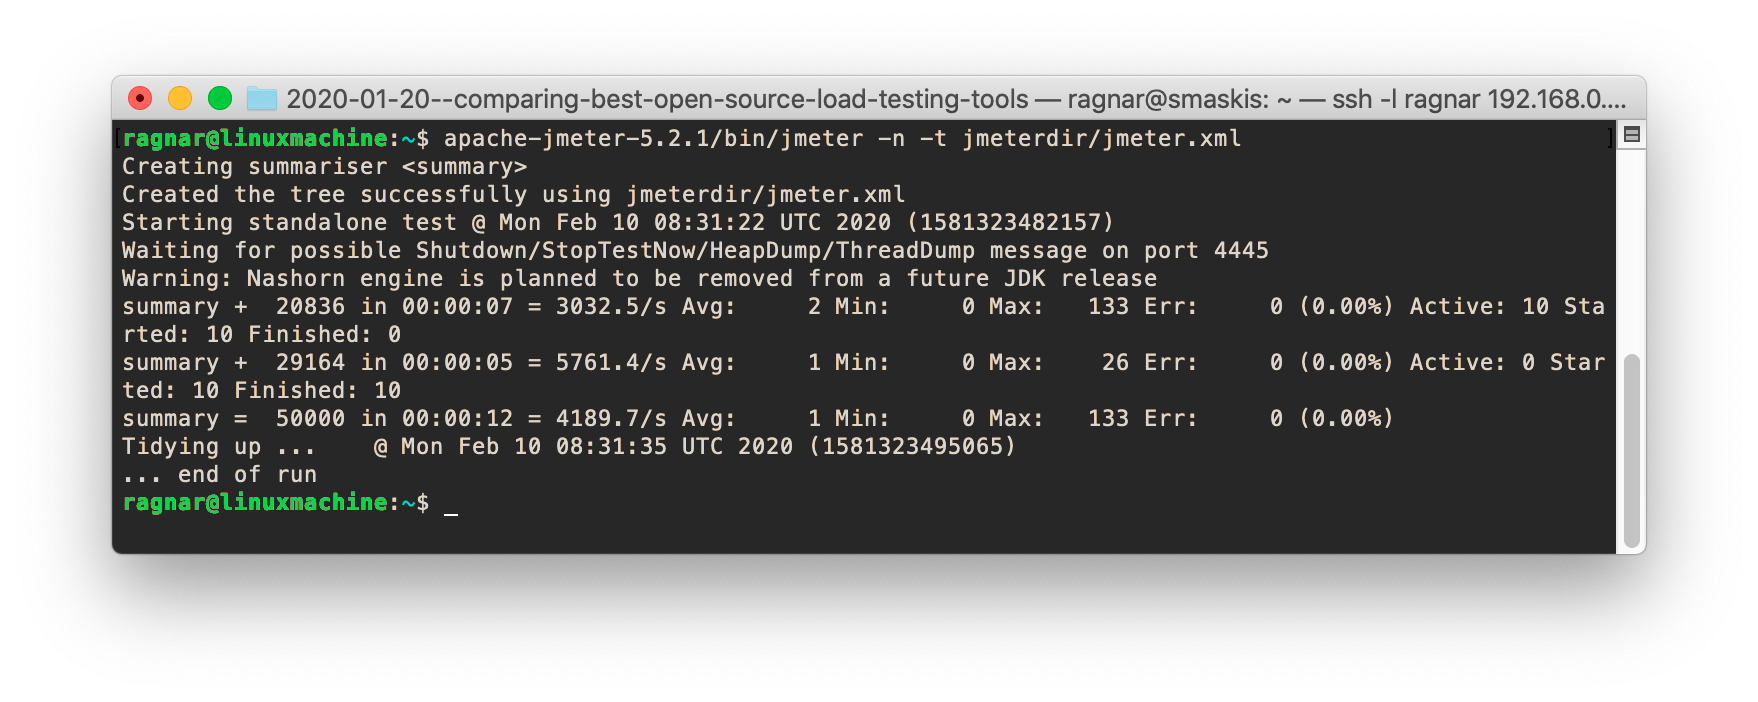
Here’s the 800-pound gorilla. JMeter is a huge beast compared to most other tools. It is old and has acquired a larger feature set and more integrations, add-ons, and plugins than any other tool in this review. It has been the “king” of open source load testing tools for a long time, and probably still is.
In the old days, people could choose between paying obscene amounts of money for an HP Loadrunner license, paying substantial amounts of money for a license of some Loadrunner-wannabe proprietary tool, or pay nothing at all to use JMeter. Well, there was also the option of using ApacheBench or maybe OpenSTA or some other best-forgotten free solution, but if you wanted to do serious load testing, JMeter was really the only usable alternative that didn’t cost money.
So the JMeter user base grew and grew, and development of JMeter also grew. Now, 15 or so years later, JMeter has been actively developed by a large community for longer than any other load testing tool, so it isn’t strange that it also has more features than any other tool.
As it was originally built as an alternative to old, proprietary load testing software from 15 to 20 years ago, it was designed to cater to the same audience as those applications. In other words, it was designed to be used by load testing experts running complex, large-scale integration load tests that took forever to plan, a long time to execute and a longer time to analyze the results from.
Tests that required a lot of manual work and very specific load testing domain knowledge. This means that JMeter was not, from the start, built for automated testing and developer use, and this can clearly be felt when using it today. It is a tool for professional testers, not for developers. It is not great for automated testing as its command line use is awkward; default results output options are limited; it uses a lot of resources; it has no real scripting capability; and it only has some support for inserting logic inside the XML configuration.
This is probably why JMeter is losing market share to newer tools like Gatling, which has a lot in common with JMeter and offers an attractive upgrade path for organizations that want to use a more modern tool with better support for scripting and automation but still want to keep their tooling Java-based.
Anyway, JMeter does have some advantages over Gatling. Primarily, it comes down to the size of the ecosystem — all those integrations and plugins I mentioned. Performance-wise, they are fairly similar. JMeter used to be one of the very best performing tools in this review, but has seen its performance drop so now it’s about average and pretty close to (perhaps slightly faster than) that of Gatling.
JMeter summary
The biggest reasons to choose JMeter today, if you’re just starting out with load testing, would be if you:
- Had a need to test lots of different protocols/apps that only JMeter had support for, or
- You’re a Java-centric organization and want to use the most common Java-based load testing tool out there, or
- You want a GUI load testing tool where you point and click to do things
If none of those are true, I think you’re better served by Gatling (which is fairly close to JMeter in many ways), k6, or Locust. Or, if you don’t care so much about programmability/scripting (writing tests as code) you can take a look at Vegeta.
Siege
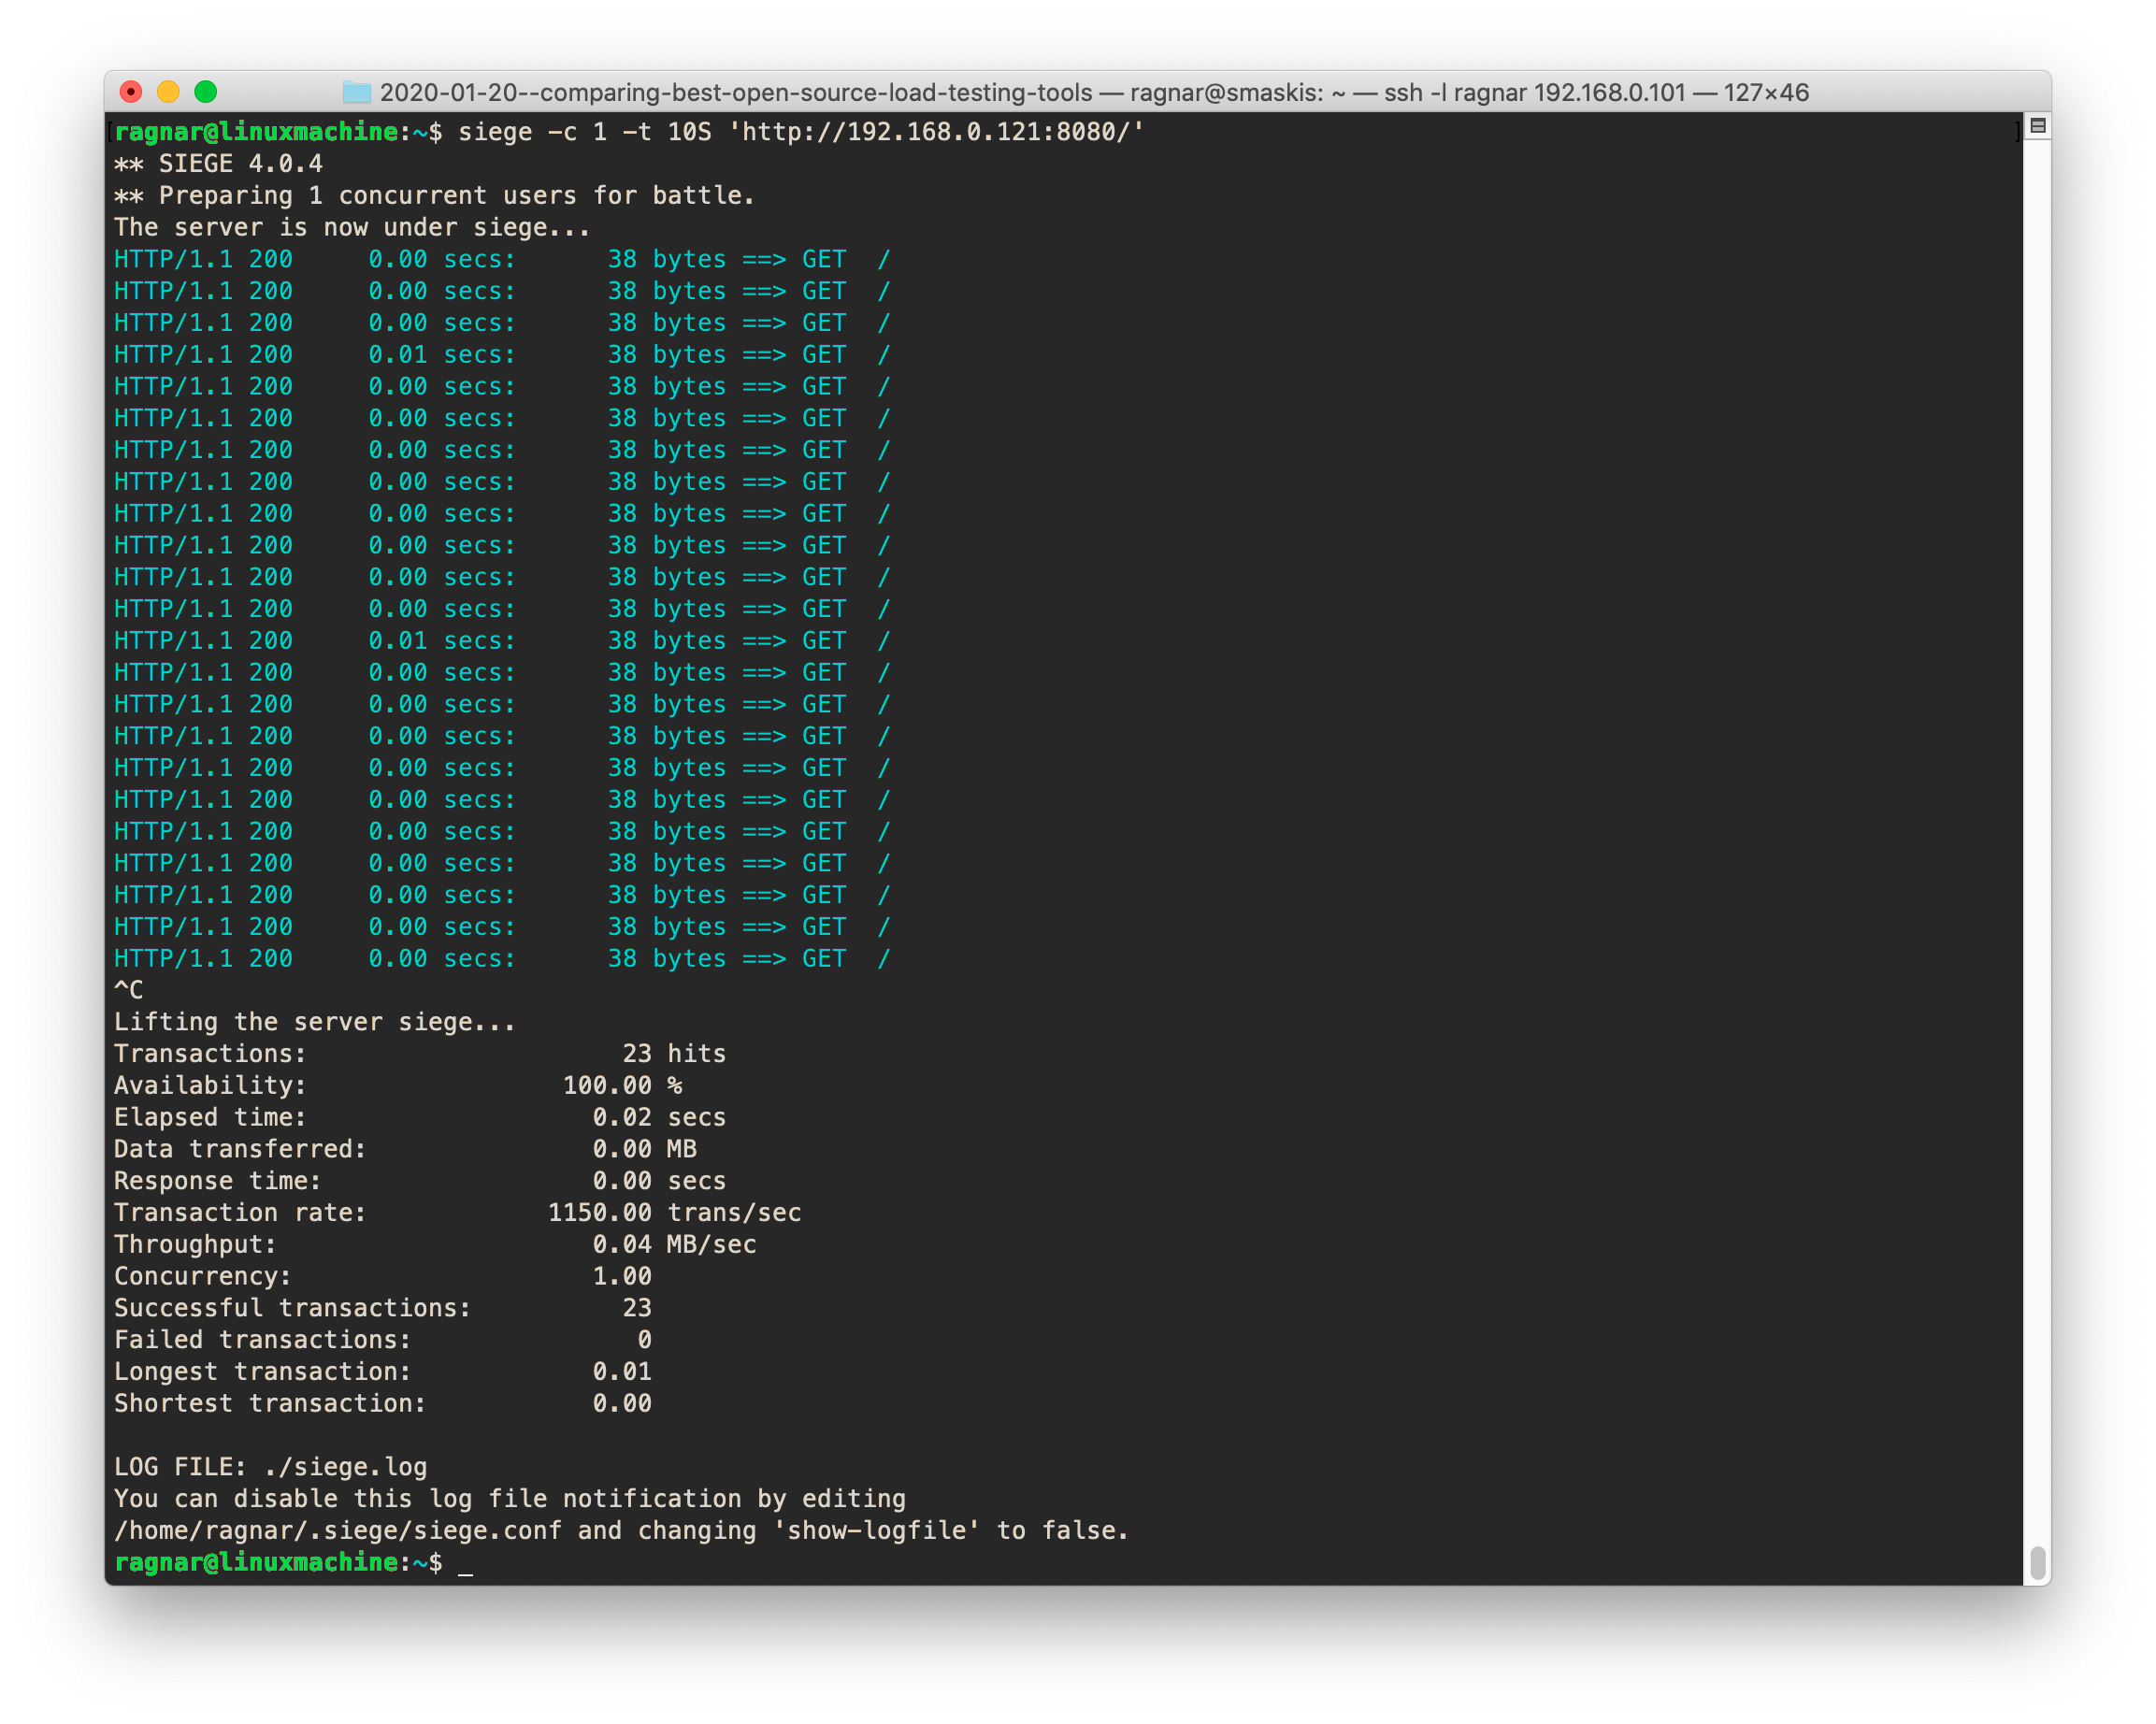
Siege is a simple tool, similar to ApacheBench in that it has no scripting and is primarily used when you want to hit a single, static URL repeatedly. The biggest feature it has that ApacheBench lacks is its ability to read a list of URLs and hit them all during the test. If you don’t need this feature, however, just use ApacheBench (or, even better, Hey).
Because Siege is bound to give you a headache if you try doing anything even slightly advanced with it, like figuring out how fast the target site is responding when you hit it with traffic, or generating enough traffic to slow down the target system, or something like that. Actually, just running it with the correct config or command line options, though they’re not too many, can feel like some kind of mystery puzzle game.
Siege is unreliable, in more than one way. Firstly, it crashes fairly often. Secondly, it freezes even more often (mainly at exit, can’t tell you how many times I’ve had to kill -9 it). If you try enabling HTTP keep-alive it crashes or freezes 25% of the time. I don’t get how HTTP keep-alive can be experimental in such an old tool! HTTP keep-alive itself is very old and part of HTTP/1.1, that was standardized 20 years ago! It is also very, very commonly used in the wild today, and it has a huge performance impact. Most every HTTP library have support for it. HTTP keep-alive keeps connections open between requests, so the connections can be reused. If you’re not able to keep connections open it means that every HTTP request results in a new TCP handshake and a new connection.
This may give you misleading response time results (because there is a TCP handshake involved in every single request, and TCP handshakes are slow) and it may also result in TCP port starvation on the target system, which means the test will stop working after a little while because all available TCP ports are in a CLOSE_WAIT state and can’t be reused for new connections.
But hey, you don’t have to enable weird, exotic, experimental, bleeding-edge stuff like HTTP keep-alive to make Siege crash. You just have to make it start a thread or two too many and it will crash or hang very quickly. And it is using smoke and mirrors to avoid mentioning that fact. It has a new limit config directive that sets a cap on the max number you can give to the -c (concurrency) command-line parameter — the one determining how many threads Siege will start. The value is set to 255 by default, with the motivation that Apache httpd by default can only handle 255 concurrent connections, so using more than that will “make a mess.”
What a load of suspicious-looking brown stuff in a cattle pasture. It so happens that during my testing, Siege seems to become unstable when you set the concurrency level to somewhere in the range 300 to 400. Over 500 and it crashes or hangs a lot. More honest would be to write in the docs that, “Sorry, we can’t seem to create more than X threads or Siege will crash. Working on it.”
Siege’s options/parameters make up an inconsistent, unintuitive patchwork and the help sometimes lies to you. I still haven’t been able to use the -l option (supposedly usable to specify a log file location) although the long form --log=x seems to work as advertised (and do what -l won’t).
Siege performs on par with Locust now (when Locust is running in distributed mode), which isn’t fantastic for a C application. Wrk is 25 times faster than Siege, offers pretty much the same feature set, provides much better measurement accuracy, and doesn’t crash. ApacheBench is also a lot faster, as is Hey. I see very few reasons for using Siege these days.
The only truly positive thing I can write is that Siege has implemented something quite clever that most tools lack — a command line switch (-C) that just reads all config data (plus command-line params) and then prints out the full config it would be using when running a load test. This is a very nice feature that more tools should have. Especially when there are multiple ways of configuring things (i.e., command-line options, config files, environment variables) it can be tricky to know exactly what config you’re actually using.
Siege summary
Run fast in any other direction.
Tsung
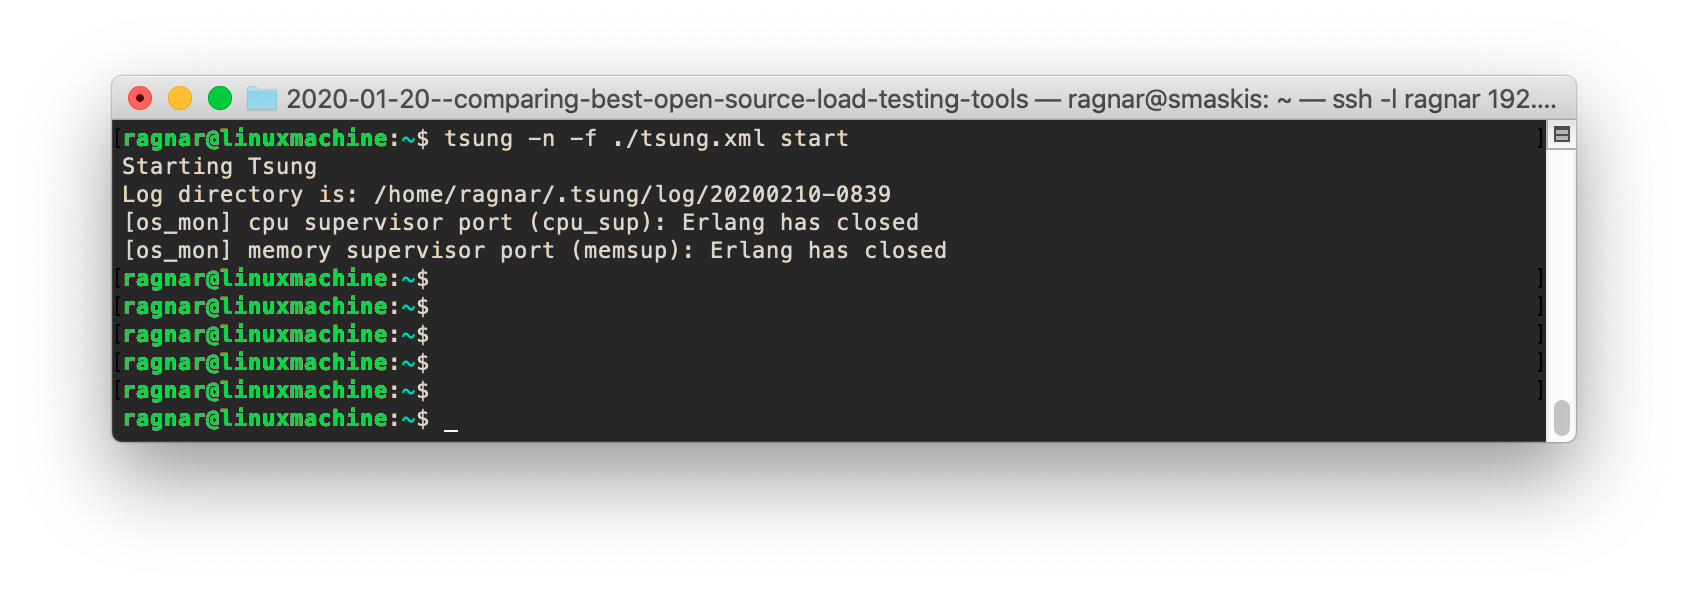
Tsung is our only Erlang-based tool and it’s been around for a while, and it seems very stable. It has with good documentation, is reasonably fast, and has a nice feature set that includes support for distributed load generation and being able to test several different protocols.
It’s a very competent tool whose main drawback, in my opinion, is the XML-based config similar to what JMeter has, and its lack of scriptability. Just like JMeter, you can actually define loops and use conditionals and stuff inside the XML config, so in practice you can script tests, but the user experience is horrible compared to using a real language like you can with k6 or Locust.
Tsung is still being developed, but very slowly. All in all I’d say that Tsung is a useful option if you need to test one of the extra protocols it supports (like LDAP, PostgreSQL, MySQL, XMPP/Jabber), where you might only have the choice between JMeter or Tsung (and of those two, I much prefer Tsung).
Tsung summary
Try it if you’re an Erlang fan.
curl-basher
Yeah, well.
Performance review and benchmarks
Load testing can be tricky because it is quite common that you run into some performance issue on the load generation side, which means you’re measuring that system’s ability to generate traffic, not the target system’s ability to handle it. Even very seasoned load testing professionals regularly fall into this trap.
If you don’t have enough load generation power, you may either see that your load test becomes unable to go above a certain number of requests per second, or you may see that response time measurements become completely unreliable. Usually you’ll see both things happening, but you might not know why and mistakenly blame the poor target system for the bad and/or erratic performance you’re seeing.
Then you might either try to optimize your already-optimized code (because your code is fast, of course) or you’ll yell at some poor coworker who has zero lines of code in the hot paths but it was the only low-performing code you could find in the whole repo. Then the coworker gets resentful and steals your mouse pad to get even, which starts a war in the office and before you know it, the whole company is out of business and you have to go look for a new job at Oracle. What a waste, when all you had to do was make sure your load generation system was up to its task!
This is why I think it is very interesting to understand how load testing tools perform. I think everyone who use a load testing tool should have some basic knowledge of its strengths and weaknesses when it comes to performance, and also occasionally make sure that their load testing setup is able to generate the amount of traffic required to properly load the target system, plus a healthy margin.
Testing the testing tools
A good way of testing the testing tools is to not test them on your code, but on some third-party thing that is sure to be very high-performing. I usually fire up an NGINX server and then I load test by fetching the default “Welcome to NGINX” page. It’s important, though, to use a tool like top to keep track of NGINX CPU usage while testing. If you see just one process, and see it using close to 100% CPU, it means you could be CPU-bound on the target side. Then you need to reconfigure NGINX to use more worker threads.
If you see multiple NGINX processes but only one is using a lot of CPU, it means your load testing tool is only talking to that particular worker process. Then you need to figure out how to make the tool open multiple TCP connections and issue requests in parallell over them.
Network delay is also important to take into account as it sets an upper limit on the number of requests per second you can push through. If the network roundtrip time is 1 ms between Server A (where you run your load testing tool) and Server B (where the NGINX server is) and you only use one TCP connection to send requests, the theoretical max you will be able to achieve is 1/0.001 = 1,000 requests per second. In most cases this means that you’ll want your load testing tool to use many TCP connections.
Whenever you’re hitting a limit, and can’t seem to push through any more requests/second, you try to find out what resource you’ve run out of. Monitor CPU and memory usage on both load generation and target sides with some tool like top.
If CPU is fine on both sides, experiment with the number of concurrent network connections and see if more will help you increase RPS throughput.
Another thing that is easily missed is network bandwidth. If, say, the NGINX default page requires a transfer of 250 bytes to load, it means that if the servers are connected via a 100 Mbit/s link, the theoretical max RPS rate would be around 100,000,000 divided by 8 (bits per byte) divided by 250 => 100M/2000 = 50,000 RPS. Though that is a very optimistic calculation, protocol overhead will make the actual number a lot lower so in the case above I would start to get worried bandwidth was an issue if I saw I could push through max 30,000 RPS, or something like that. And of course, if you happen to be loading some bigger resource, like an image file, this theoretical max RPS number can be a lot lower. If you’re suspicious, try making changes to the size of the file you’re loading and see if it changes the result. If you double the size and get half the RPS you know you’re bandwidth limited.
Finally, server memory can also be an issue. Usually, when you run out of memory it will be very noticeable because most things will just stop working while the OS frantically tries to destroy the secondary storage by using it as RAM (i.e., swapping or thrashing).
After some experimentation you’ll know exactly what to do to get the highest RPS number out of your load testing tool, and you’ll know what its max traffic generation capacity is on the current hardware. When you know these things you can start testing the real system that you’d like to test, and be confident that whenever you see, for example, an API endpoint that can’t do more than X requests/second, you’ll immediately know that it is due to something on the target side of things, not the load generator side.
These benchmarks
The above procedure is more or less what I have gone through when testing these tools. I used a small, fanless, 4-core Celeron server running Ubuntu 18.04 with 8GB RAM as the load generator machine. I wanted something that was multi-core but not too powerful. It was important that the target/sink system could handle more traffic than the load generator was able to generate (or I wouldn’t be benchmarking the load generation side).
For target, I used a 4Ghz i7 iMac with 16G RAM. I did use the same machine as work machine, running some terminal windows on it and having a Google spreadsheet open in a browser, but I made sure nothing demanding was happening while tests were running. As this machine has four very fast cores with hyperthreading (able to run eight things in parallell) there should be capacity to spare, but to be on the safe side I have repeated all tests multiple times at different points in time, just to verify that the results are somewhat stable.
The machines were connected to the same physical LAN switch, via gigabit Ethernet.
Practical tests showed that the target was powerful enough to test all tools but perhaps one. Wrk managed to push through over 50,000 RPS and that made eight NGINX workers on the target system consume about 600% CPU. It may be that NGINX couldn’t get much more CPU than that (given that 800% usage should be the absolute theoretical max on the four-core i7 with hyperthreading) but I think it doesn’t matter because Wrk is in a class of its own when it comes to traffic generation.
We don’t really have to find out whether Wrk is 200 times faster than Artillery or only 150 times faster. The important thing is to show that the target system can handle some very high RPS number that most tools can’t achieve, because then we know we actually are testing the load generation side and not the target system.
Raw data
There is a spreadsheet with the raw data, plus text comments, from all the tests run. More tests than these in the spreadsheet were run though. For instance, I ran a lot of tests to find out the ideal parameters to use for the “Max RPS” tests. The goal was to cram out as many RPS as was inhumanly possible, from each tool, and for that some exploratory testing was required.
Also, whenever I felt a need to ensure results seemed stable, I’d run a set of tests again and compare to what I had recorded. I’m happy to say there was usually very little fluctuation in the results. Once I did have an issue with all tests suddenly producing performance numbers that were notably lower than they were before. This happened regardless of which tool was being used and eventually led me to reboot the load generator machine, which resolved the issue.
The raw data from the tests can be found here.
What I’ve tried to find out
Max traffic generation capability
How many requests per second could each tool generate in this lab setup? Here I tried working with most parameters available, but primarily concurrence (how many threads the tool used, and how many TCP connections) and things like enabling HTTP keep-alive and disabling things the tool did that required lots of CPU (HTML parsing maybe). The goal was to churn out as many requests per second out of each tool as possible, AT ANY COST!!
The idea is to get some kind of baseline for each tool that shows how efficient the tool is when it comes to raw traffic generation.
Memory usage per VU
Several of the tools are quite memory-hungry and sometimes memory usage is also dependent on the size of the test, in terms of VUs. High memory usage per VU can prevent people from running large-scale tests using the tool, so I think it is an interesting performance metric to measure.
Memory usage per request
Some tools collect lots of statistics throughout the load test. Primarily when HTTP requests are being made, it is common to store various transaction time metrics. Depending on exactly what is stored and how, this can consume large amounts of memory and be a problem for intensive or long-running tests.
Measurement accuracy
All tools measure and report transaction response times during a load test. There will always be a certain degree of inaccuracy in these measurements, for several reasons, but it is common to see quite large amounts of extra delay being added to response time measurements, especially when the load generator itself is doing a bit of work. It is useful to know when you can trust the response time measurements reported by your load testing tool and when you can’t, and I have tried to figure this out for each of the different tools.
Max traffic generation capability
Here is a chart showing the max RPS numbers I could get out of each tool when I really pulled out all the stops, and their memory usage:
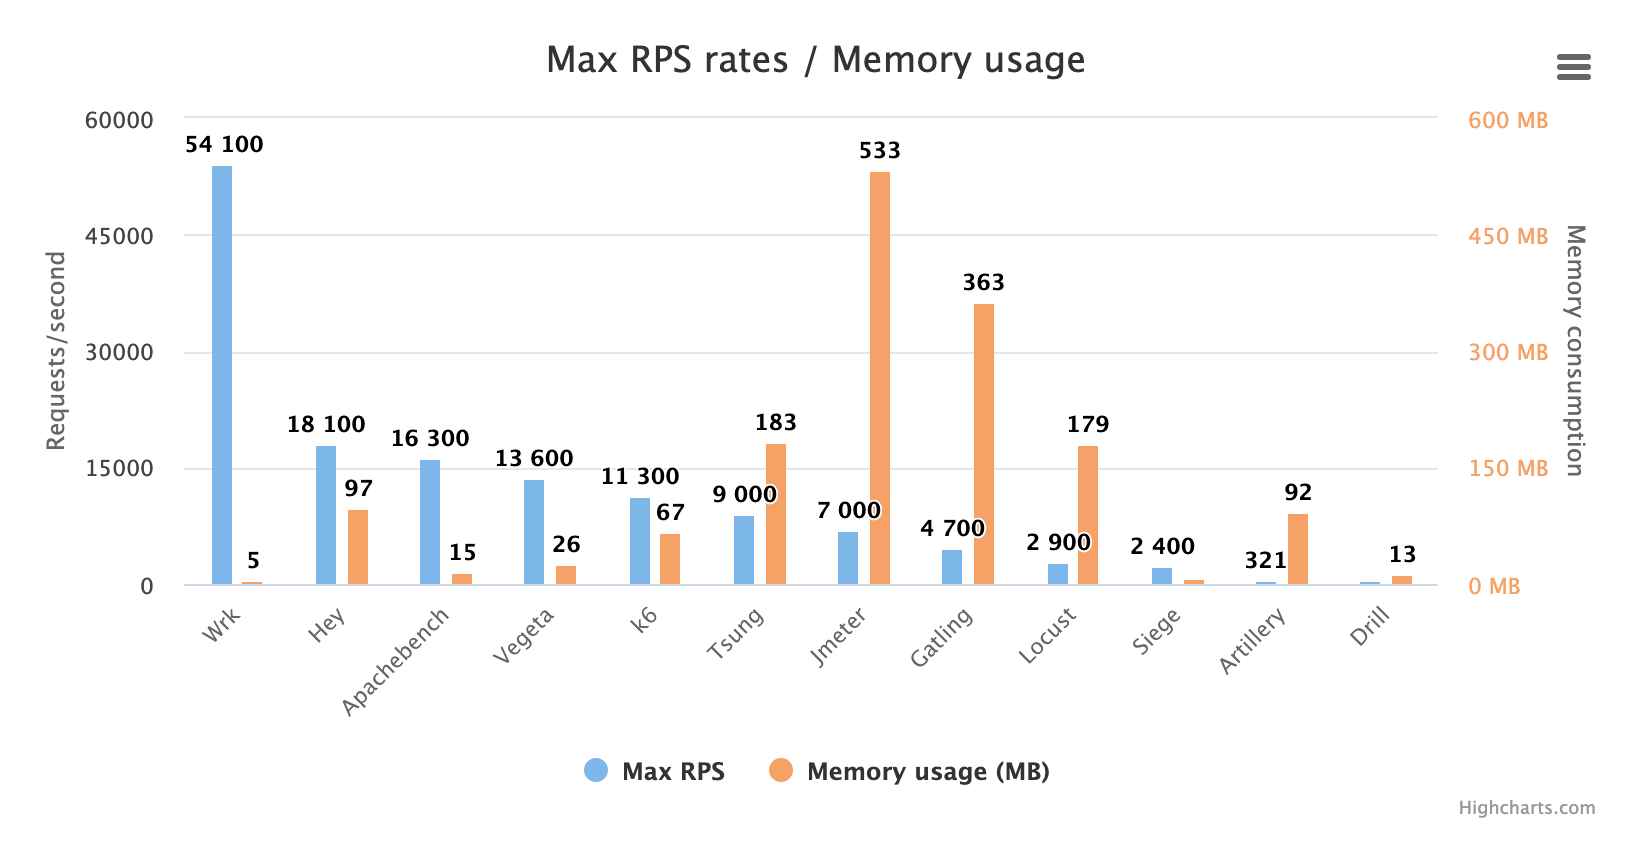
It’s pretty obvious that Wrk has no real competition here. It is a beast when it comes to generating traffic, so if that is all you want — large amounts of HTTP requests — download (and compile) Wrk. You won’t be displeased!
But while being a terrific request generator, Wrk is definitely not perfect for all uses, so it’s interesting to see what’s up with the other tools. Let’s remove Wrk from the chart to get a better scale:
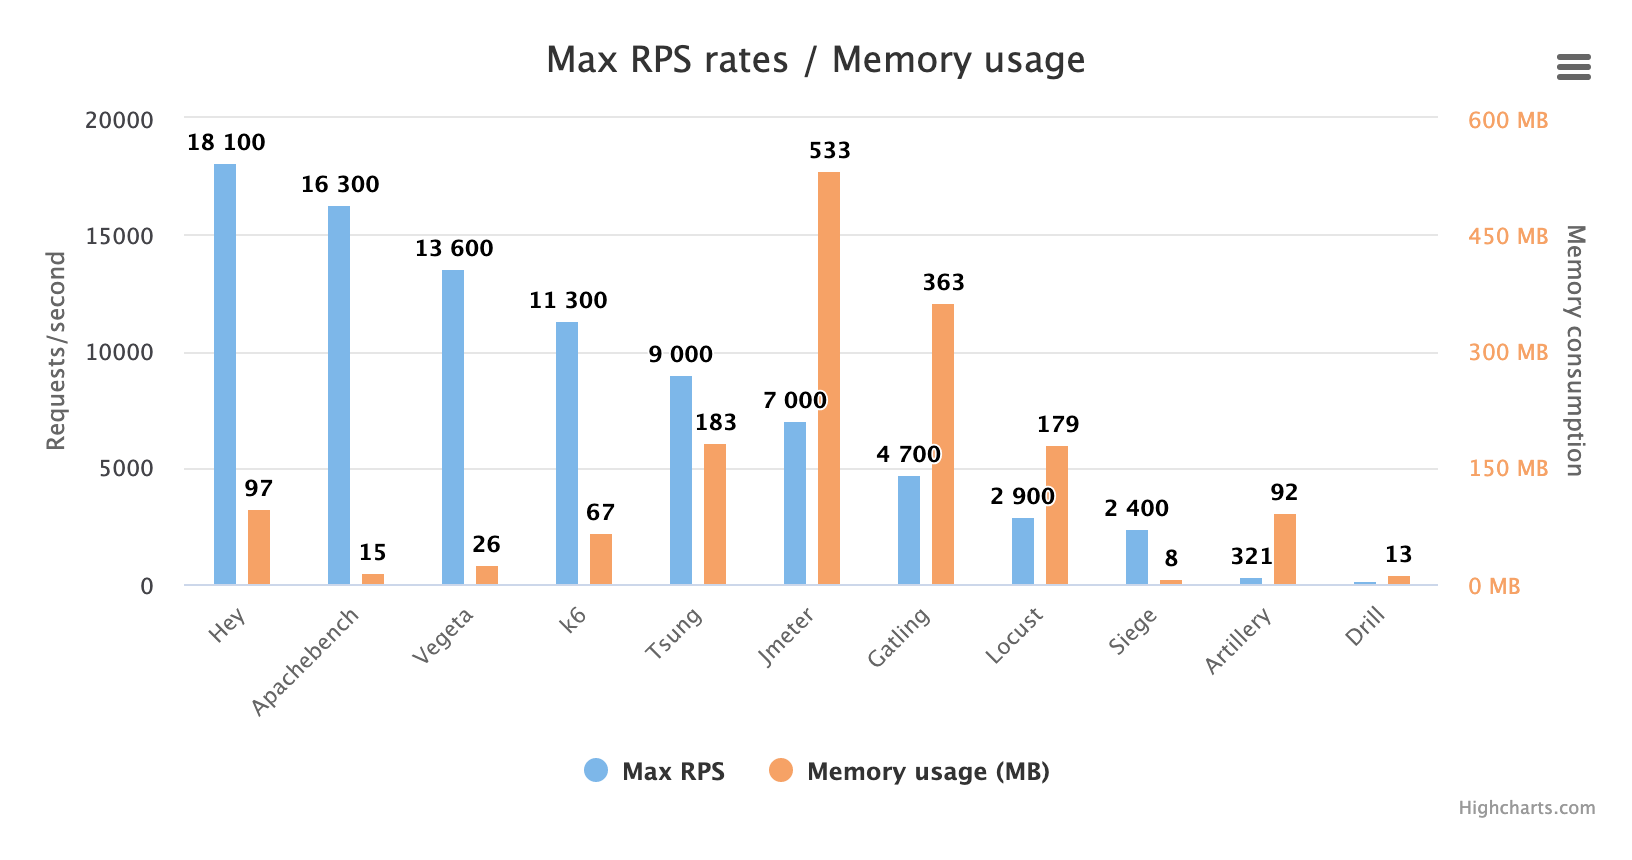
Before discussing these results, I’d like to mention that three tools were run in non-default modes in order to generate the highest possible RPS numbers:
Artillery
Artillery was run with a concurrency setting high enough to cause it to use up a full CPU core, which is not recommended by the Artillery developers and results in high-CPU warnings from Artillery. I found that using up a full CPU core increased the request rate substantially, from just over 100 RPS when running the CPU at ~80% to 300 RPS when at 100% CPU usage. The RPS number is still abysmally low, of course, and like we also see in the response time accuracy tests, response time measurements are likely to be pretty much unusable when Artillery is made to use all of one CPU core.
k6
k6 was run with the --compatibility-mode=base command line option that disables newer JavaScript features, stranding you with old ES5 for your scripting. It results in a ~50% reduction in memory usage and a ~10% general speedup, which means that the max RPS rate goes up from ~10k to ~11k. Not a huge difference though, and I’d say that unless you have a memory problem it’s not worth using this mode when running k6.
Locust
Locust was run in distributed mode, which means that five Locust instances were started: one master instance and four slave instances (one slave for each CPU core). Locust is single-threaded so can’t use more than one CPU core, which means that you have to distribute load generation over multiple processes to fully use all the CPU on a multi-CPU server. (They should really integrate the master/slave mode into the app itself so it auto-detects when a machine has multiple CPUs and starts multiple processes by default.) If I had run Locust in just one instance it would only have been able to generate ~900 RPS.
We also used the new FastHttpLocust library for the Locust tests. This library is three to five times faster than the old HttpLocust library. However, using it means you lose some functionality that HttpLocust has but FastHttpLocust doesn’t.
What has changed since 2017?
I have to say these results made me a bit confused at first, because I tested most of these tools in 2017 and expected performance to be pretty much the same now. The absolute RPS numbers aren’t comparable to my previous tests of course, because I used another test setup then, but I expected the relationships between the tools to stay roughly the same. For example, I thought JMeter would still be one of the fastest tools, and I thought Artillery would still be faster than Locust when run on a single CPU core.
JMeter is slower!
Well, as you can see, JMeter performance seems pretty average now. From my testing it seems JMeter has dropped in performance by about 50% between versions 2.3 and the one I tested now - 5.2.1. It could be a JVM issue maybe. I tested with OpenJDK 11.0.5 and Oracle Java 13.0.1 and both performed pretty much the same, so it seems unlikely it is due to a slower JVM. I also tried upping the -Xms and -Xmx parameters that determine how much memory the JVM can allocate, but that didn’t affect performance either.
Artillery is now glacially slow, and Locust is almost decent!
As for Artillery, it also seems to be about 50% slower now than two years ago, which means it is now as slow as Locust was two years ago when I whined endlessly about how slow that tool was. And Locust? It is the single tool that has substantially improved performance since 2017. It is now about three times faster than it was back then, thanks to its new FastHttpLocust HTTP library. It does mean losing a little functionality offered by the old HttpLocust library (which is based on the very user-friendly Python Requests library), but the performance gain was really good for Locust I think.
Siege is slower!
Siege wasn’t a very fast tool two years ago, though written in C, but somehow its performance seems to have dropped further between version 4.0.3 and 4.0.4 so that now it is slower than Python-based Locust when the latter is run in distributed mode and can use all CPU cores on a single machine.
Drill is very, very slow
Drill is written in Rust, so it should be pretty fast, and it makes good use of all CPU cores, which are kept very busy during the test. No one knows what those cores are doing, however, because Drill only manages to produce an incredibly measly 176 RPS! That is about on par with Artillery, but Artillery only uses one CPU core while Drill uses four! I wanted to see if a shellscript could generate as much traffic as Drill. The answer was “Yeah, pretty much.” You can try it yourself: curl-basher
Vegeta can finally be benchmarked, and it isn’t bad!
Vegeta used to offer no way of controlling concurrency, which made it hard to compare against other tools so in 2017 I did not include it in the benchmark tests. Now, though, it has gotten a -max-workers switch that can be used to limit concurrency and which, together with -rate=0 (unlimited rate), allows me to test it with the same concurrency levels as used for other tools. We can see that Vegeta is quite performant; it both generates lots of traffic and uses little memory.
Summarizing traffic generation capability
The rest of the tools offer roughly the same performance as they did in 2017.
I’d say that if you need to generate huge amounts of traffic you might be better served by one of the tools on the left side of the chart, as they are more efficient, but most of the time it is probably more than enough to be able to generate a couple of thousand requests/second, and that is something Gatling or Siege can do, or a distributed Locust setup.
However, I’d recommend against Artillery or Drill unless you’re a masochist or want an extra challenge. It will be tricky to generate enough traffic with those, and also tricky to interpret results (at least from Artillery) when measurements get skewed because you have to use up every ounce of CPU on your load generator(s).
Memory usage
What about memory usage then? Let’s pull up that chart again:

The big memory hogs are Tsung, JMeter, Gatling, and Locust. Especially our dear Java apps — JMeter and Gatling — really enjoy their memory and want lots of it. Locust wouldn’t be so bad if it didn’t have to run in multiple processes (because it is single-threaded), which consumes more memory. A multithreaded app can share memory between threads, but multiple processes are forced to keep identical sets of a lot process data.
These numbers give an indication about how memory-hungry the tools are, but they don’t show the whole truth. After all, what is 500 MB today? Hardly any servers come without a couple of gigabytes of RAM, so 500 MB should never be much of an issue. The problem is, however, if memory usage grows when you scale up your tests. Two things tend to make memory usage grow:
- Long running tests that collect a lot of results data
- Ramping up the number of VUs / execution threads
To investigate these things I ran two suites of tests to measure “Memory usage per VU” and “Memory usage per request.” I didn’t actually try to calculate the exact memory use per VU or request, but I ran tests with increasing amounts of requests and VUs, and recorded memory usage.
Memory usage per VU level
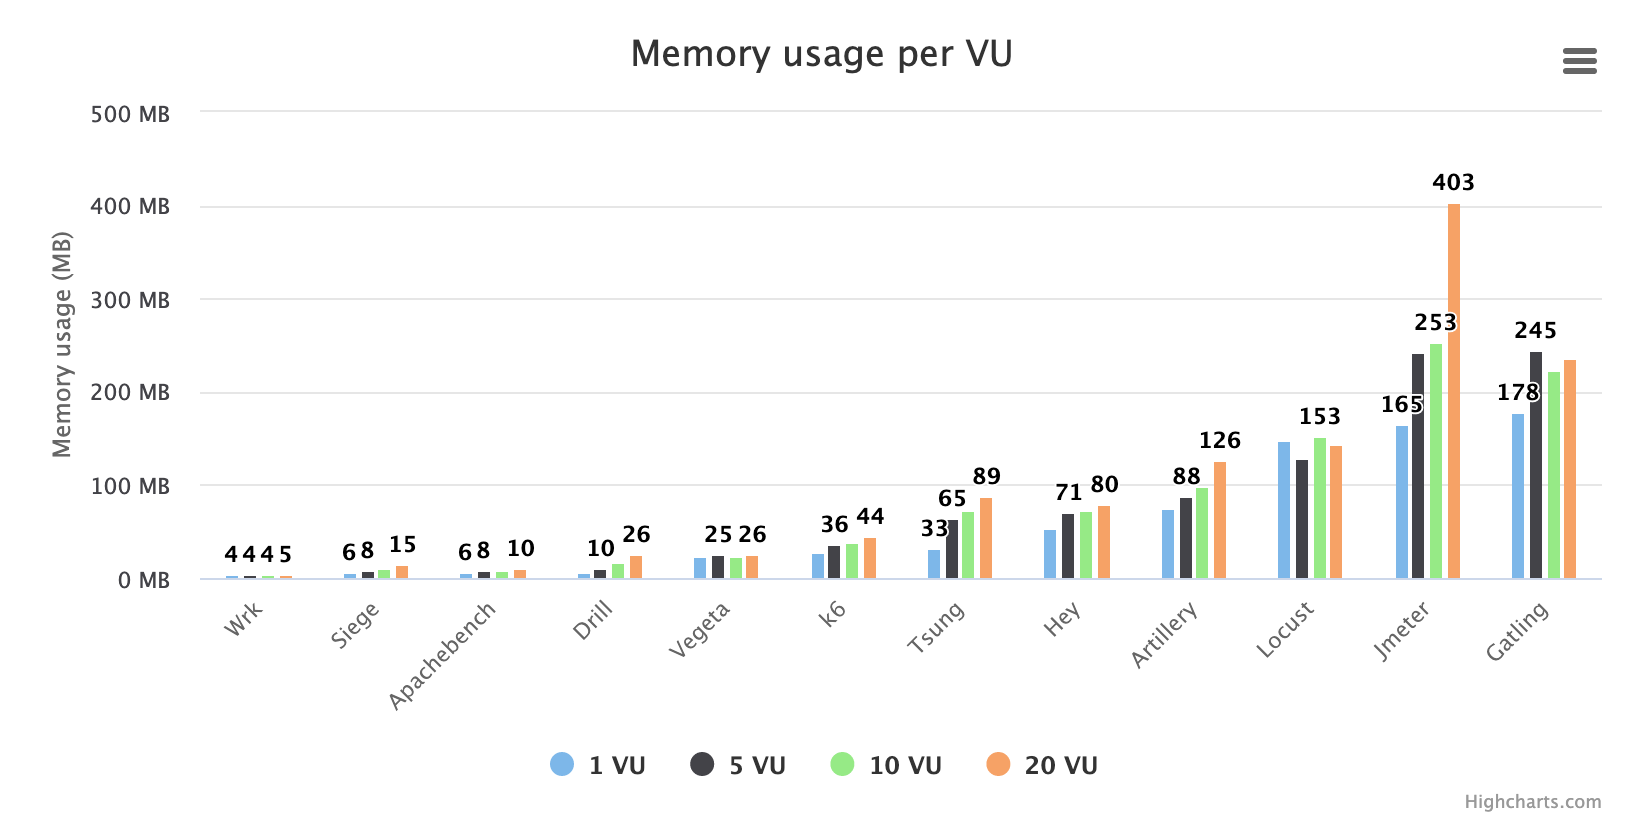
Here we can see what happens as you scale up the number of VUs. Note that the numbers shown are average memory use throughout a very short (10 second) test. Samples have been taken every second during the test, so nine to 10 samples typically. This test should really be done with more VUs, maybe going from 1 VU to 200 VU or something, and have the VUs not do so much so you don’t get too much results data. Then you’d really see how the tools “scale” when you’re trying to simulate more users.
But we can see some things here. A couple of tools seem unaffected when we change the VU number, which indicates that either they’re not using a lot of extra memory per VU, or they’re allocating memory in chunks and we haven’t configured enough VUs in this test to force them to allocate more memory than they started out with. You can also see that with a tool like JMeter it’s not unlikely that memory could become a problem as you try to scale up your tests. Tsung and Artillery also look like they may end up using a ton of memory if you try to scale up the VU level substantially from these very low levels.
Memory usage per request volume
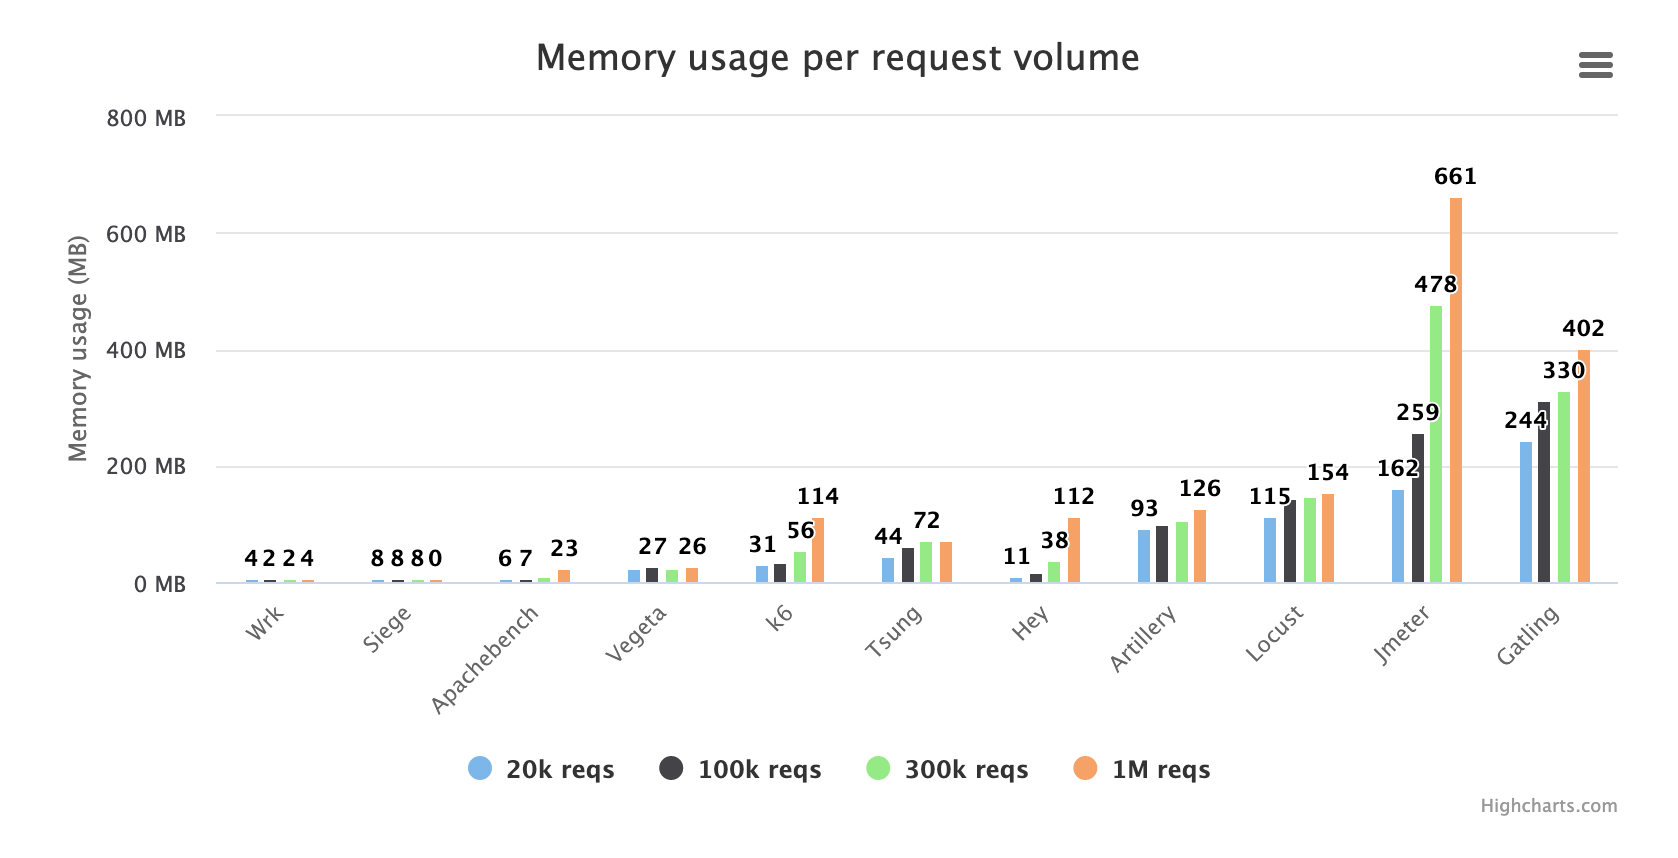
For this test, I ran all the tools with the same concurrency parameters but different test durations. The idea was to make the tools collect lots of results data and see how much memory usage grew over time. The plot shows how much the memory usage of each tool changes when it goes from storing 20,000 transaction results to 1 million results.
As we can see, Wrk doesn’t really use any memory to speak of. Then again, it doesn’t store much results data either of course. Siege also seems quite frugal with memory, but we failed to test with 1 million transactions because Siege aborted the test before we could reach 1 million. Not totally unexpected as Siege only sends one request per TCP socket - then it closes the socket and opens a new one for next request. This starves the system of available local TCP ports. You can probably expect any larger or longer test to fail if you’re using Siege.
Tsung and Artillery seems to grow their memory usage, but not terribly fast, as the test runs on. k6 and Hey have much steeper curves and there you could eventually run into trouble, for very long running tests.
Again, the huge memory hogs are the Java apps: JMeter and Gatling. JMeter goes from 160 MB to 660 MB when it has executed 1 million requests. And note that this is average memory usage throughout the whole test. The actual memory usage at the end of the test might be twice that. Of course, it may be that the JVM is just not garbage collecting at all until it feels it is necessary — not sure how that works. If that’s the case, however, it would be interesting to see what happens to performance if the JVM actually has to do some pretty big garbage collection at some point during the test. Something for someone to investigate further.
Oh and Drill got excluded from these tests. It just took way too much time to generate 1 million transactions using Drill. My kids would grow up while the test was running.
Measurement accuracy
Sometimes, when you run a load test and expose the target system to lots of traffic, the target system will start to generate errors. Transactions will fail, and the service the target system was supposed to provide will not be available anymore, to some (or all) users.
However, this is usually not what happens first. The first bad thing that tends to happen when a system is put under heavy load is that it slows down. Or, perhaps more accurately, things get queued and service to the users gets slowed down. The transactions will not complete as fast as before. This generally results in a worse user experience, even if the service is still operational. In cases when this performance degradation is small, users will be slightly less happy with the service, which means more users bounce, churn, or just don’t use the services offered. In cases where performance degradation is severe, the effects can be a more or less total loss of revenue for an e-commerce site.
This means that it is very interesting to measure transaction response times. You want to make sure they’re within acceptable limits at the expected traffic levels, and keep track of them so they don’t regress as new code is added to your system.
All load testing tools try to measure transaction response times during a load test, and provide you with statistics about them. However, there will always be a measurement error. Usually in the form of an addition to the actual response time a real client would experience. Or, put another way, the load testing tool will generally report worse response times than what a real client would see.
Exactly how large this error is depends on resource utilisation on the load generator side. For example, if your load generator machine is using 100% of its CPU, you can bet that the response time measurements will be pretty wonky. But it also varies quite a lot between tools — one tool may exhibit much lower measurement errors overall than another tool.
As a user I’d like the error to be as small as possible because if it is big it may mask the response time regressions that I’m looking for, making them harder to find. Also, it may mislead me into thinking my system isn’t responding fast enough to satisfy my users.
Here is a chart showing reported response times at various VU/concurrency levels, for the different tools:
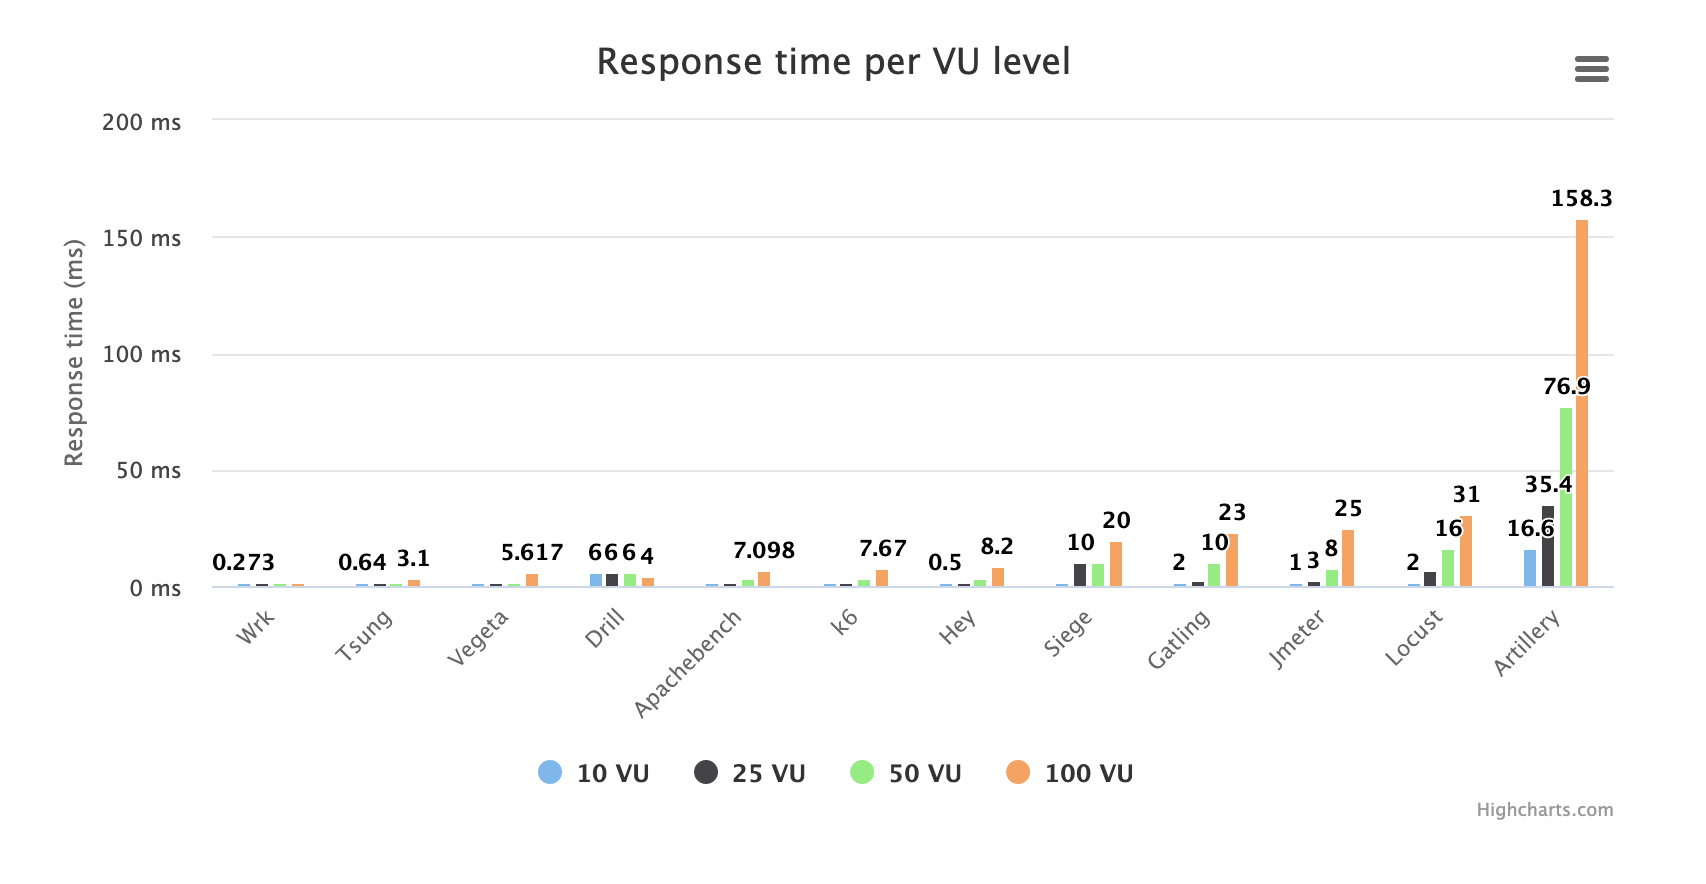
As we can see, one tool with a military-sounding name increases the scale of the chart by so much that it gets hard to compare the rest of the tools. So I’ll remove the offender, having already slammed it thoroughly elsewhere in this article. Now we get:
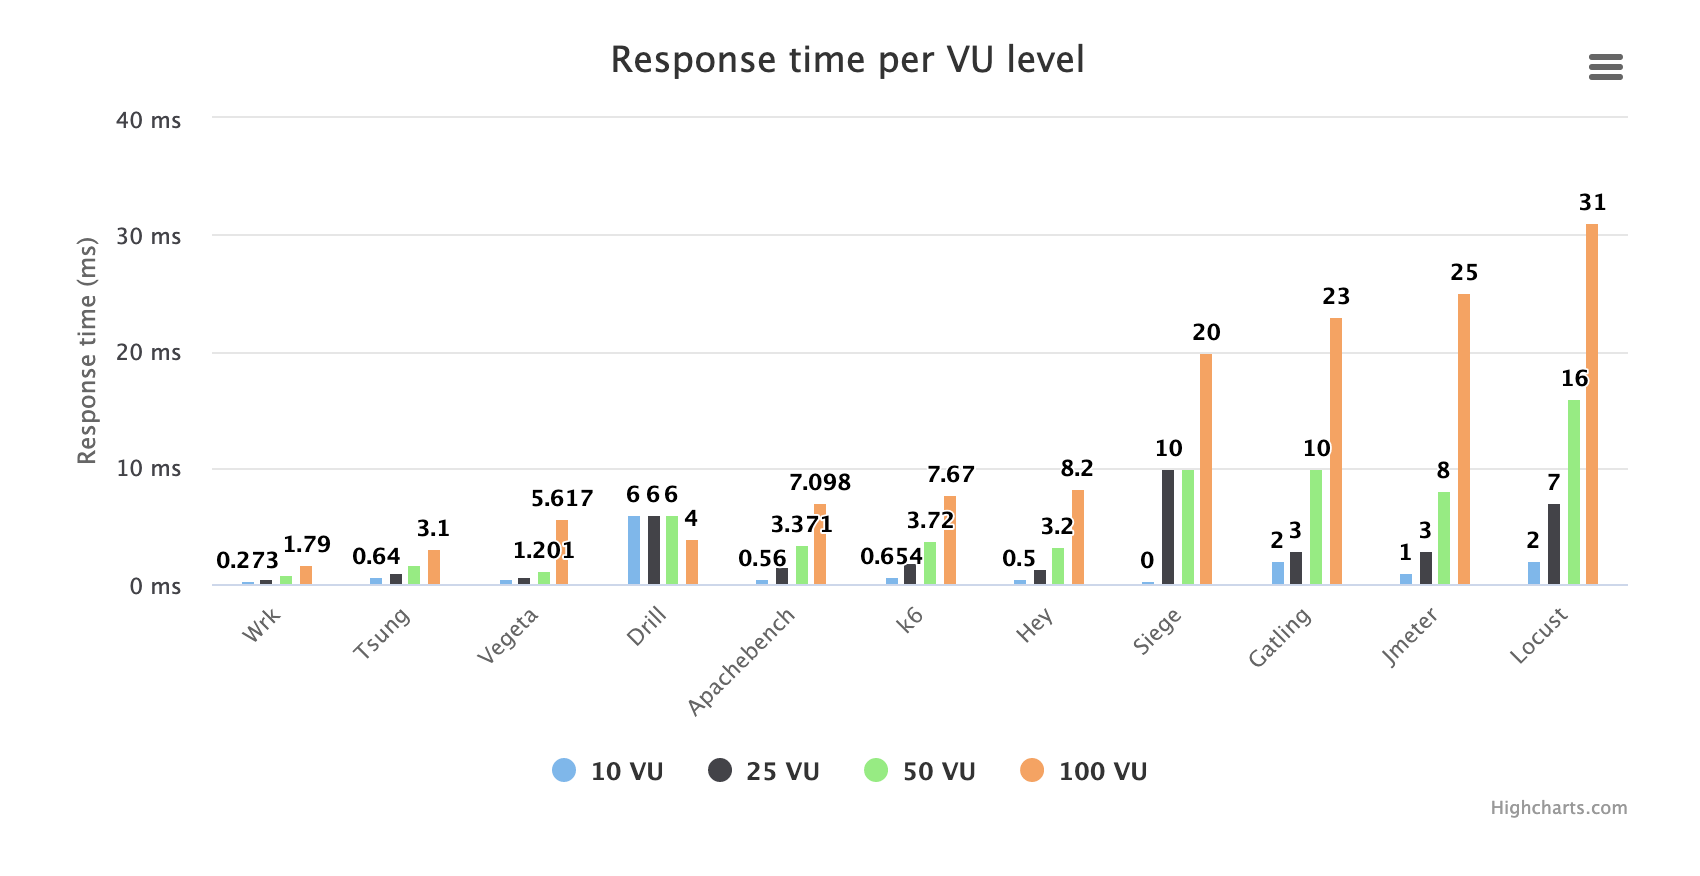
OK, that’s a bit better. So first maybe some info about what this test does. We run each tool at a set concurrency level, generating requests as fast as possible. In other words, no delay in between requests. The request rate varies, from 150 RPS to 45,000 RPS depending on which tool and which concurrency level.
If we start by looking at the most boring tool first (Wrk) we see that its MEDIAN (all these response times are medians, or 50th percentile) response time goes from ~0.25 ms to 1.79 ms as we increase the VU level from 10 to 100. This means that at a concurrency level of 100 (100 concurrent connections making requests) and 45,000 RPS (which was what Wrk achieved in this test) the real server response time is below 1.79 ms. So anything a tool reports, at this level, that is above 1.79 ms is pretty sure to be delayed by the load testing tool itself, not the target system.
Why median response times?, you may ask. Why not a higher percentile, which is often more interesting. It’s simply because it’s the only metric (apart from “max response time”) that I can get out of all the tools. One tool may report 90th and 95th percentiles, while another report 75th and 99th. Not even the mean (average) response time is reported by all tools. (I know it’s an awful metric, but it is a very common one.)
The tools in the middle of the field here report 7ms - 8 ms median response times at the 100 VU level, which is ~5-6 ms above the 1.79 ms reported by Wrk. This makes it reasonable to assume that the average tool adds about 5 ms to the reported response time, at this concurrency level. Of course, some tools (e.g., Apachebench or Hey) manage to generate a truckload of HTTP requests while still not adding so much to the response time. Others, like Artillery, only manage to generate very small amounts of HTTP requests but still add very large measurement errors while doing so. Let’s look at a chart showing the RPS number vs. median response time measurement. And remember that the server side here is likely more or less always able to give a median response time of less than 1.79 ms.
Let’s look at response times vs RPS each tool generates, as this gives an idea about how much work the tool can perform and still provide reliable measurements.
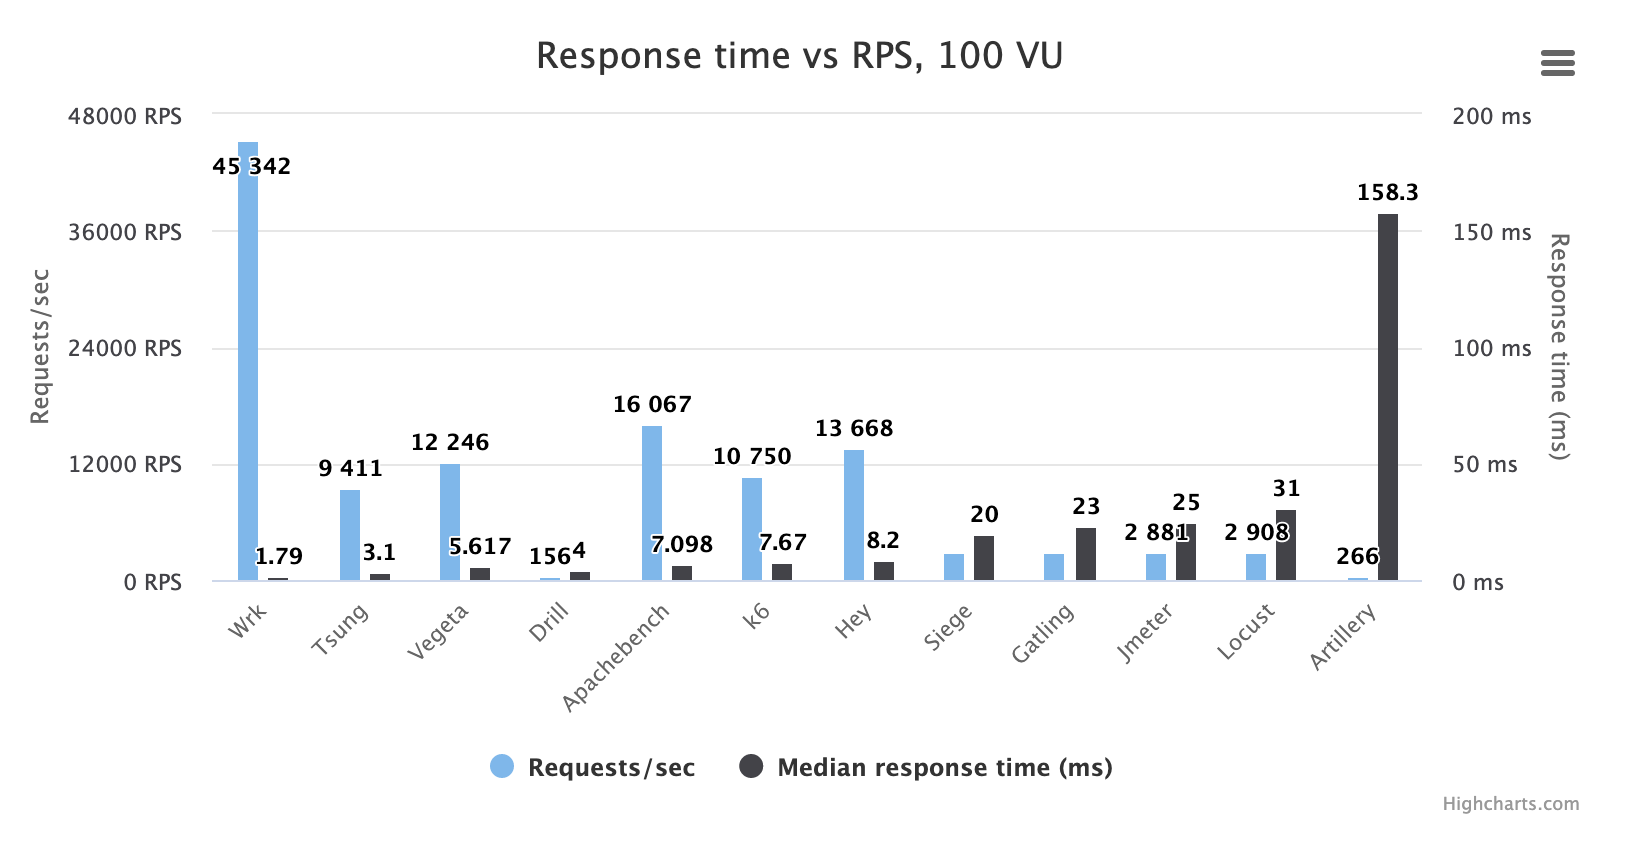
Again, Artillery is way, way behind the rest, showing a huge measurement error of roughly +150 ms while only being able to put out less than 300 requests per second. Compare that with Wrk, which outputs 150 times as much traffic while producing 1/100th of the measurement error and you’ll see how big the performance difference really is between the best and the worst performing tool.
I know Artillery people will say, “But this is just because he used up all the CPU, despite Artillery printing high-CPU warnings.” Well, I also ran a test where I slowed down Artillery so those warnings never appeared. I still used 100 concurrent visitors/users, but they each ran scripts with built-in sleeps that meant CPU usage was kept at around 80% and no warnings were printed. The RPS rate ended up being a lot worse, of course — it was 63 RPS. The response time measurement? 43.4 ms. More than +40 ms error.
So even when Artillery is being run “correctly” and producing an astonishing 63 RPS, it still adds a measurement error that is 20 times bigger than that which Wrk adds, when Wrk is producing close to 1,000 times as much traffic. I haven’t tested it, but I wouldn’t be surprised if curl-basher did better than Artillery in this category.
Let’s remove Artillery from the chart again:
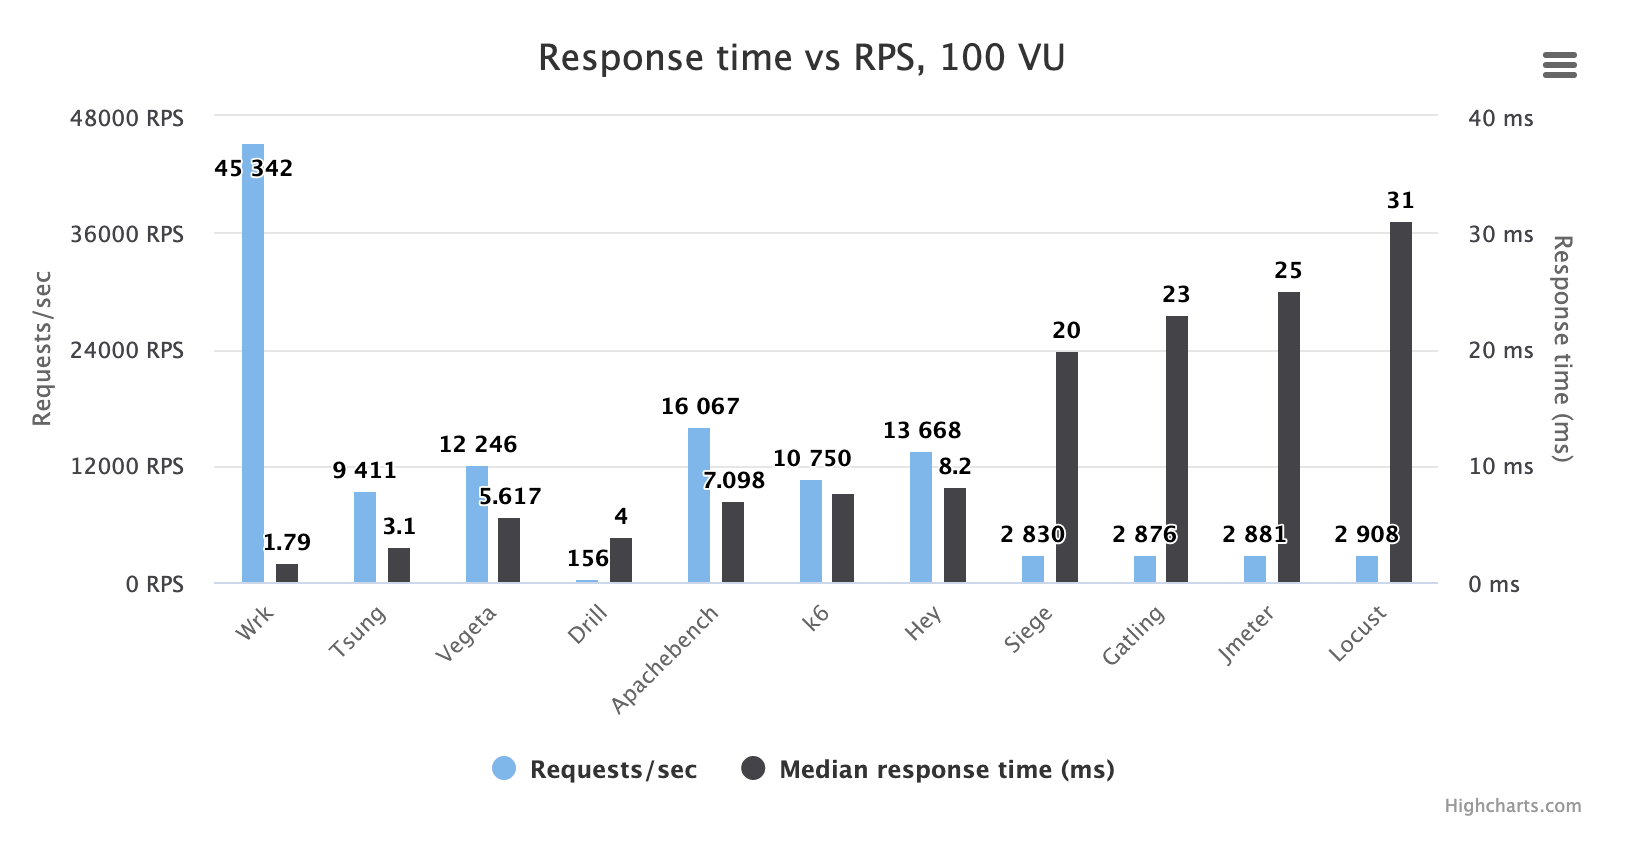
It’s interesting to see the four tools that have the highest measurement errors (excluding Artillery) perform quite similarly here: Siege, Gatling, JMeter, and Locust. They all do just under 3,000 RPS on my setup when simulating 100 VU, and they all seem to add similar amounts of measurement error: between 20 ms and 30 ms.
JMeter used to be one of the more performant tools in these benchmarks, but it seems it has gotten a lot less so over the last two to three years. Siege has also sunk quite a bit, and its performance now doesn’t really give a hint that it’s a tool written in C. Instead, Python-based Locust has sailed up and placed itself next to these other tools, being equally good at generating traffic, if not quite as good at measuring correctly.
Tsung impresses again. While being an old and not-so-actively maintained tool, its load generation capabilities are quite decent and the measurements are second to none but Wrk.
Drill is just weird.
Vegeta, Apachebench, k6, and Hey all seem to be quite good at generating traffic while keeping the measurement error reasonably low. Bias warning here again, but it makes me happy to see k6 end up smack in the middle in all these benchmarks, given that it is executing sophisticated script logic while the tools that outperform it don’t.
End summary
k6 rules!
Or, uh, well it does, but most of these tools have something going for them. They are simply good in different situations.
- I don’t really like Gatling, but I understand why others like it in the “I need a more modern JMeter” use case.
- I like Hey in the “I need a simple command-line tool to hit a single URL with some traffic” use case.
- I like Vegeta in the “I need a more advanced command-line tool to hit some URLs with traffic” use case.
- I don’t like JMeter much at all, but I guess non-developers may like it in the “We really want a Java-based tool/GUI tool that can do everything” use case.
- I like k6 (obviously) in the “automated testing for developers” use case.
- I like Locust in the “I’d really like to write my test cases in Python” use case.
- I like Wrk in the “just swamp the server with tons of requests already!” use case.
Then we have a couple of tools that seem best avoided:
- Siege is just old, strange, and unstable and the project seems almost dead.
- Artillery is super slow, measures incorrectly and the open source version doesn’t seem to be moving forward much.
- Drill is accelerating global warming.
Good luck!
Grafana Cloud is the easiest way to get started with Grafana k6 and performance testing. We have a generous forever-free tier and plans for every use case. Sign up for free now!


