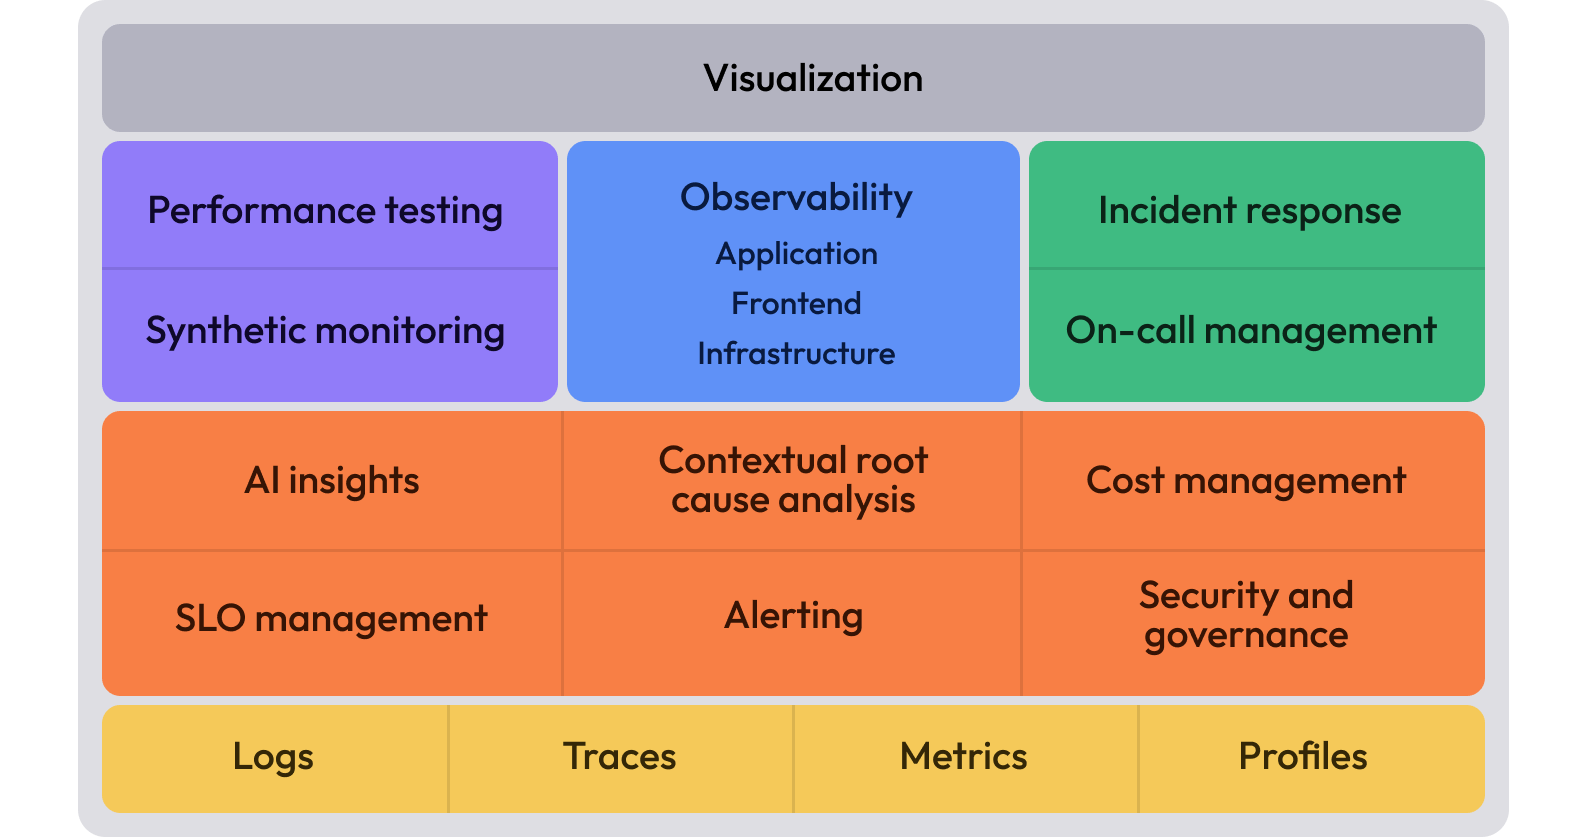
Grafana Cloud
A free tier that’s actually useful
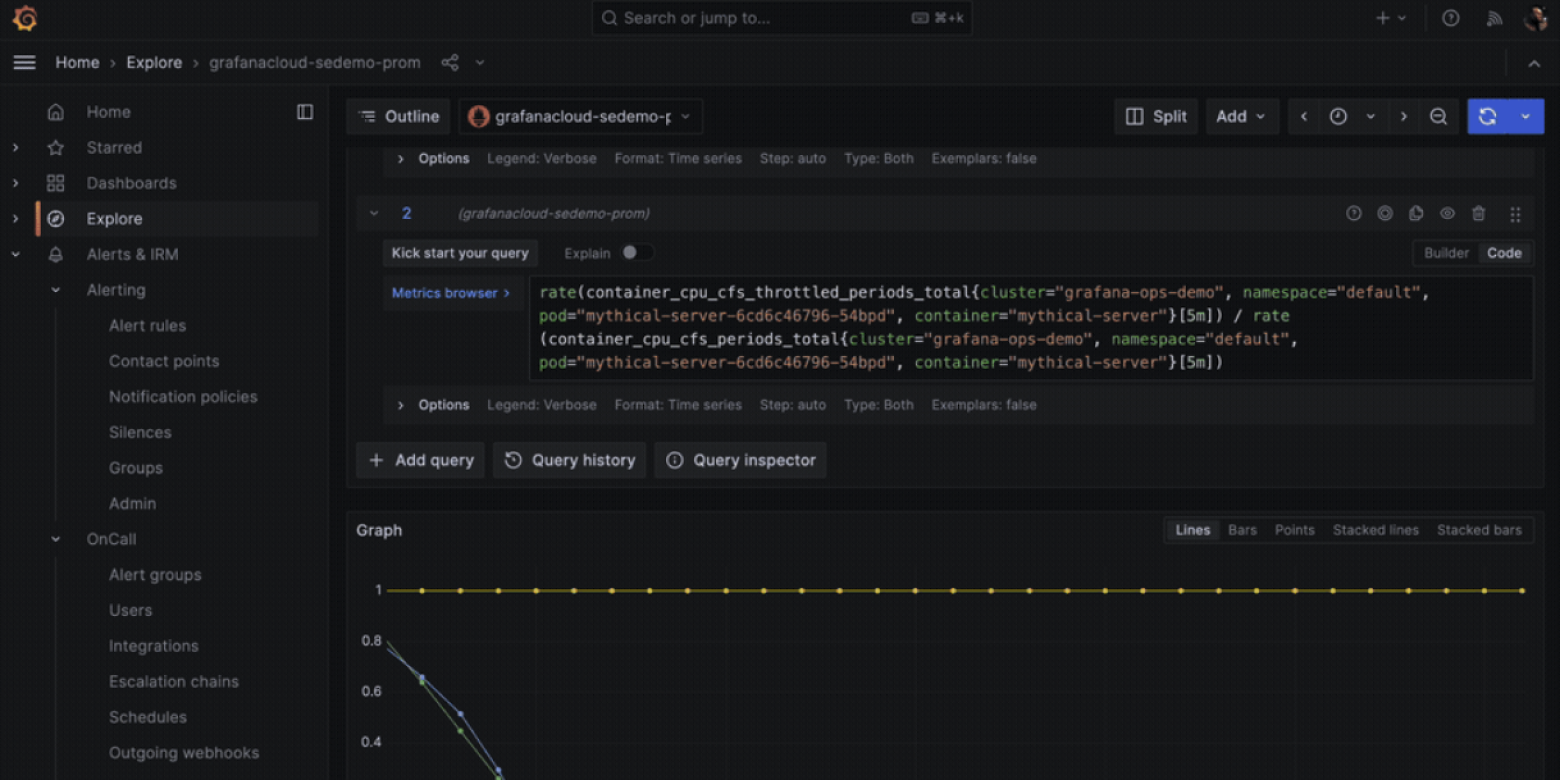
- 10k series Prometheus metrics
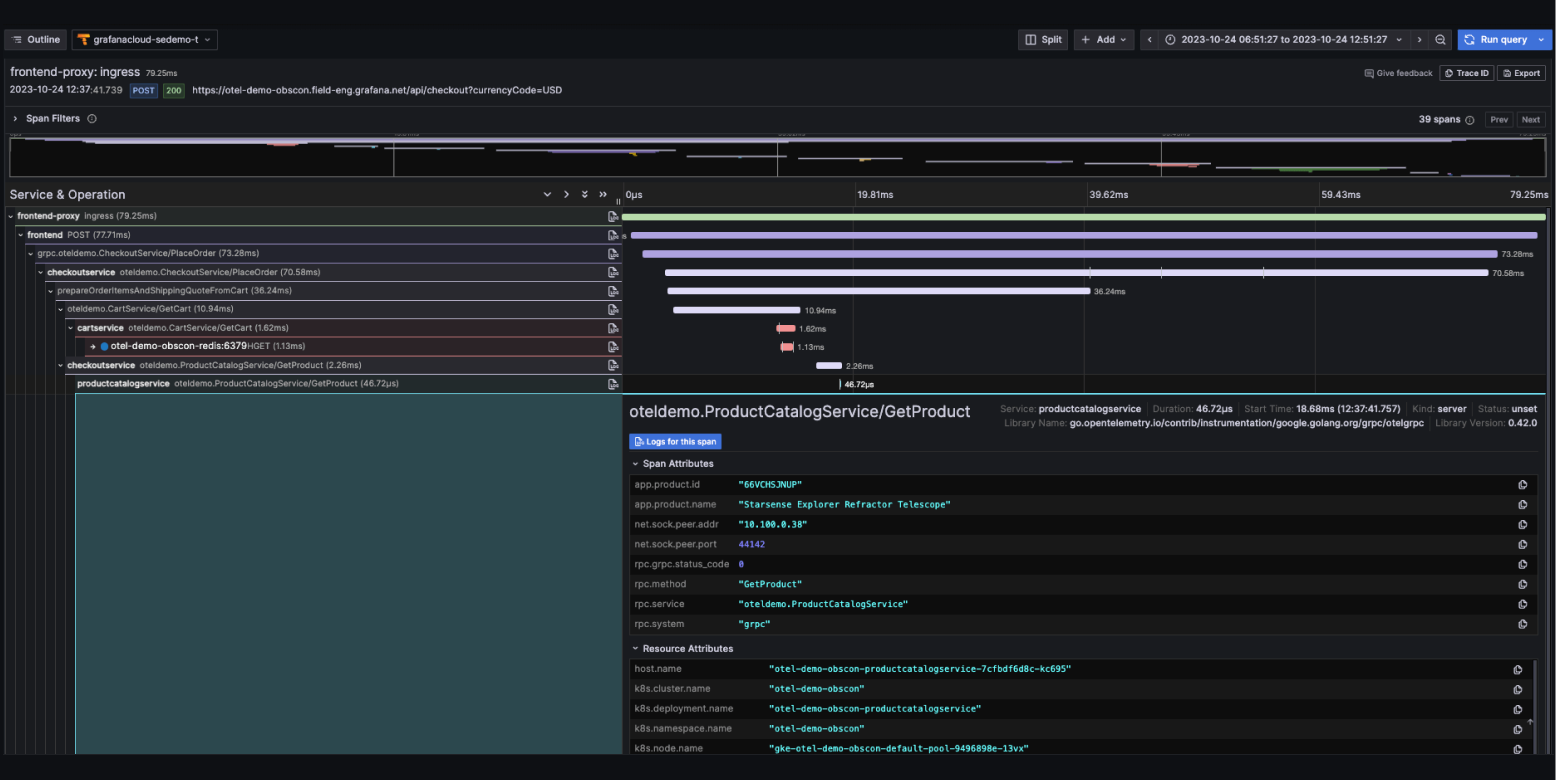
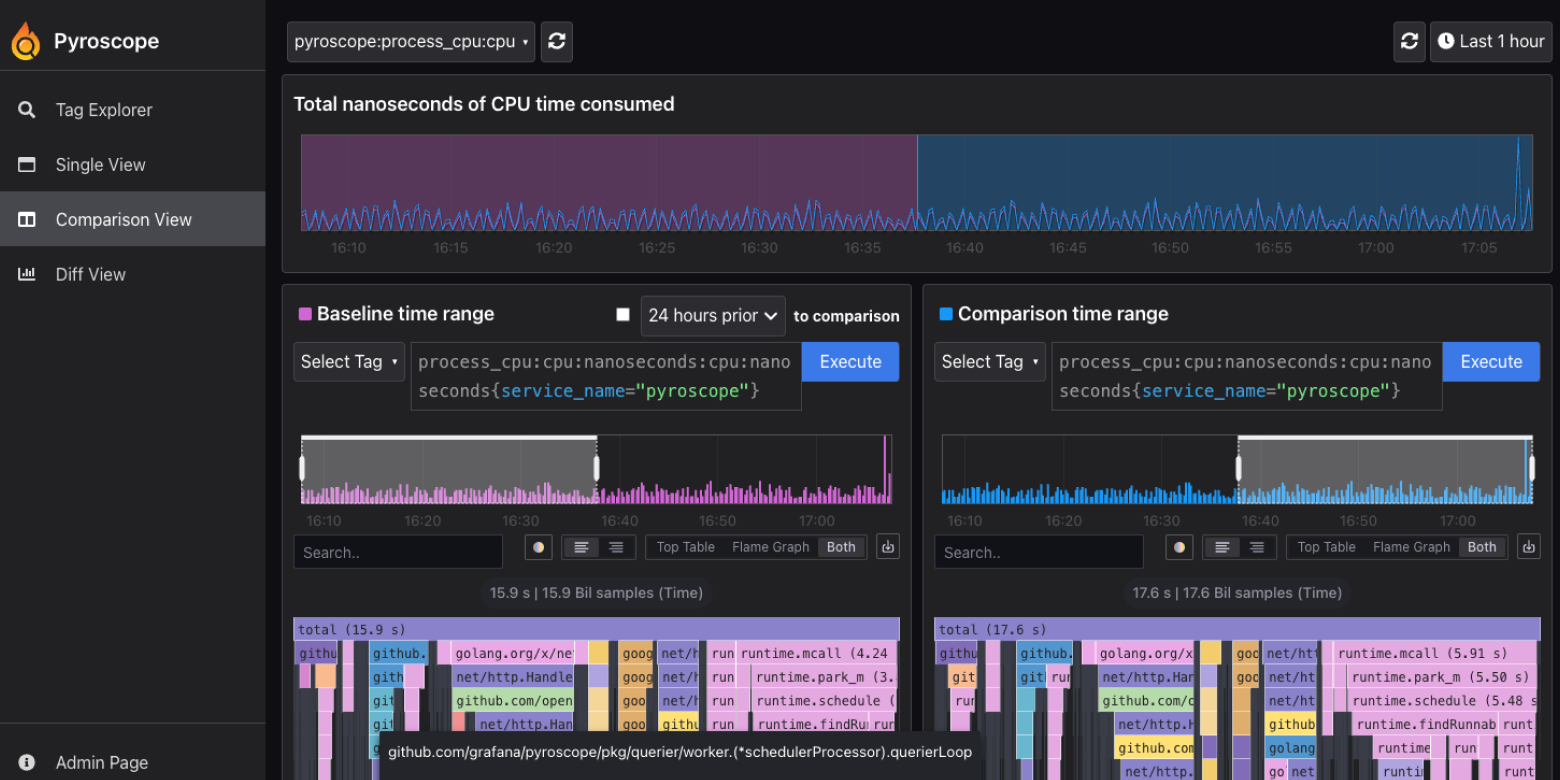
- Storage - 50GB logs, 50GB traces, 50GB profiles
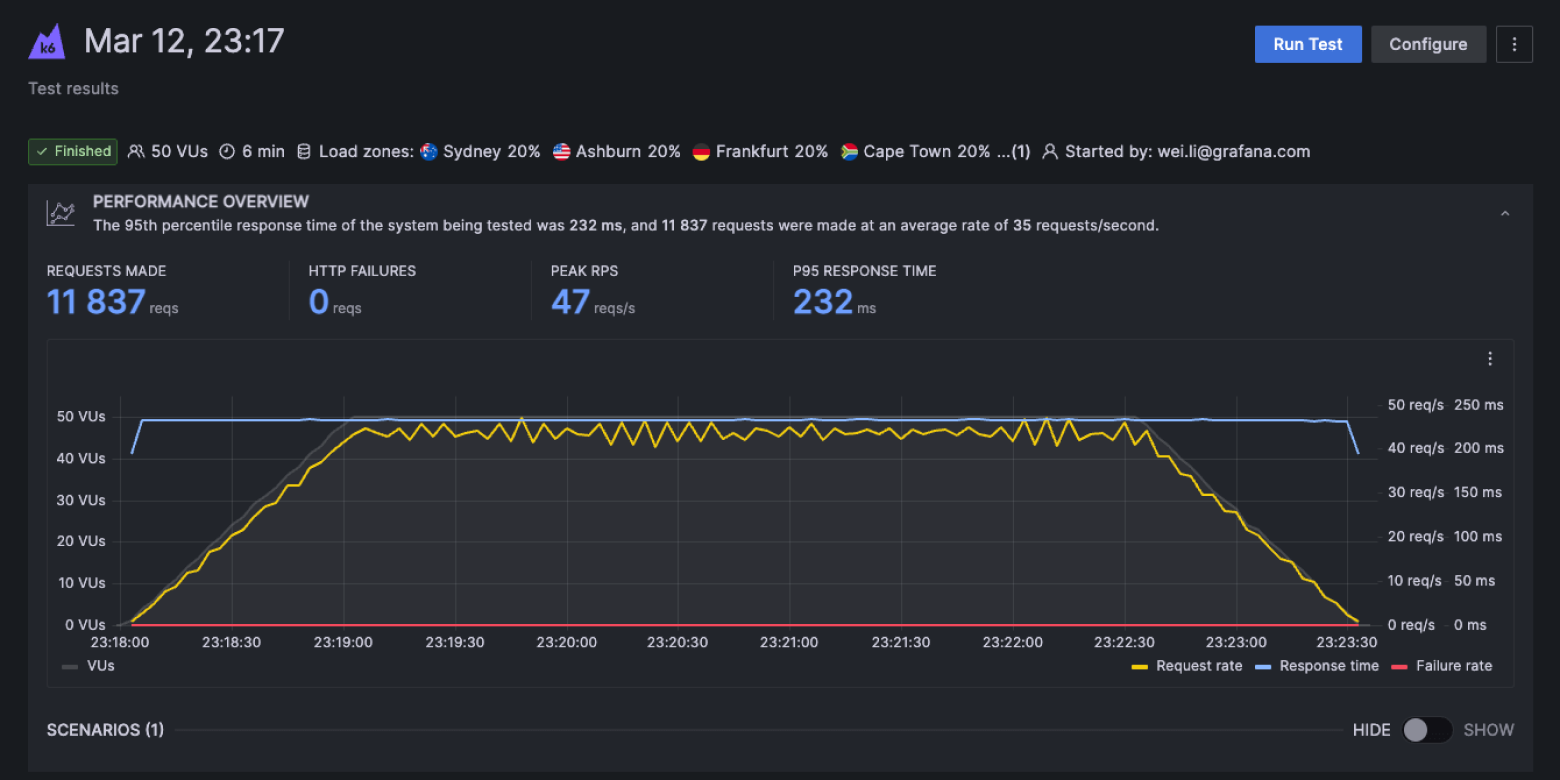
- 500VUh synthetic testing
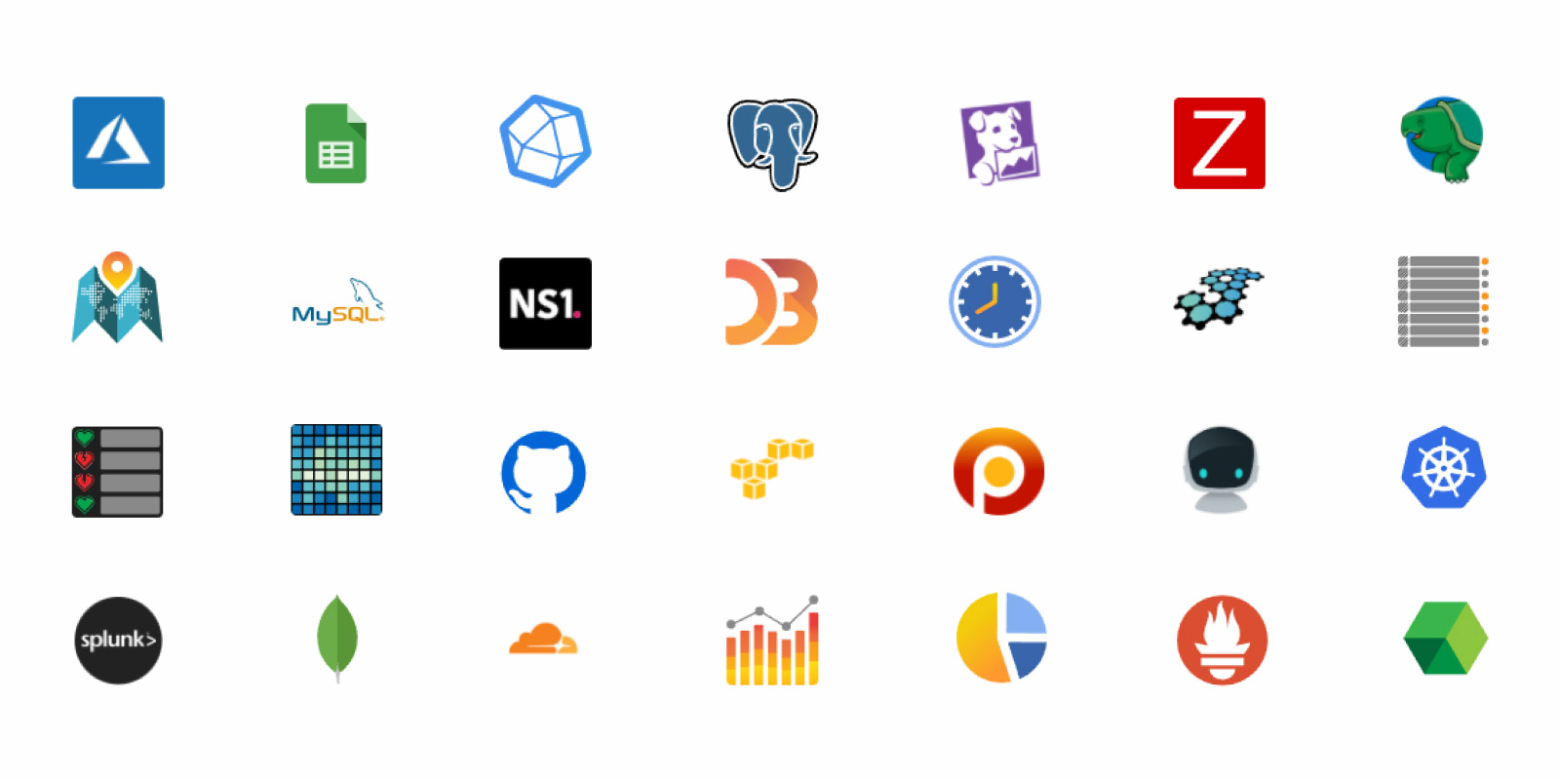
- 20+ Enterprise data source plugins
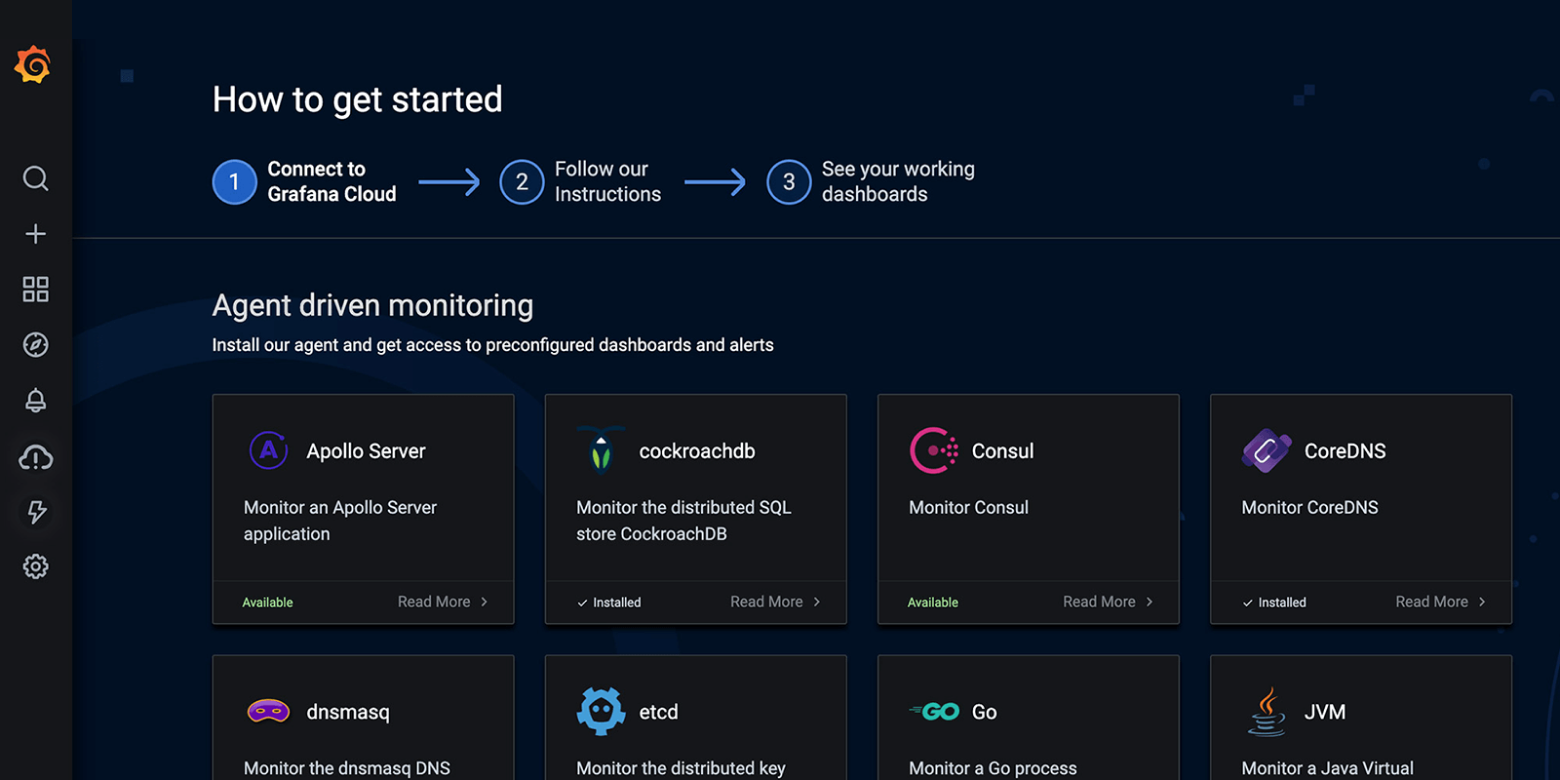
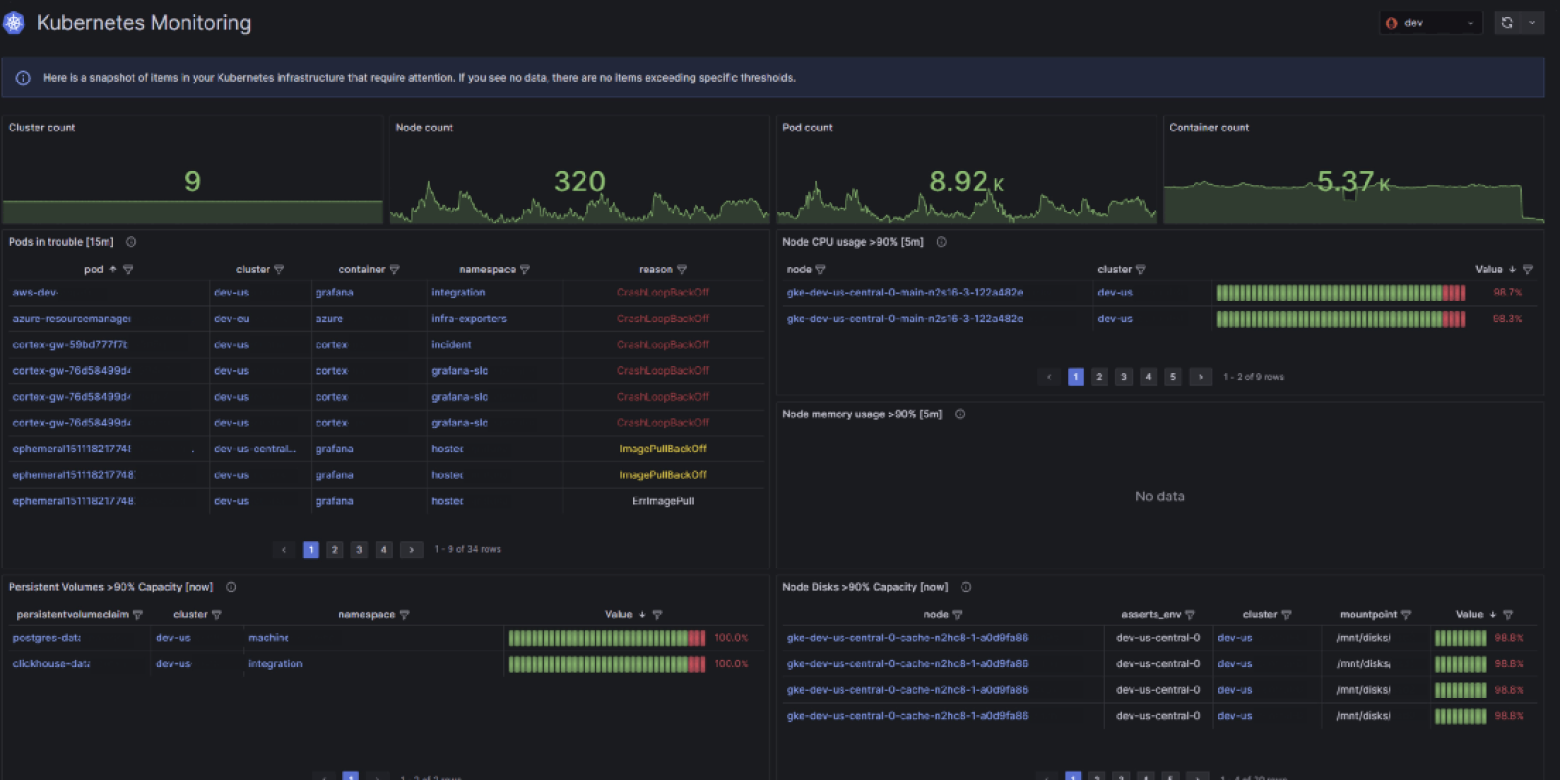
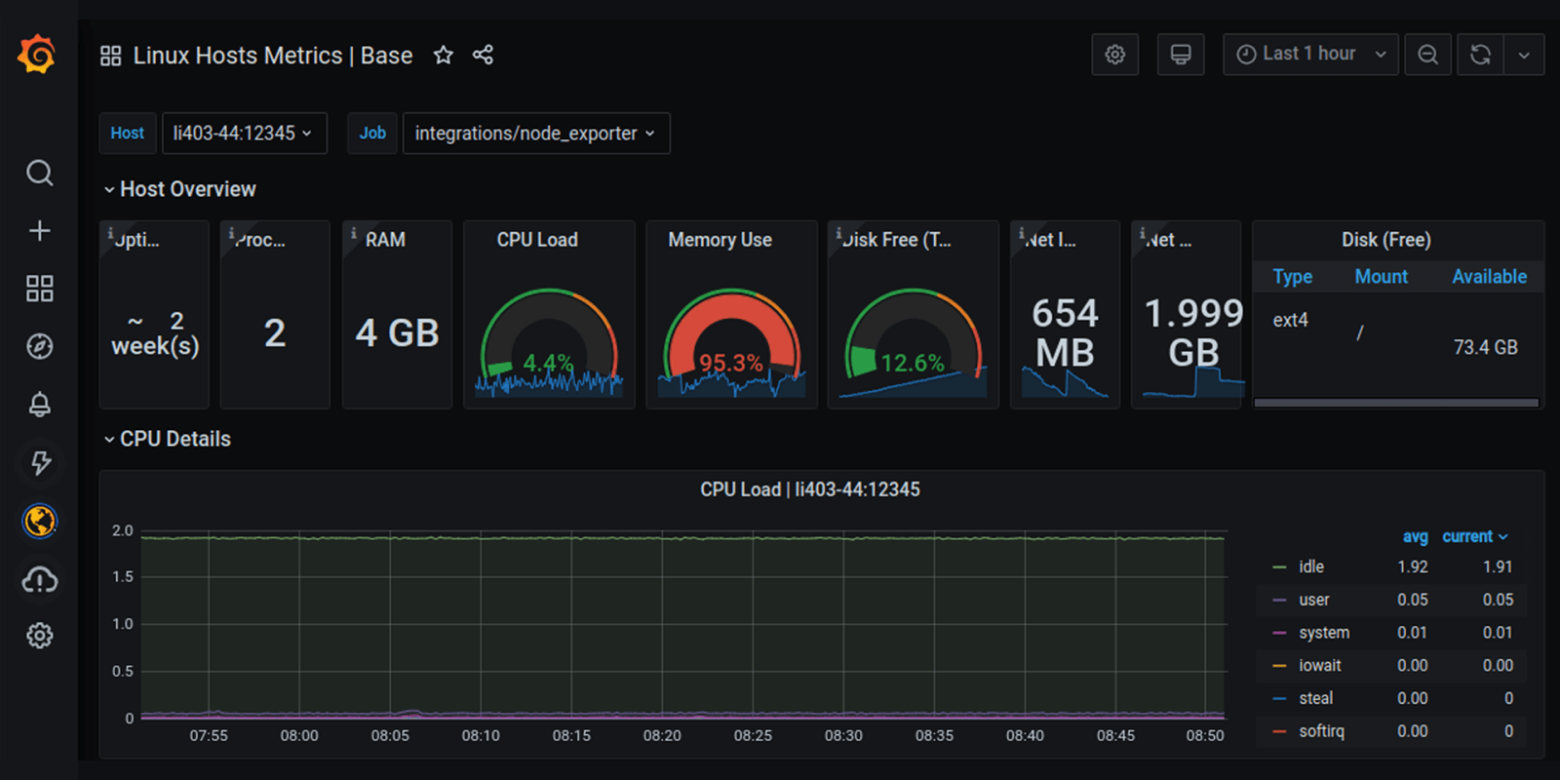
- From k8 to DB monitoring, 100+ pre-built solutions
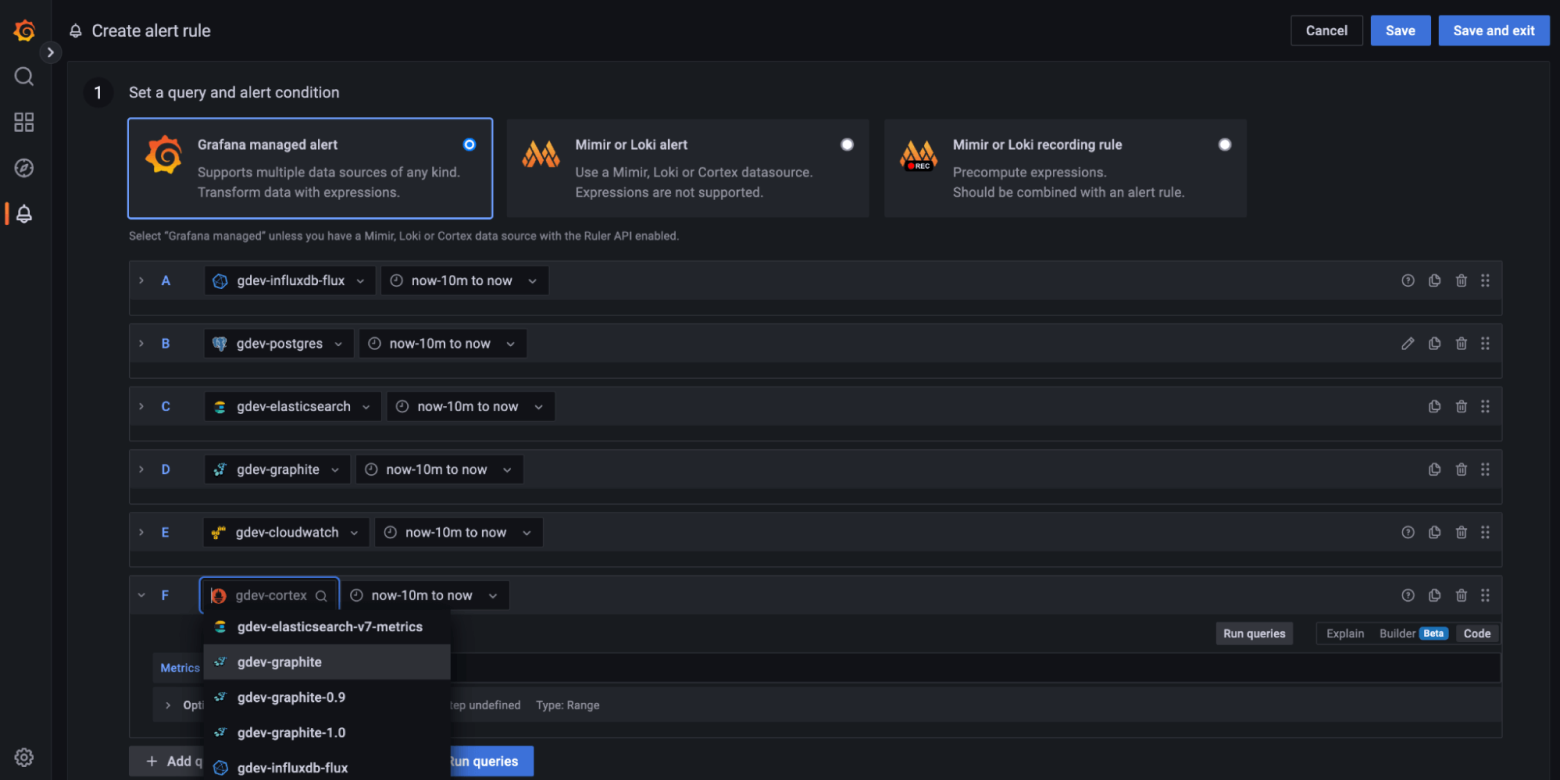
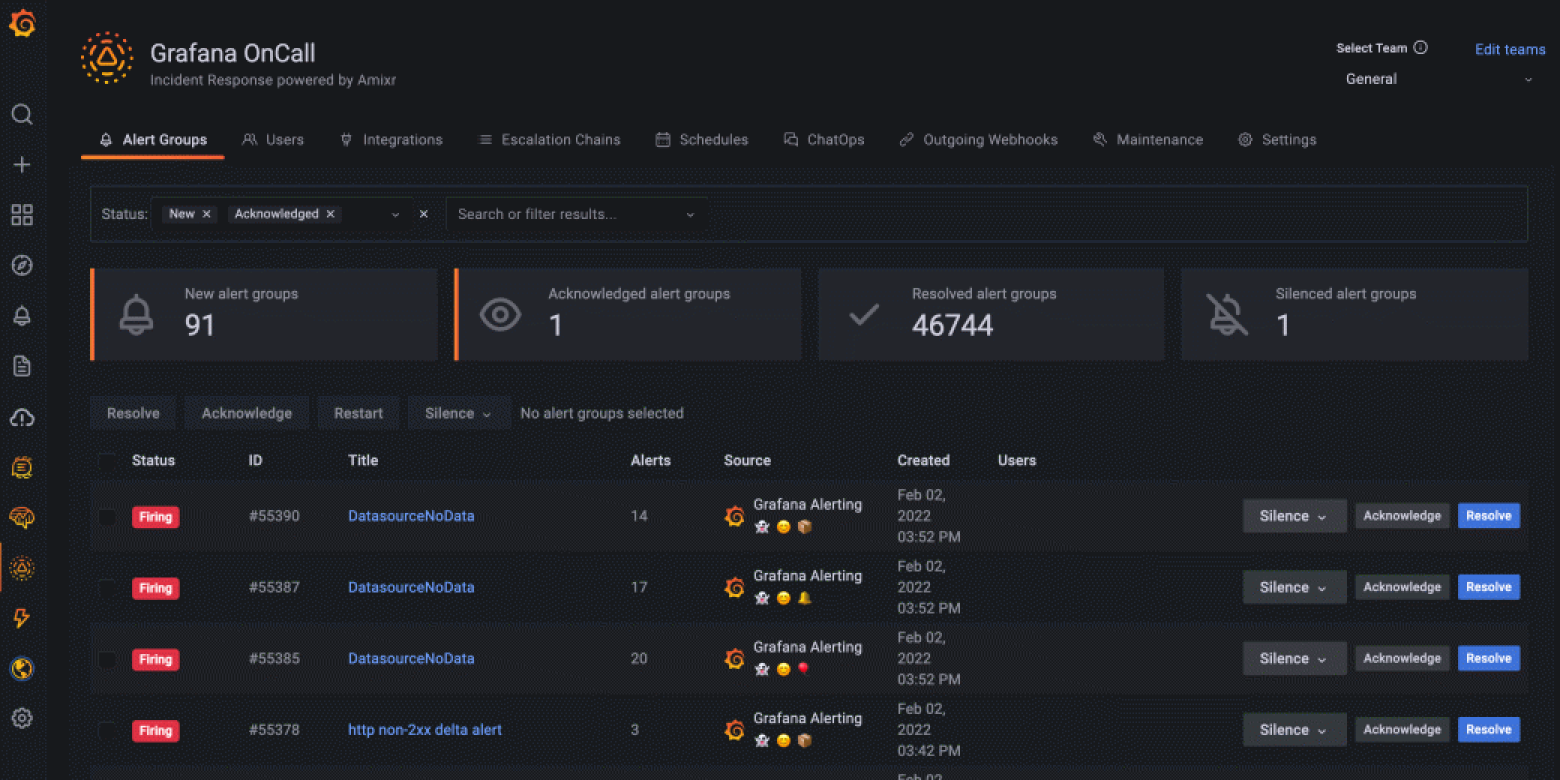
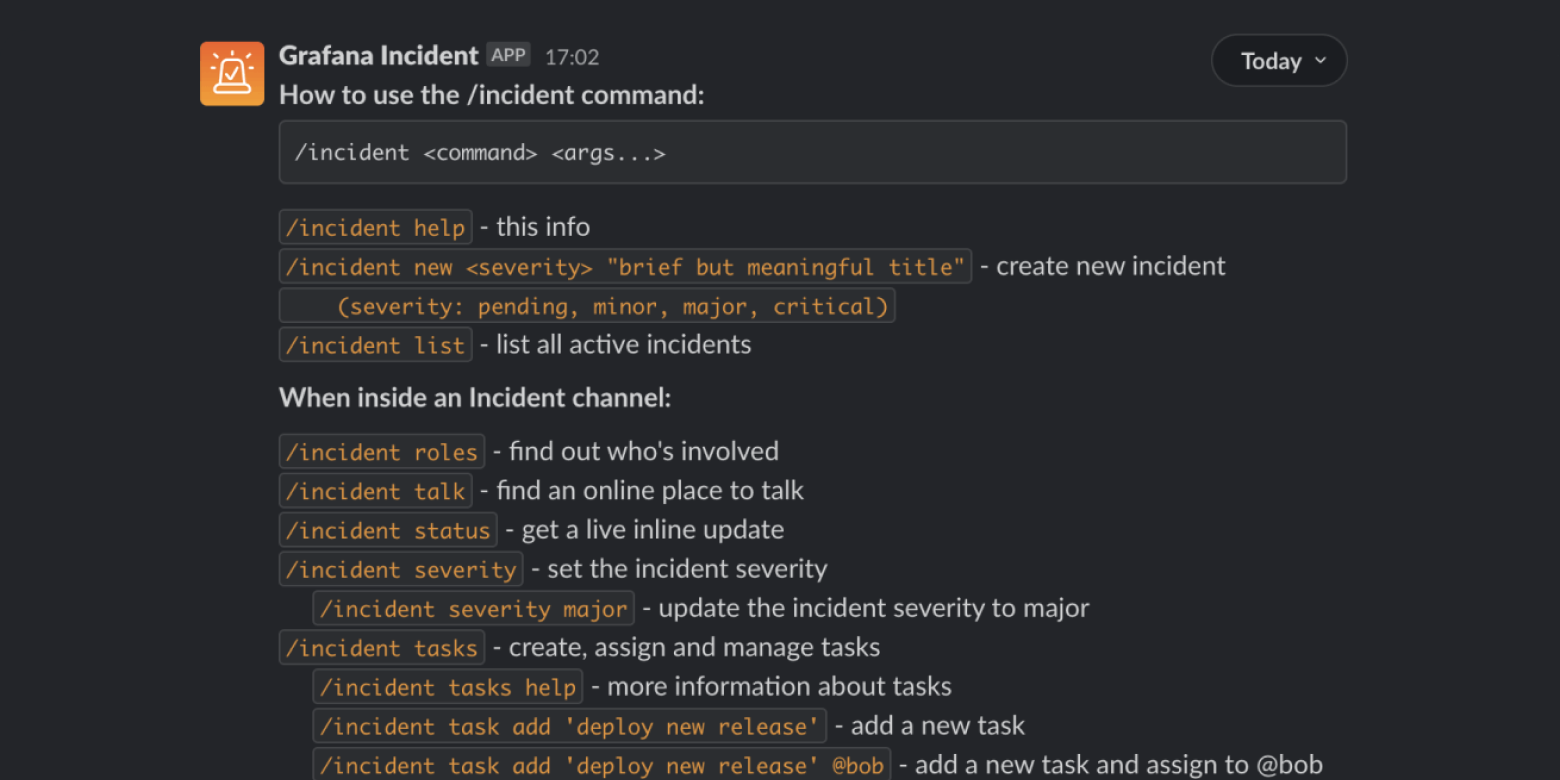
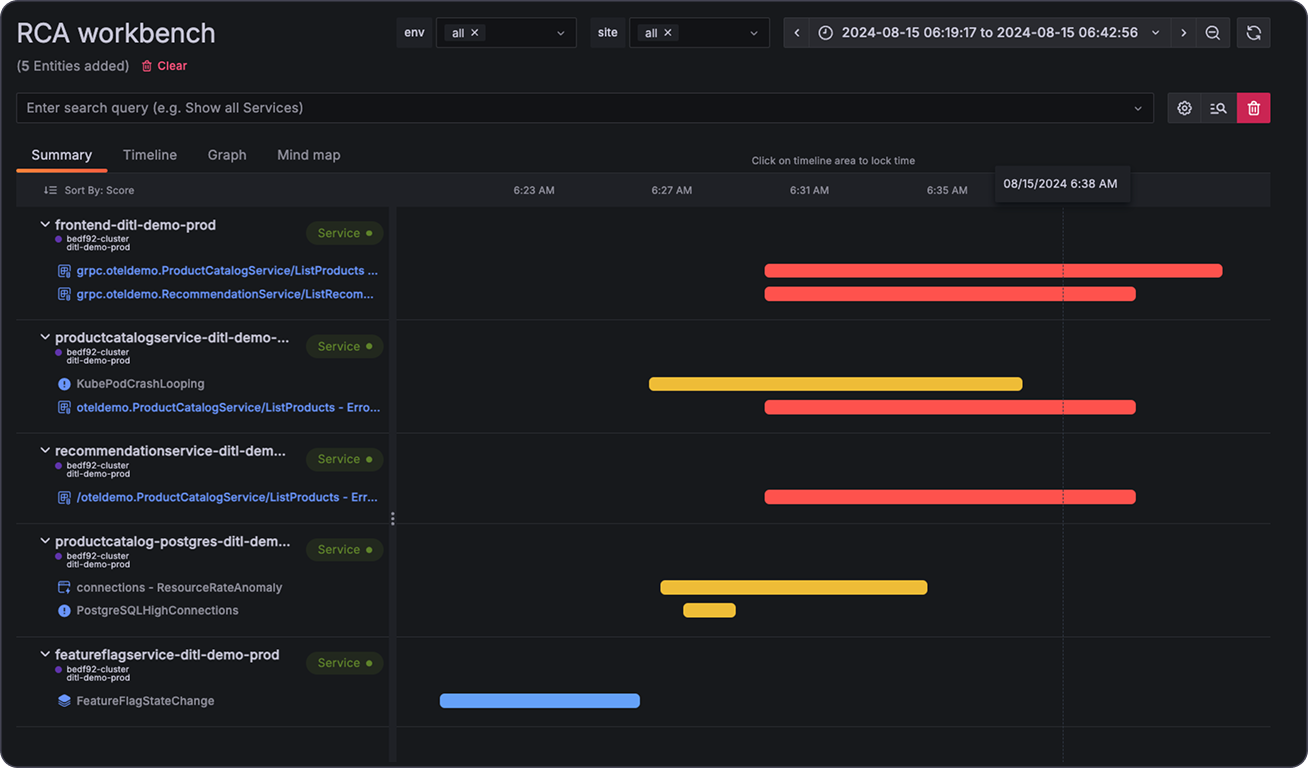
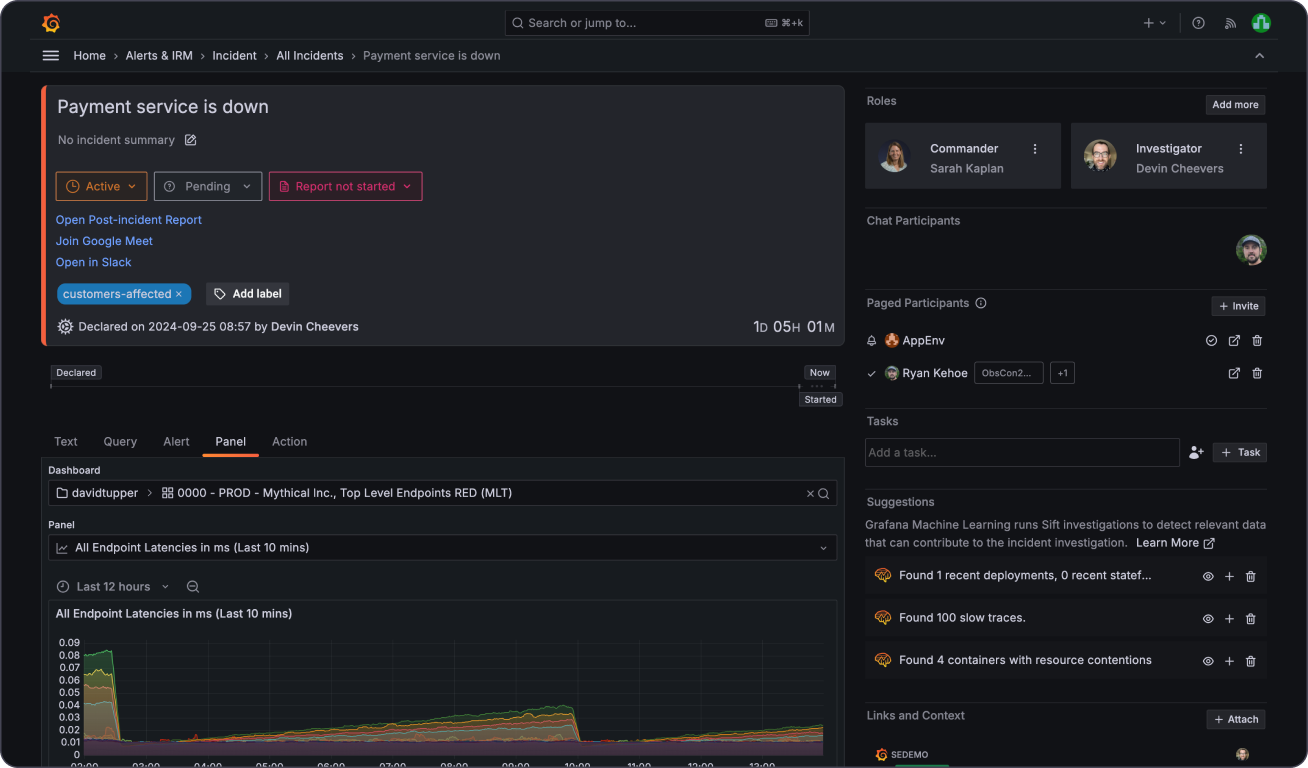
- Incident Response Management & OnCall