
How to get started quickly with metrics, logs, and traces using Grafana Cloud integrations
Note: This blog was updated in November 2023. We’ve also published a more recent version of this blog that covers using Grafana Cloud integrations with Grafana Alloy, our open source distribution of the OpenTelemetry Collector with built-in Prometheus pipelines. Grafana Agent, our OSS telemetry agent, and Grafana Agent Operator are now deprecated.
Grafana Cloud is the easiest way to get started observing metrics, logs, and traces.
When we say “easiest,” we mean it: Grafana Cloud is designed so that even novice observability practitioners can use it. As a new user, you are not required to dive into the complexity of setting up Prometheus and figuring out how to create Grafana dashboards from scratch. Integrations are the reason why.
What are Grafana Cloud integrations?
Integrations bundle Grafana Agent, tailored Grafana dashboards, and best-practice alerting defaults for common observability targets like Linux hosts, databases, and NGINX servers. Currently, there are roughly 100 different technologies that can be observed out of the box with our integrations, and we are and we are continually expanding that catalog.
So how does it work?

First, log into your Grafana Cloud account. If you don’t have one, you can sign up for a forever-free account today.) Next, hit the + Connect data button to get started. You’ll land in the Connections console, which will let you choose between data-source plugins, observability integrations, custom data solutions, and our Grafana Cloud apps like Kubernetes Monitoring and Synthetic Monitoring. Filter by “integration” and find the technology that you want to observe. For demonstration purposes I’ll be choosing Linux Server.

The documentation includes a quickstart guide that shows the entire process of setting up metrics collection on a Linux node.
With integrations, you will have a Prometheus- and Grafana-based observability stack up and running in minutes, including the agent, preconfigured dashboards, and alerting defaults. There are multiple pieces here; let’s talk about each.
What is Grafana Agent?
Grafana Agent collects observability data and sends it to Grafana Cloud. It is based on Prometheus, but it’s also compatible with the OpenTelemetry ecosystem and the Grafana open source stack (Loki, Grafana, Tempo, Mimir, Pyroscope).
The agent uses a subset of code that is relevant for interaction with hosted metrics. Specifically:
- Service discovery
- Scraping
- Write-ahead log (WAL)
- Remote write
To begin, install the agent to the node from which you want to collect metrics. You can install many instances of the agent across multiple nodes in your infrastructure. Grafana Cloud integrations will guide you through configuring the agent to send collected metrics to a centralized data store in Grafana Cloud.

The agent is not limited to collecting and sending metrics based on integrations. Integrations serve to make the process simpler. You are also able to configure the agent to use existing Prometheus exporters to scrape metrics and send those metrics to the centralized data store. Experienced users will appreciate the flexibility to continue using exporters they are familiar with while enjoying the simplicity of doing so with the agent.
This centralized data store is important because it enables you to query your metrics — not only across time, but across data from all nodes in your infrastructure that are sending metrics. You can do this from within Grafana Cloud as you gain familiarity and confidence. From the start, you will benefit from the centralized visualization and alerting capabilities described next.
What do Grafana Cloud integration dashboards show?
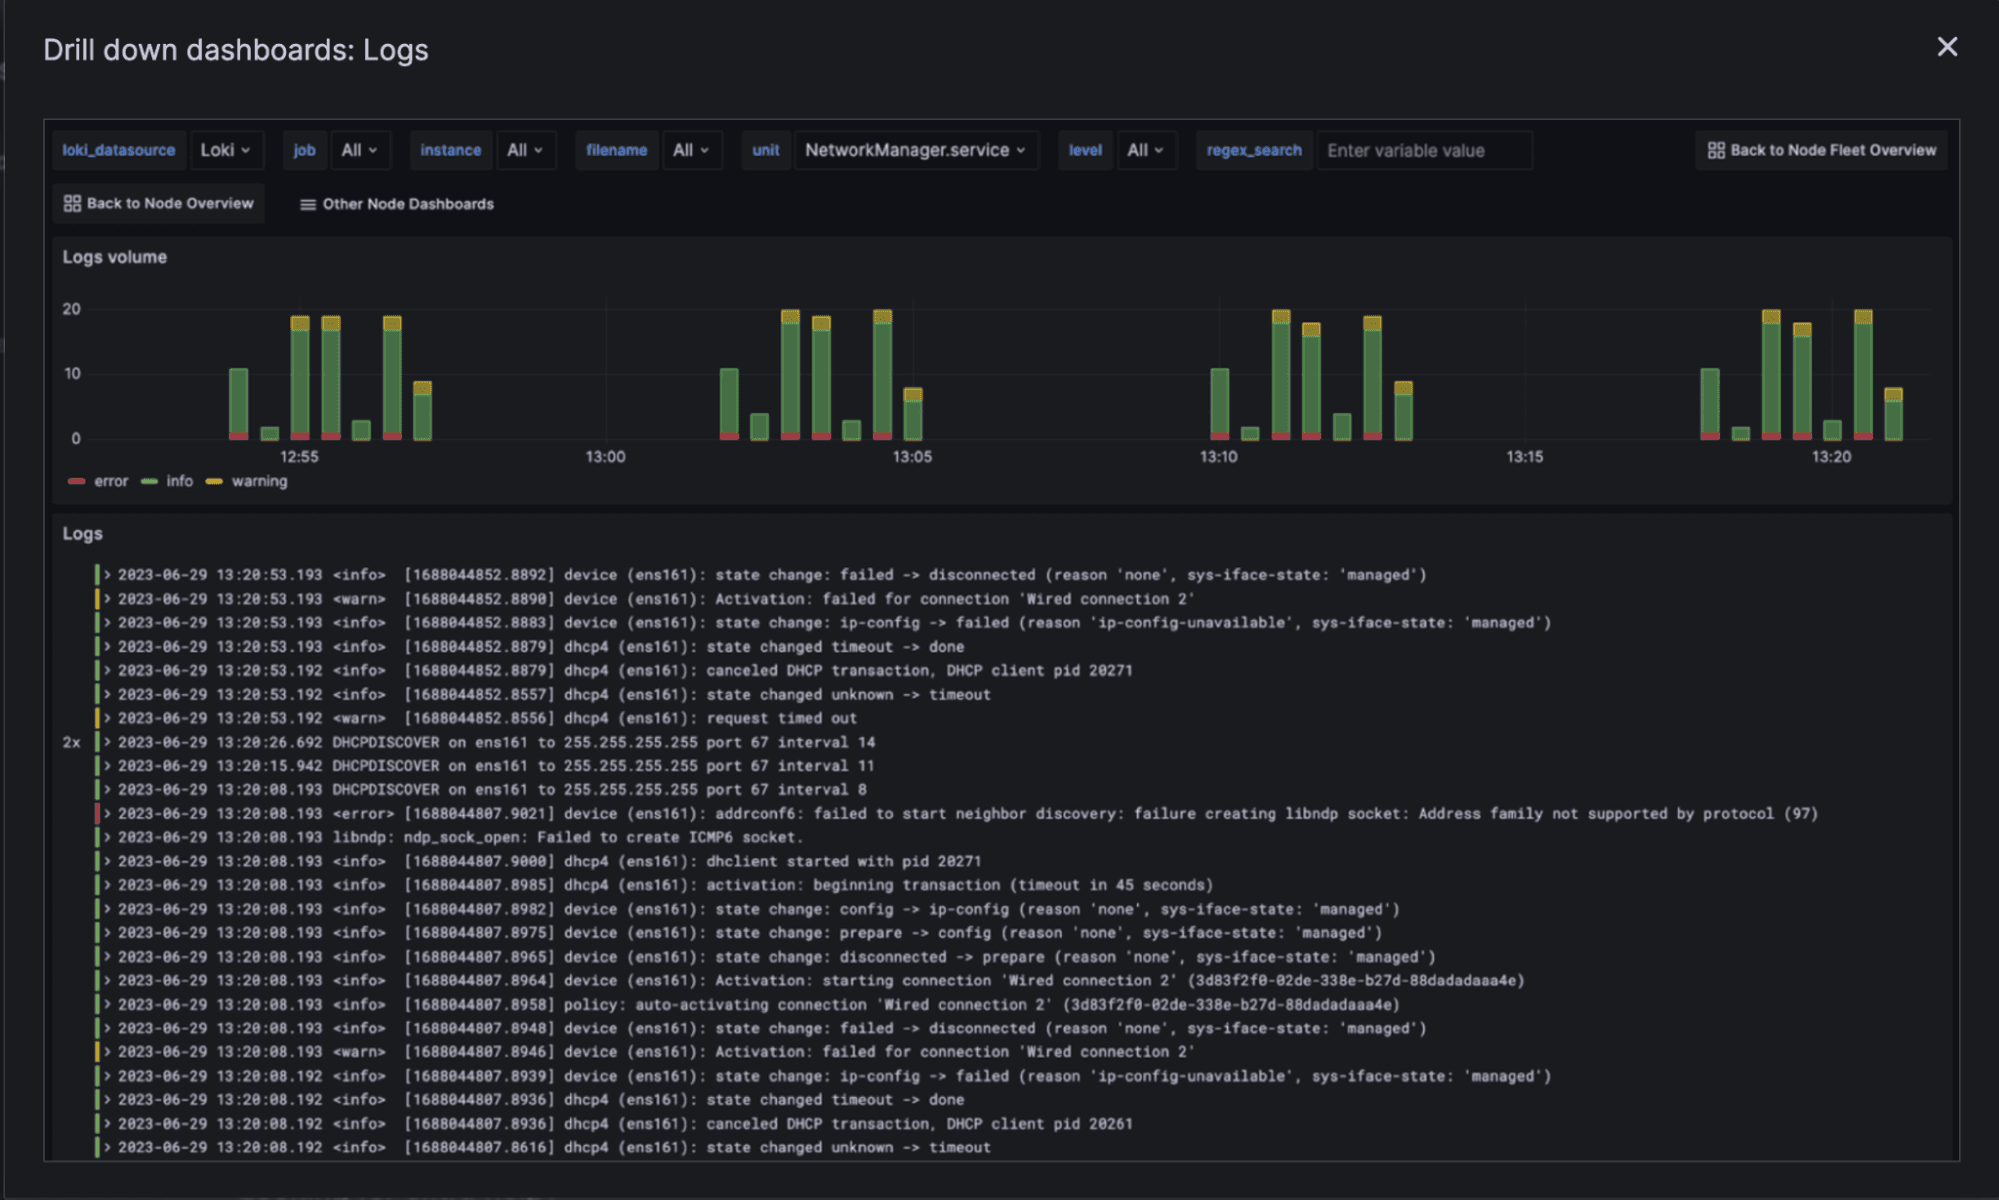
When you install an integration, at least one Grafana dashboard for that integration is installed automatically. This dashboard is ready to display visualizations based on metrics sent from the agent, even before you have the agent configured and working! It only takes a few minutes for graphs and other visualizations to begin showing data as it is received. And the best part? It’s not just any data — it will show you a best practice dashboard for monitoring the specific technology. Many integrations provide you with multiple dashboards and even logs.
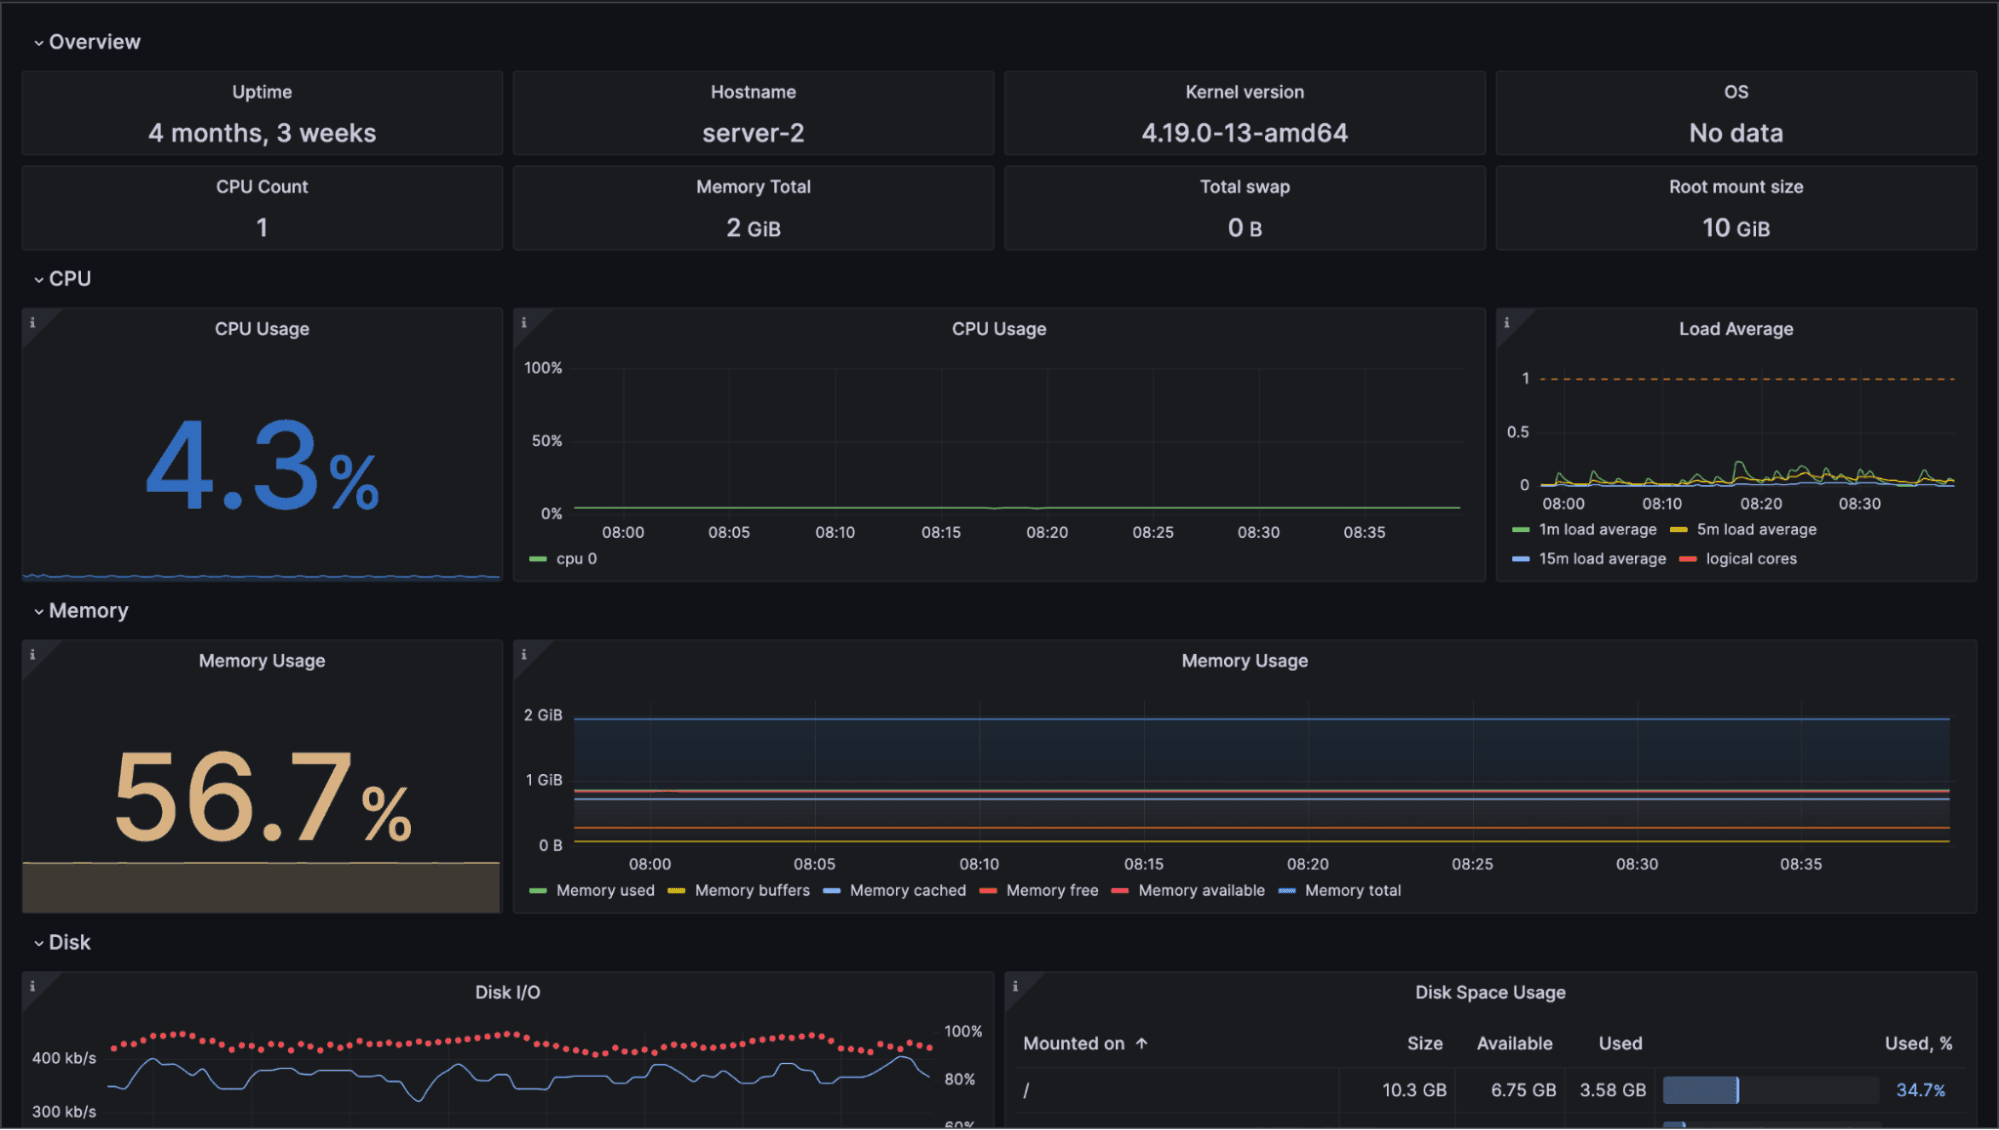
Integration-provided dashboards display a curated set of panels designed to give you a streamlined, useful experience. You are also able to create your own dashboards as you gain more experience, even dashboards that display metrics from multiple sources! To start, however, you don’t need to do anything but appreciate what the integration has included.
What alerting defaults are included with Grafana Cloud integrations?
Grafana Cloud alerts are not sent automatically. A set of curated rules are included with the integration to get you started configuring when to alert and how and to whom each alert should be sent. The curated default rules make the process of getting started with alerts much easier.
The default rules and rules you create here use PromQL.

While integrations provide a starting point for alerting, you are not constrained to just the included curated rules. You also don’t have to use PromQL exclusively; you can create your own rules, too.
You can create or upload a YAML configuration that uses Prometheus Alertmanager to create alerts. These alerts use Prometheus-style alerting rules and can be configured based on Prometheus metrics or Loki log data. Those already familiar with Prometheus will appreciate that both recording and alerting rule types are supported and are configured the same way as standard Prometheus rules.
Why should I use Grafana Cloud integrations?
Grafana Cloud integrations enable you to set up an observability stack quickly. You don’t need previous experience, and you don’t even need to know much about observability. Integrations exist to help novice users begin easily and to help experienced users get stuff done quickly. You start with useful simplicity and can grow as needed.
Grafana Cloud integrations offer:
- An agent to collect metrics for each node/application you configure it to collect from and to push metrics to your Grafana Cloud centralized data store
- Preconfigured dashboards to visualize those metrics
- Curated alerting rules to help you get started
Sure, you could set up your own Grafana instance, but to match the features offered by Grafana Cloud would require a lot of time and energy. On the other hand, as you gain experience and decide you want to do something unique, you are still able to configure and expand upon what integrations provide.
Grafana Cloud is the easiest way to get started with metrics, logs, traces, and dashboards. We recently added new features to our generous forever-free tier, including access to all Enterprise plugins for three users. Plus there are plans for every use case. Sign up for free now!

