
MongoDB visualization
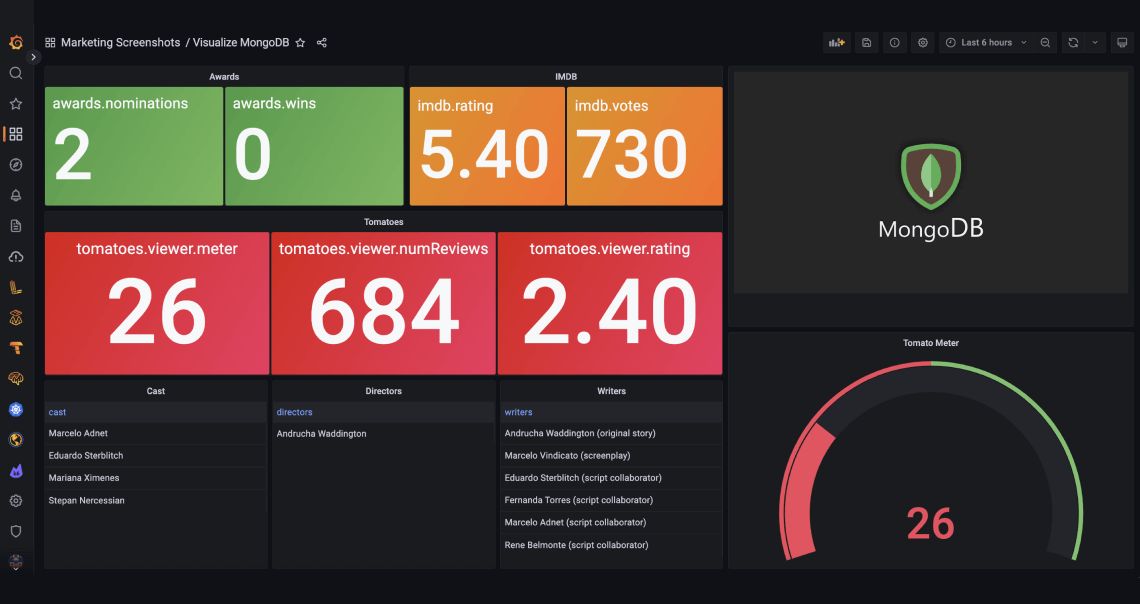
The MongoDB data source plugin is the simplest way to visualize MongoDB data in a dashboard. You can interact in real time with your existing MongoDB data and unify data sets across your company into a single diagnostic workspace.
Need to self-manage?
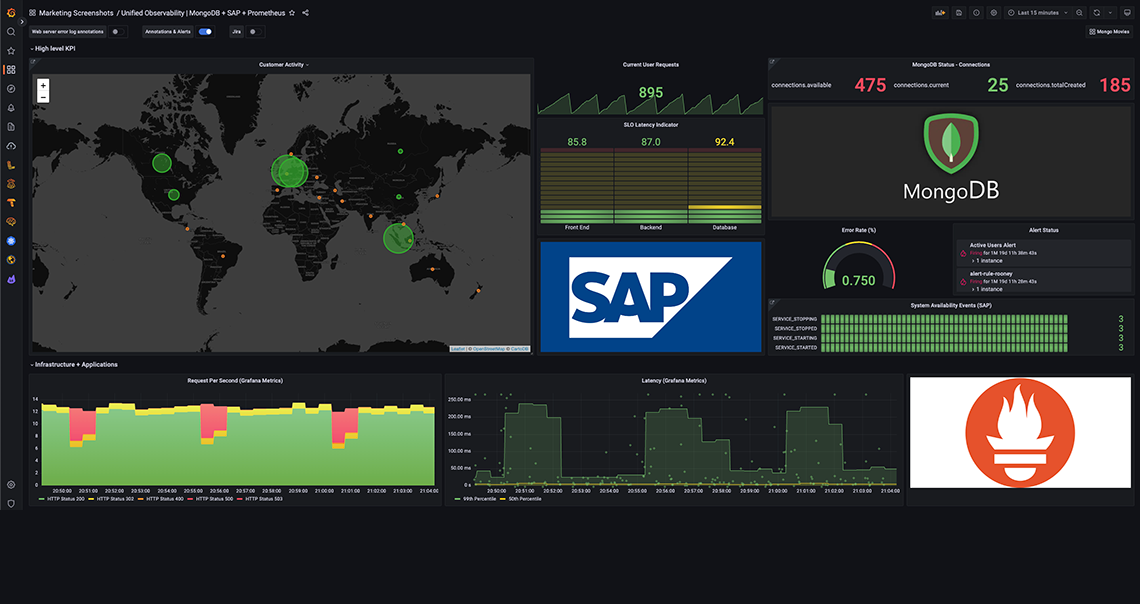
Single pane of glass for all your data

Visualize MongoDB and MongoDB Atlas data without moving or duplicating it
Correlate all your MongoDB data with a wide range of data sources

How to configure MongoDB with Grafana Cloud
It only takes a few clicks to add your MongoDB connection string and authentication credentials. Then you can write MongoDB queries and create a Grafana dashboard with your MongoDB data and MongoDB Atlas data.
For full implementation details and best practices, see the step-by-step MongoDB data source guide.
Get started with these easy steps
1
Create your free Grafana Cloud account.
2
With a few clicks, set up default configurations for prebuilt dashboards and alerting rules.
3
Data will stream from your cluster into Grafana Cloud.
Need to self-manage?
Grafana data sources frequently used with MongoDB
Prometheus
InfluxDB
CloudWatch

AppDynamics
