Prometheus Go Client Library
On this page:
Introduction
The following quickstart provides setup instructions and a preconfigured dashboard for the Prometheus Go client library. After running through the steps in this quickstart, you will have:
Set up and configured the Go client library to collect Go Prometheus metrics like total reserved memory, stack memory use, and heap memory. The Go client library will expose these as Prometheus-style metrics.
Configured Prometheus to scrape Go client library metrics and optionally ship them to Grafana Cloud.
Imported Grafana dashboards to visualize your metrics data.
Metrics usage
This exporter publishes roughly 45 Prometheus time series by default. To see a list of metrics shipped by default with this exporter, please download a sample metrics scrape here.
Note that depending on its configuration, Prometheus Go client library may collect and publish far more metrics than this default set. To learn more about configuring Prometheus Go client library and toggling its collectors, please see the Prometheus Go client library GitHub repository.
Beyond toggling Prometheus Go client library’s settings, you can reduce metrics usage by dropping time series you don’t need to store in Prometheus or Grafana Cloud. To learn how to do this, please see Reducing Prometheus metrics usage with relabeling from the Grafana Cloud docs.
Grafana Cloud’s Golang Integration
If you’re using Grafana Cloud, you can skip all of the steps in this guide by installing the Prometheus Go Integration, which is designed to help you get up and running in a few commands and clicks. Sign up for free.
To learn how to set up Prometheus Go client library with the Prometheus Go Integration, please see Go Integration from the Grafana Cloud docs.
On this page:
Prometheus Go Client Library Quickstart
In this guide you’ll learn how to set up and configure the Prometheus Go client library to collect Go metrics like Total Reserved Memory and Stack Memory Use, and expose them as Prometheus-style metrics. You’ll then configure Prometheus to scrape Go metrics and optionally ship them to Grafana Cloud. Finally, you’ll set up a preconfigured Grafana dashboard. At the end of this guide you’ll have a dashboard that you can use to visualize your Go metrics.
If you’re using Grafana Cloud, the Go Integration can help you get up and running quickly. The Go Integration embeds a Prometheus metrics collector into the Grafana Cloud Agent and automatically provisions a dashboard, so you don’t have to run through the steps in this guide. To learn how to set up the Go Integration, please see Go Integration from the Grafana Cloud docs.
Prerequisites
Before you get started, you should have the following available to you:
- Go installed on your machine. To learn more, please see Download and install from the Go docs.
- Prometheus running in your environment or directly on the machine. To learn how to install Prometheus, please see Installation from the Prometheus docs.
- Grafana running in your environment or directly on the machine. To learn how to install Grafana, please see Install Grafana from the Grafana docs.
- (Optional) A Grafana Cloud account. Grafana Cloud hosts Grafana and a Mimir-based Prometheus metrics endpoint. You will still need to scrape metrics, using either Prometheus installed in your environment, or the Grafana Cloud Agent. To learn more about Grafana Cloud, please see Grafana Cloud.
Step 1: Setting up the Prometheus Go Client Library
In this step you’ll set up the Go client library to collect and expose Go metrics in Prometheus format. This guide uses an Ubuntu 20.04 system with Go 1.16.2. Steps may vary slightly depending on your operating system and Go version.
This guide will set up a minimal application to expose default Go metrics. To instrument an existing application, please see the client_golang GitHub Repository.
Begin by creating a directory for your minimal Go app called metrics_test, and cd into it:
mkdir metrics_test
cd metrics_testNext, initialize a Go module using go mod init:
go mod init test_metricsgo: creating new go.mod: module test_metrics
go: to add module requirements and sums:
go mod tidyDownload and install any necessary client_golang libraries using go get:
go get github.com/prometheus/client_golang/prometheus/promhttpgo get: added github.com/prometheus/client_golang v1.9.0Next, open a file called main.go using your favorite editor, and paste in the following Go code:
package main

import (
        "net/http"

        "github.com/prometheus/client_golang/prometheus/promhttp"
)

func main() {
        http.Handle("/metrics", promhttp.Handler())
        http.ListenAndServe(":2112", nil)
}This minimal piece of code sets up a /metrics HTTP endpoint that exposes a default set of Go metrics. It listen for HTTP requests on localhost:2112.
When you’re done, save and close the file.
Compile and test the code using go run:
go run main.goAt this point your shell should hang. Open up another session or background the process to curl the metrics endpoint:
curl http://localhost:2112/metrics. . .
process_start_time_seconds 1.61559003439e+09
# HELP process_virtual_memory_bytes Virtual memory size in bytes.
# TYPE process_virtual_memory_bytes gauge
process_virtual_memory_bytes 1.106751488e+09
# HELP process_virtual_memory_max_bytes Maximum amount of virtual memory available in bytes.
# TYPE process_virtual_memory_max_bytes gauge
process_virtual_memory_max_bytes -1
# HELP promhttp_metric_handler_requests_in_flight Current number of scrapes being served.
# TYPE promhttp_metric_handler_requests_in_flight gauge
promhttp_metric_handler_requests_in_flight 1
# HELP promhttp_metric_handler_requests_total Total number of scrapes by HTTP status code.
# TYPE promhttp_metric_handler_requests_total counter
promhttp_metric_handler_requests_total{code="200"} 0
promhttp_metric_handler_requests_total{code="500"} 0
promhttp_metric_handler_requests_total{code="503"} 0If you see the above output, you’re ready to begin scraping Go metrics using Prometheus.
Using client_golang, you can also instrument your existing Go apps to emit custom metrics. To learn more about these features, please see the Go Client Library GitHub repository.
Step 2: Scraping Prometheus Go client library using Prometheus
Now that the Prometheus Go client library is up and running on your machine, you can configure a Prometheus scrape job to collect and store Prometheus Go client library metrics.
Add the following scrape job config to the scrape_configs section of your prometheus.yml configuration file:
- job_name: go
  static_configs:
- targets: ['localhost:2112']Replace localhost with the IP address of the machine running your Go app. To learn more about configuring Prometheus, please see Configuration from the Prometheus docs.
If you don’t have a prometheus.yml configuration file, create a simple one using your favorite text editor. Open your preferred text editor and paste in the following Prometheus configuration:
global:
  scrape_interval: 15s

scrape_configs:
- job_name: go
  static_configs:
- targets: ['localhost:2112']This configuration tells Prometheus to scrape all jobs every 15 seconds. The only configured scrape job is called go and defines a localhost:2112 target. By default, Prometheus will scrape the /metrics endpoint using HTTP.
Save and close the file. You can then run Prometheus with the file using the following command:
./prometheus --config.file=./prometheus.ymlShipping metrics to Grafana Cloud
To ship Go metrics to Grafana Cloud from Prometheus, configure the remote_write parameter in your prometheus.yml configuration file. To learn more, please see Metrics — Prometheus from the Grafana Cloud docs. To learn more about the remote_write parameter, please see remote_write from the Prometheus docs.
Step 3: Configuring dashboards
This quickstart includes one dashboard:
- Go runtime metrics
To learn how to import this dashboard into Grafana, please see Importing a dashboard from the Grafana docs.
You can fetch the dashboard here.
Conclusion
In this quickstart you installed and ran a minimal Go app on your Linux machine that exposes Prometheus metrics using client_golang. You then configured Prometheus to scrape the Go metrics exposed by client_golang. Finally, you imported a Grafana dashboard to visualize your Go metrics.
If you’re using Grafana Cloud, you can skip all of the steps in this guide by installing the Go Integration with the Grafana Cloud Agent. To learn how to set up the Go integration, please see Grafana Cloud Integrations.
The dashboard was generated using the Go Prometheus Mixin. Mixins are reusable templates for dasboards, recording rules, and alerts curated and designed by subject matter experts. To learn more, please see the Go Mixin repository.
On this page:
Go runtime metrics Dashboard
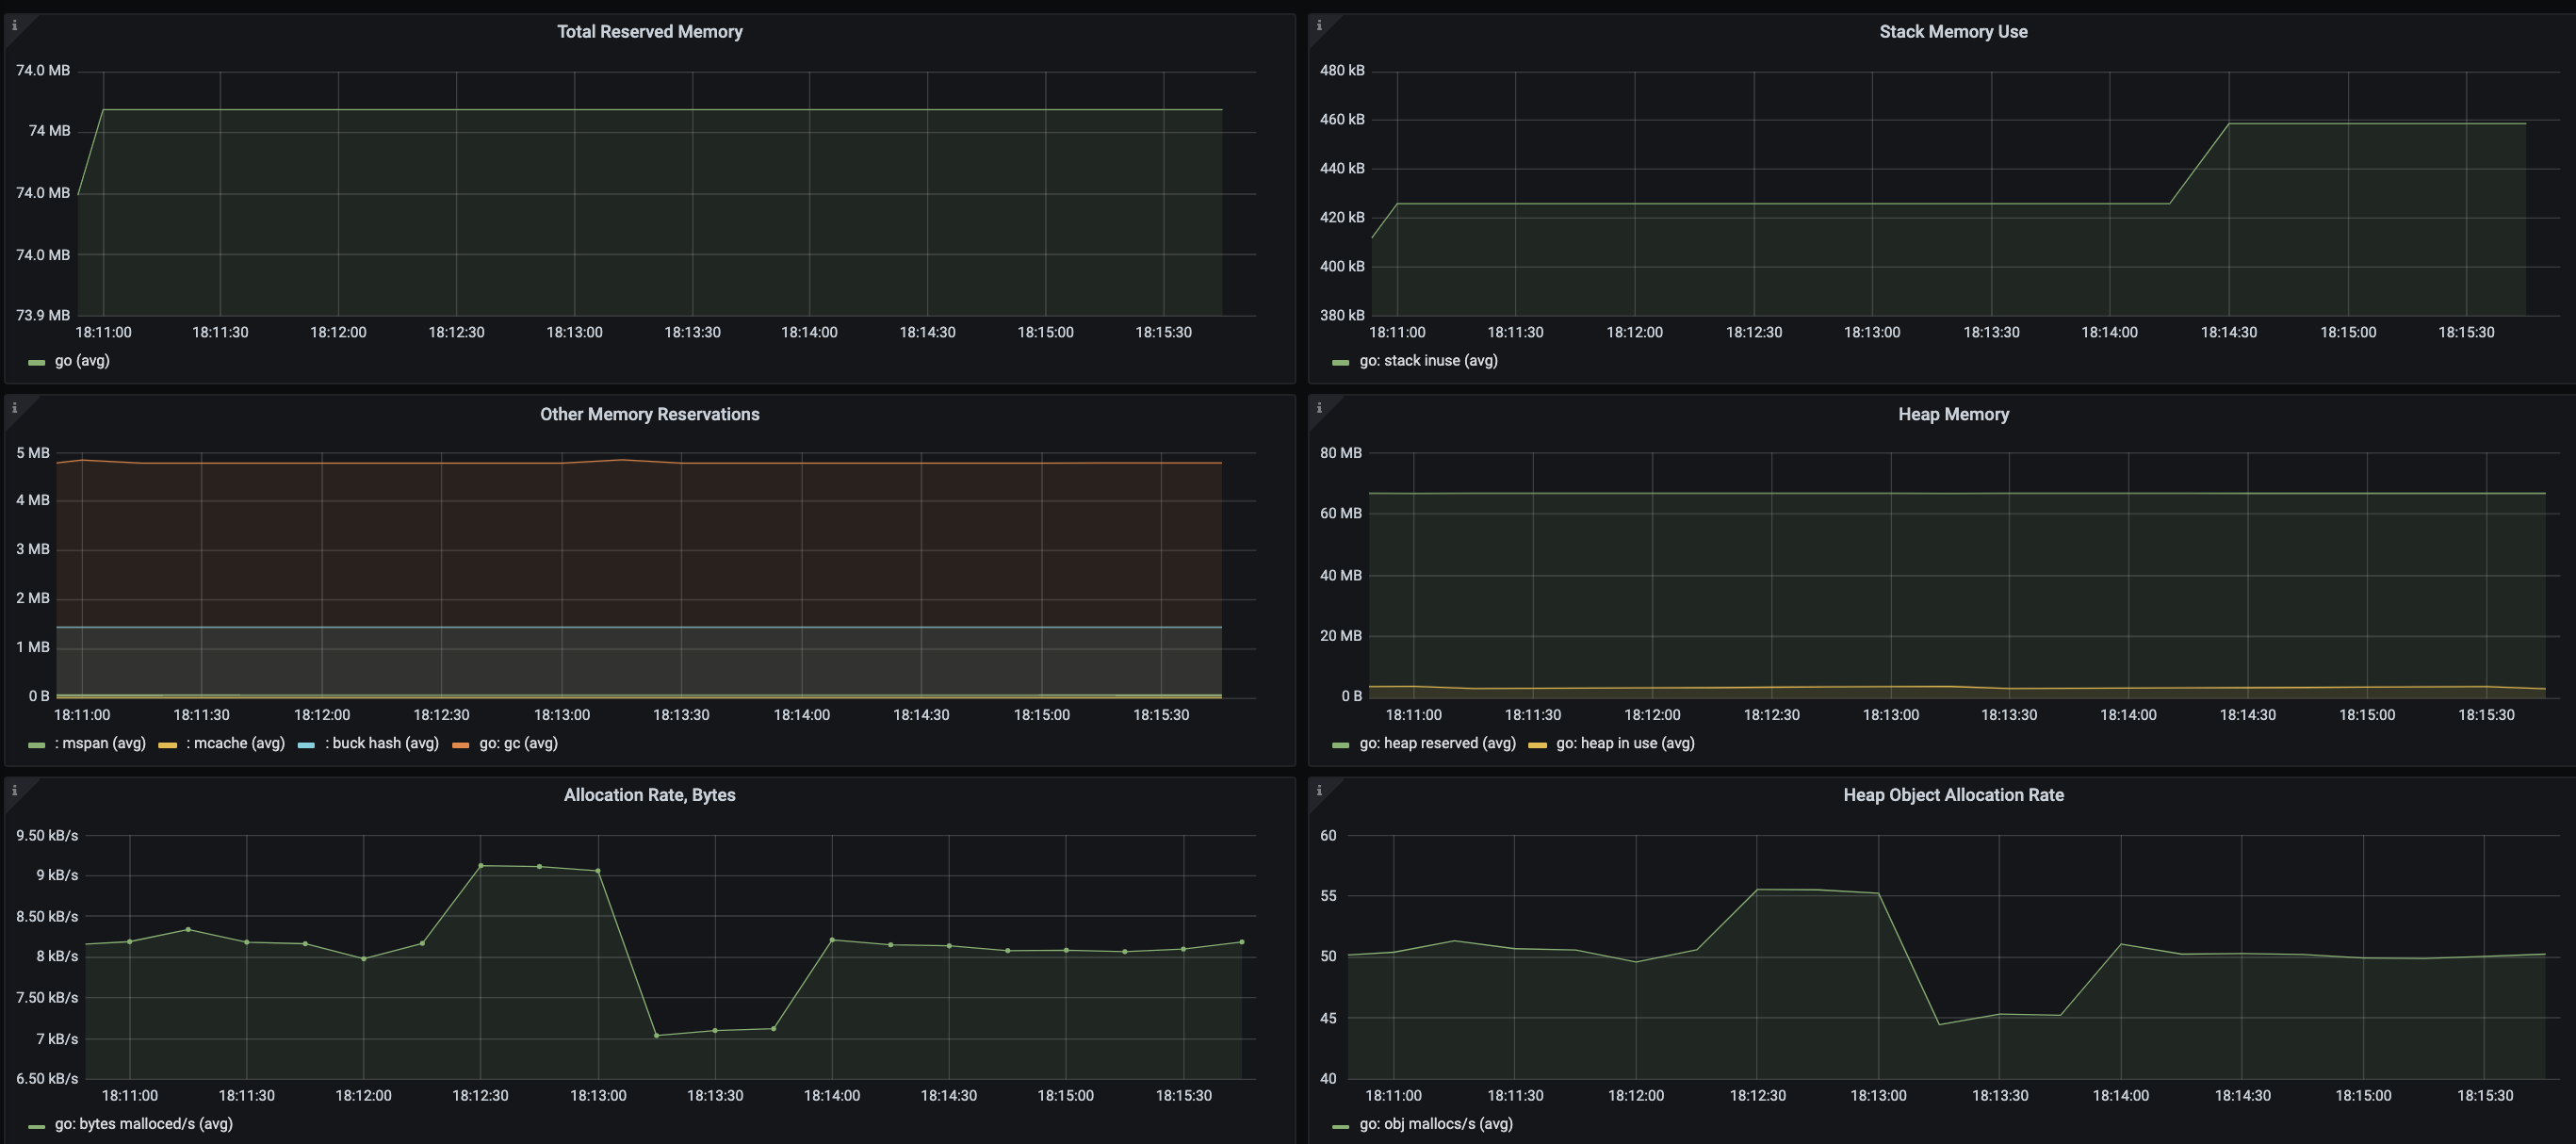
This dashboard includes panels for the following metrics:
- Total Reserved Memory
- Stack Memory Use
- Other Memory Reservations
- Heap Memory
- Allocation Rate, Bytes
- Heap Object Allocation Rate
- Number of Live Objects
- Goroutines
- GC min & max duration
- Next GC, Bytes
You can import the dashboard directly using the following dashboard ID: 14061.
You can fetch the dashboard JSON here.
This dashboard was generated using the Prometheus Go client library mixin.
On this page:
Grafana Cloud comes with an ever-expanding set of integrations to quickly get an observability stack up and running in minutes. The Go Integration, built-in to the Grafana Cloud Agent, scrapes essential Go metrics and pushes them to Grafana Cloud. The agent will scrape metrics exposed by the client_golang library, and Grafana Cloud will automatically provision a tailored Grafana dashboard for visualizing and acting on this data.
To learn more, check out the Grafana Cloud docs.
How it works
Configuring, installing, connecting, and maintaining Prometheus monitoring components typically involves significant domain knowledge. It can take quite a while to go from setup to dashboard and alerts. As the creators of Grafana - and core contributors to Prometheus and Cortex - we build simple integrations to abstract some of this work away in order to quickly get started. How it works:
- Sign up (or log in) for a free Grafana Cloud account.
- Select the target you’d like to observe (an ever-expanding catalogue).
- Run a one-line command to install the Grafana Agent. The agent embeds and preconfigures Exporters to expose default metrics, and pushes them to the Grafana Cloud metrics backend.
- Voila! You’ll see tailored Grafana dashboards and will benefit from sane alerting defaults.
Looking for a different Exporter or integration? Check out our growing library of integrations for popular components like MySQL, Postgres, Redis, Memcached and more.