Plugins 〉Splunk Infrastructure Monitoring


Splunk Infrastructure Monitoring
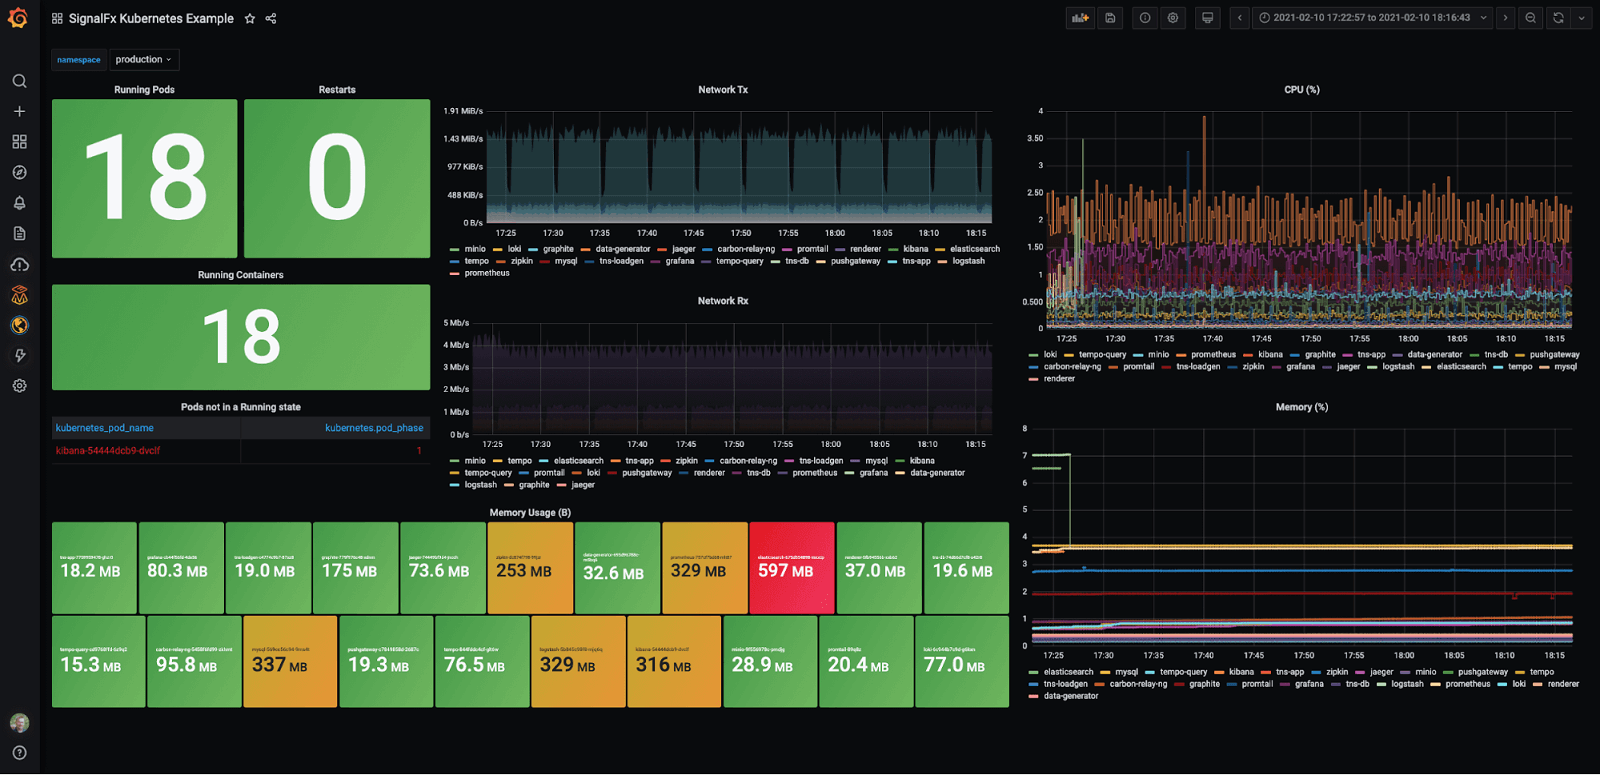
Instantly visualize Splunk Infrastructure Monitoring data in Grafana
The Splunk Infrastructure Monitoring (formerly known as SignalFx) data source plugin is the easiest way to pull Splunk Infrastructure Monitoring data directly into Grafana dashboards.
- Visualize it either in isolation (one database) or blend it with other data sources.
- Discover correlations and covariances across all your data in minutes.
Grafana Cloud Free
- Free tier: Limited to 3 users
- Paid plans: $55 / user / month above included usage
- Access to all Enterprise Plugins
- Fully managed service (not available to self-manage)
Self-hosted Grafana Enterprise
- Access to all Enterprise plugins
- All Grafana Enterprise features
- Self-manage on your own infrastructure
Install on Grafana Cloud
Plugins can be installed directly from within your Grafana instance or automated using the Cloud API or Terraform.
Learn more about plugin installationMarketplace plugins
This is a paid plugin developed by a marketplace partner. To purchase an entitlement, sign in first, then fill out the contact form.
Get this plugin
This is a paid for plugin developed by a marketplace partner. To purchase entitlement please fill out the contact us form.
What to expect:
- Grafana Labs will reach out to discuss your needs
- Payment will be taken by Grafana Labs
- Once purchased the plugin will be available for you to install (cloud) or a signed version will be provided (on-premise)
Thank you! We will be in touch.
For more information, visit the docs on plugin installation.
Installing on a local Grafana:
For local instances, plugins are installed and updated via a simple CLI command. Plugins are not updated automatically, however you will be notified when updates are available right within your Grafana.
1. Install the Data Source
Use the grafana-cli tool to install Splunk Infrastructure Monitoring from the commandline:
grafana-cli plugins install The plugin will be installed into your grafana plugins directory; the default is /var/lib/grafana/plugins. More information on the cli tool.
Alternatively, you can manually download the .zip file for your architecture below and unpack it into your grafana plugins directory.
Alternatively, you can manually download the .zip file and unpack it into your grafana plugins directory.
2. Configure the Data Source
Accessed from the Grafana main menu, newly installed data sources can be added immediately within the Data Sources section.
Next, click the Add data source button in the upper right. The data source will be available for selection in the Type select box.
To see a list of installed data sources, click the Plugins item in the main menu. Both core data sources and installed data sources will appear.
Changelog
1.8.12
- ⚙️ Chore: Backend dependencies updated
1.8.11
- ⚙️ Chore: New Go version supported
1.8.10
- ⚙️ Chore: New Go version supported
v1.8.9 - 2026-04-15
- ⚙️ Chore: Update dependencies
v1.8.8 - 2026-03-06
- ⚙️ Chore: Update dependencies
v1.8.7 - 2026-02-27
- ⚙️ Chore: Update dependencies
v1.8.6 - 2026-02-26
- ⚙️ Chore: Update dependencies
v1.8.5 - 2025-12-03
- ⚙️ Chore: Update frontend dependencies
- ⚙️ Chore: Minimal supported Grafana version is now
11.6.7
v1.8.4 - 2025-06-11
- ⚙️ Chore: update backend dependencies
v1.8.3 - 2025-02-17
- ⚙️ Chore: Improve error logging
v1.8.2 - 2025-02-11
- ⚙️ Chore: Update backend dependencies
v1.8.1 - 2025-02-04
- ⚙️ Chore: Update frontend dependencies
v1.8.0 - 2025-01-30
- 🧪 Tests: Move e2e tests to Playwright
- ⚙️ Chore: Update backend dependencies
- ⚙️ Chore: Update plugin's config page UI
v1.7.10 - 2025-01-10
- ⚙️ Chore: Update backend dependencies
v1.7.9 - 2025-01-08
- ⚙️ Chore: Fix error source for empty access token
v1.7.8 - 2024-12-18
- ⚙️ Chore: Update backend dependencies
v1.7.7 - 2024-12-16
- ⚙️ Chore: Update backend dependencies
v1.7.6 - 2024-11-12
- ⚙️ Chore: Updated backend dependencies
v1.7.5 - 2024-10-03
- ⚙️ Chore: Update frontend dependencies
- ⚙️ Chore: Minimal supported Grafana version is now
10.4.8
v1.7.4 - 2024-09-23
- ⚙️ Chore: Update backend dependencies
v1.7.3 - 2024-08-30
- ⚙️ Chore: update backend dependencies
v1.7.2 - 2024-07-30
- ⚙️ Chore: update backend dependencies
v1.7.1 - 2024-07-09
- 🐛 Fix: Fix bug causing configuration page to crash in some cases
v1.7.0 - 2024-07-03
- ⚙️ Chore: Added SLO metrics to the plugin
v1.6.0 - 2024-07-01
- ⚙️ Chore: Update backend dependencies
v1.5.0 - 2024-06-05
- ⚙️ Chore: Update backend dependencies
v1.4.2 - 2024-03-13
- ⚙️ Chore: Backend binaries are now compiled with Go version
1.22.1
v1.4.1 - 2024-03-05
- ⚙️ Chore: Update dependencies
v1.4.0 - 2024-01-26
- ⚙️ Chore: Add error source
v1.3.1 - 2023-11-21
- ⚙️ Chore: Update backend dependencies
v1.3.0 - 2023-10-30
- ⚙️ Chore: Update backend and frontend dependencies
⚙️ Chore: Minimal supported Grafana version is now
9.5.13
v1.2.4 - 2023-10-20
- ⚙️ Chore: Update backend dependencies
v1.2.3 - 2023-09-12
- ⚙️ Chore: Upgrade to create-plugin; remove toolkit
v1.2.2 - 2023-08-10
- ⚙️ Chore: Updated backend dependencies
v1.2.1 - 2023-06-08
- ⚙️ Chore: backend libs updated with golang:1.20.5
v1.2.0 - 2023-05-24
- 🚀 Feature: Secure socks proxy support added
v1.1.4 - 2023-05-03
- ⚙️ Chore: Backend binaries are now compiled with
golang:1.20.4which contains security fixes
v1.1.3 - 2023-04-19
- ⚙️ Chore: Backend binaries are now compiled with
golang:1.20.3which contains security fixes - ⚙️ Chore: Backend grafana SDK dependencies are updated
v1.1.2 - 2022-12-19
- ⚙️ Chore: Updated to latest version of Go (1.19.4)
- ⚙️ Chore: Updated Grafana backend dependencies
v1.1.1 - 2022-11-11
- 🚀 Feature: (Variables Query) Added support for variable interpolation in dimensions query
- 🐛 Fix: Fixed a bug in dimensions variable editor where dimension query fails to return values
- 🐛 Fix: Fixed a bug where hidden queries are returning results
v1.1.0 - 2022-11-10
- 🚀 Feature: (Variables Query) Added ability to query dimensions
- 🚀 Feature: (Query Inspector) Query inspector now shows the interpolated query
- 🚀 Feature: (Config Editor) Added an ability to customize outgoing URLs. (optional)
- ⚙️ Chore: Variable query schema updated
- ⚙️ Chore: Debug logs now prints the outgoing URLs
- ⚙️ Chore: Fixed typos in the document
v1.0.7 - 2022-11-01
- ⚙️ Chore: Backend binaries compiled with latest go version 1.19.3
- ⚙️ Chore: Backend grafana dependencies updated
v1.0.6 - 2022-11-01
- Update Access Token input to obfuscate password input
v1.0.5 - 2022-10-26
- ⚙️ Chore: Fixed the broken health check and query methods
- ⚙️ Chore: Backend binaries compiled with latest go version 1.19.2
v1.0.4 - 2022-09-19
- 🐛 Fix: query type variables
v1.0.3 - 2021-03-24
- New builds with go 1.18 to address CVE-2022-24921
v1.0.2 - 2021-12-17
- Enterprise license check update
v1.0.1 - 2021-08-10
- Update documentation
v1.0.0 - 2021-04-12
- ⚙️ Chore: Update SDK
v0.9.5 - 2021-03-25
- Drone extension update
v0.9.4 - 2021-03-24
- Use latest integration bot
v0.9.1 - 2021-03-18
- Add dashboard using sample data
v0.9.0 - 2021-02-08
- Initial beta release