Grafana Dashboard for Veeam Availability Console - Tenant Overview
Grafana Dashboard for Veeam Availability Console - Tenant Overview
Just download the latest Veeam Availability Console script version from GitHub https://github.com/jorgedlcruz/veeam-availability-console-grafana/blob/master/veeam-availability-console-script.sh and change the Configuration section within your details:
##
# Configurations
##
# Endpoint URL for InfluxDB
InfluxDBURL="YOURINFLUXDB"
InfluxDBPort="8086" #Default Port
InfluxDB="telegraf" #Default Database
Endpoint URL for login action
Username="YOURVACUSER"
Password="YOURVACPASSWORD"
RestServer="YOURVACURL"
RestPort="1281" #Default Port
Once the changes are done, make the script executable with chmod:
chmod +x veeam_availability-console-grafana.sh
The output of the command should be something like the next, without errors:
HTTP/1.1 204 No Content
Content-Type: application/json
Request-Id: 3565d5b6-011d-11e9-81c7-000000000000
X-Influxdb-Build: OSS
X-Influxdb-Version: 1.6.3
X-Request-Id: 3565d5b6-011d-11e9-81c7-000000000000
Date: Sun, 16 Dec 2018 10:27:37 GM
If so, please now add this script to your crontab, like for example every 30 minutes:
*/30 * * * * * /home/oper/veeam_availability-console-grafana.sh >> /var/log/veeamvbo.log 2>&1
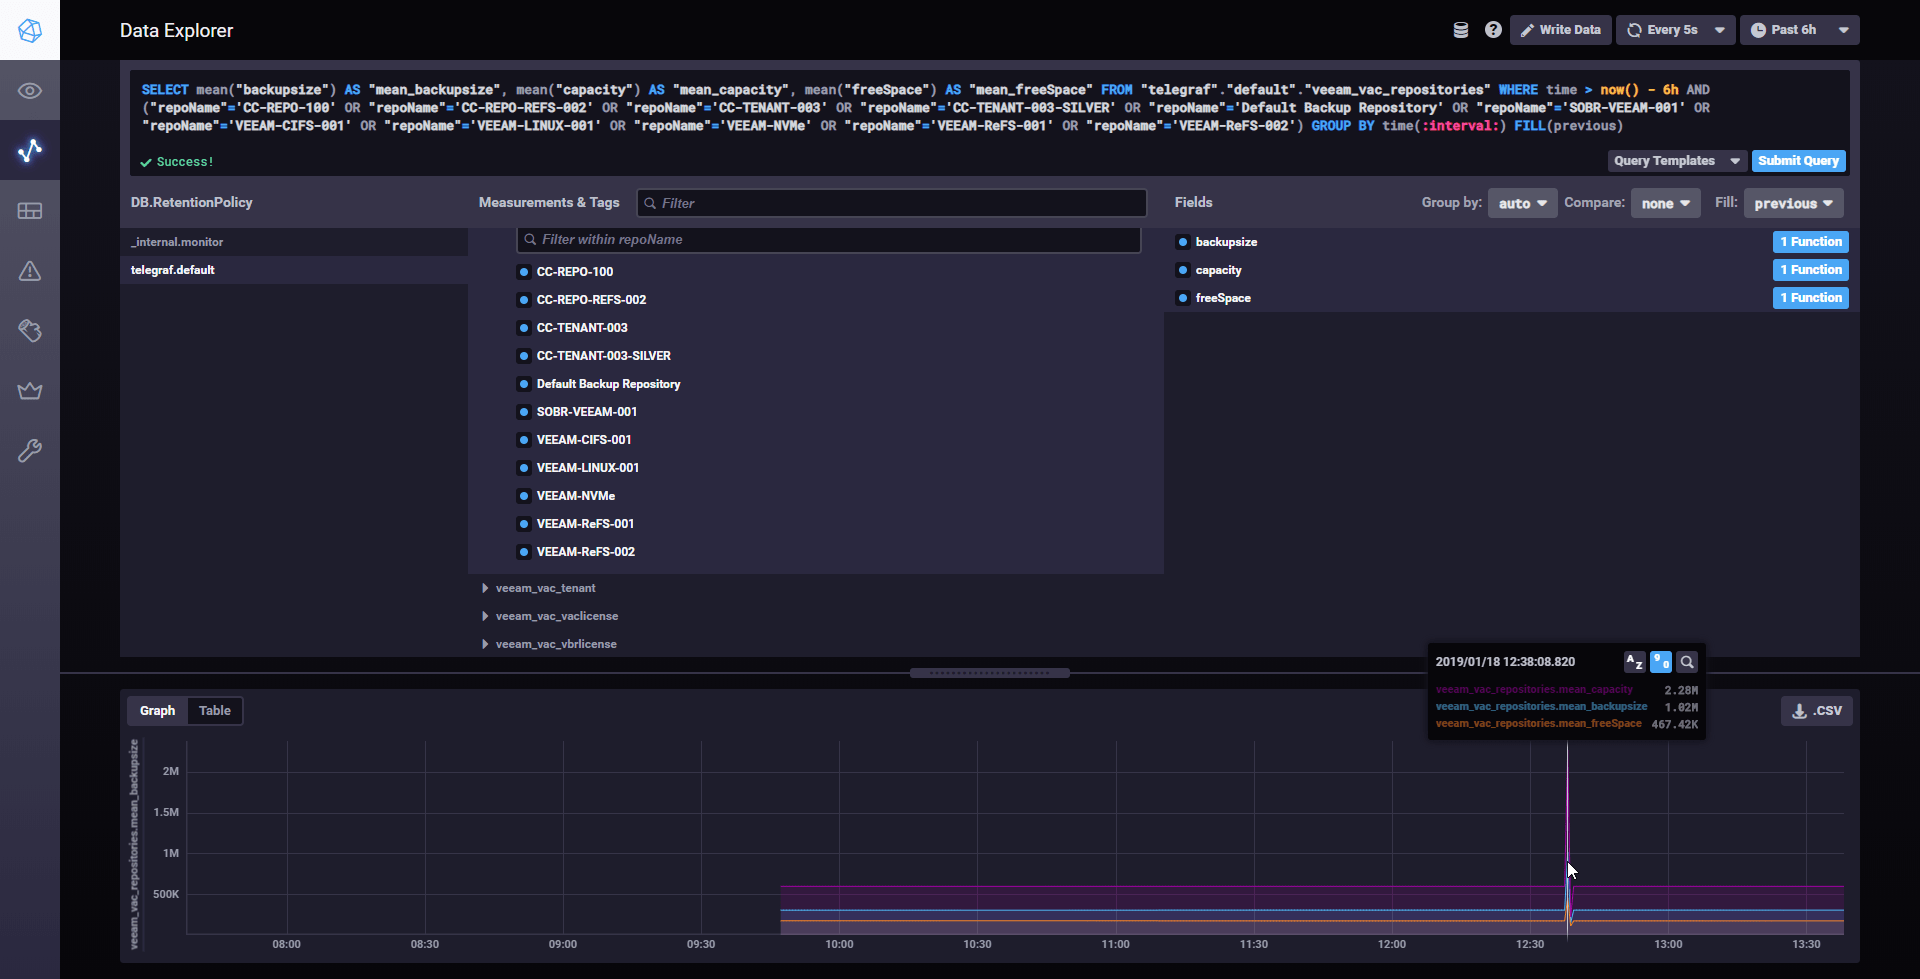
Check now that you can see all the new data on your Chronograf:
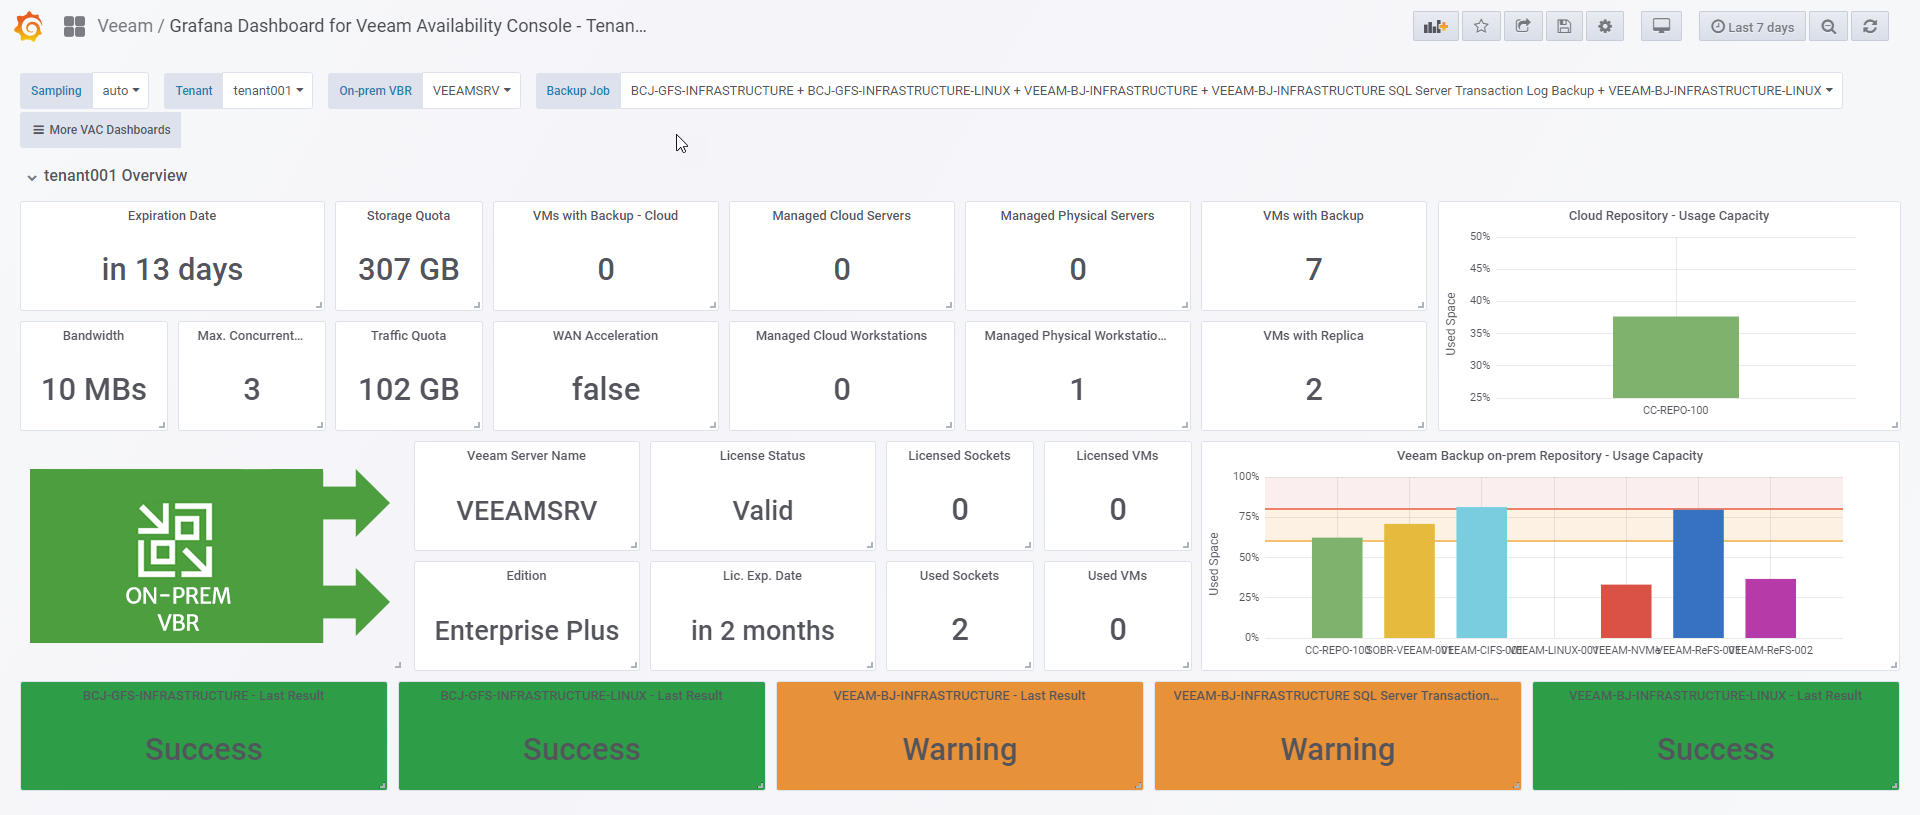
Then download or import this Dashboard to your Grafana, and you should see something similar to the next:
Data source config
Collector config:
Upload an updated version of an exported dashboard.json file from Grafana
| Revision | Description | Created | |
|---|---|---|---|
| Download |