
MK.IO Metrics Monitor
Welcome to MK.IO "High-performance, API-driven video infrastructure for modern video applications" Update 9/25/2025: Add Quotas section This dashboard shows how the metrics you can scrape from your MK.IO services can be used to monitor MK.IO workflow services such as: - Streaming Endpoints - OD Encode jobs - Live events For more about MK.IO, consult our customer documentation https://docs.mk.io/docs/overview Note: Metrics publishing is a chargeable service and is not enabled by default. Consult our API documentation on how to enable metrics publishing on your subscription: https://docs.mk.io/docs/monitor-your-services And api documentation: https://api.mk.io/doc/ui/?urls.primaryName=MK.IO%20Management%20API (endpoint is /api/v1/projects/{project_name}/metricsEndpoint)

Welcome to MK.IO
High-performance, API-driven video infrastructure for modern video applications
For more about MK.IO and to create an account, consult our customer documentation.
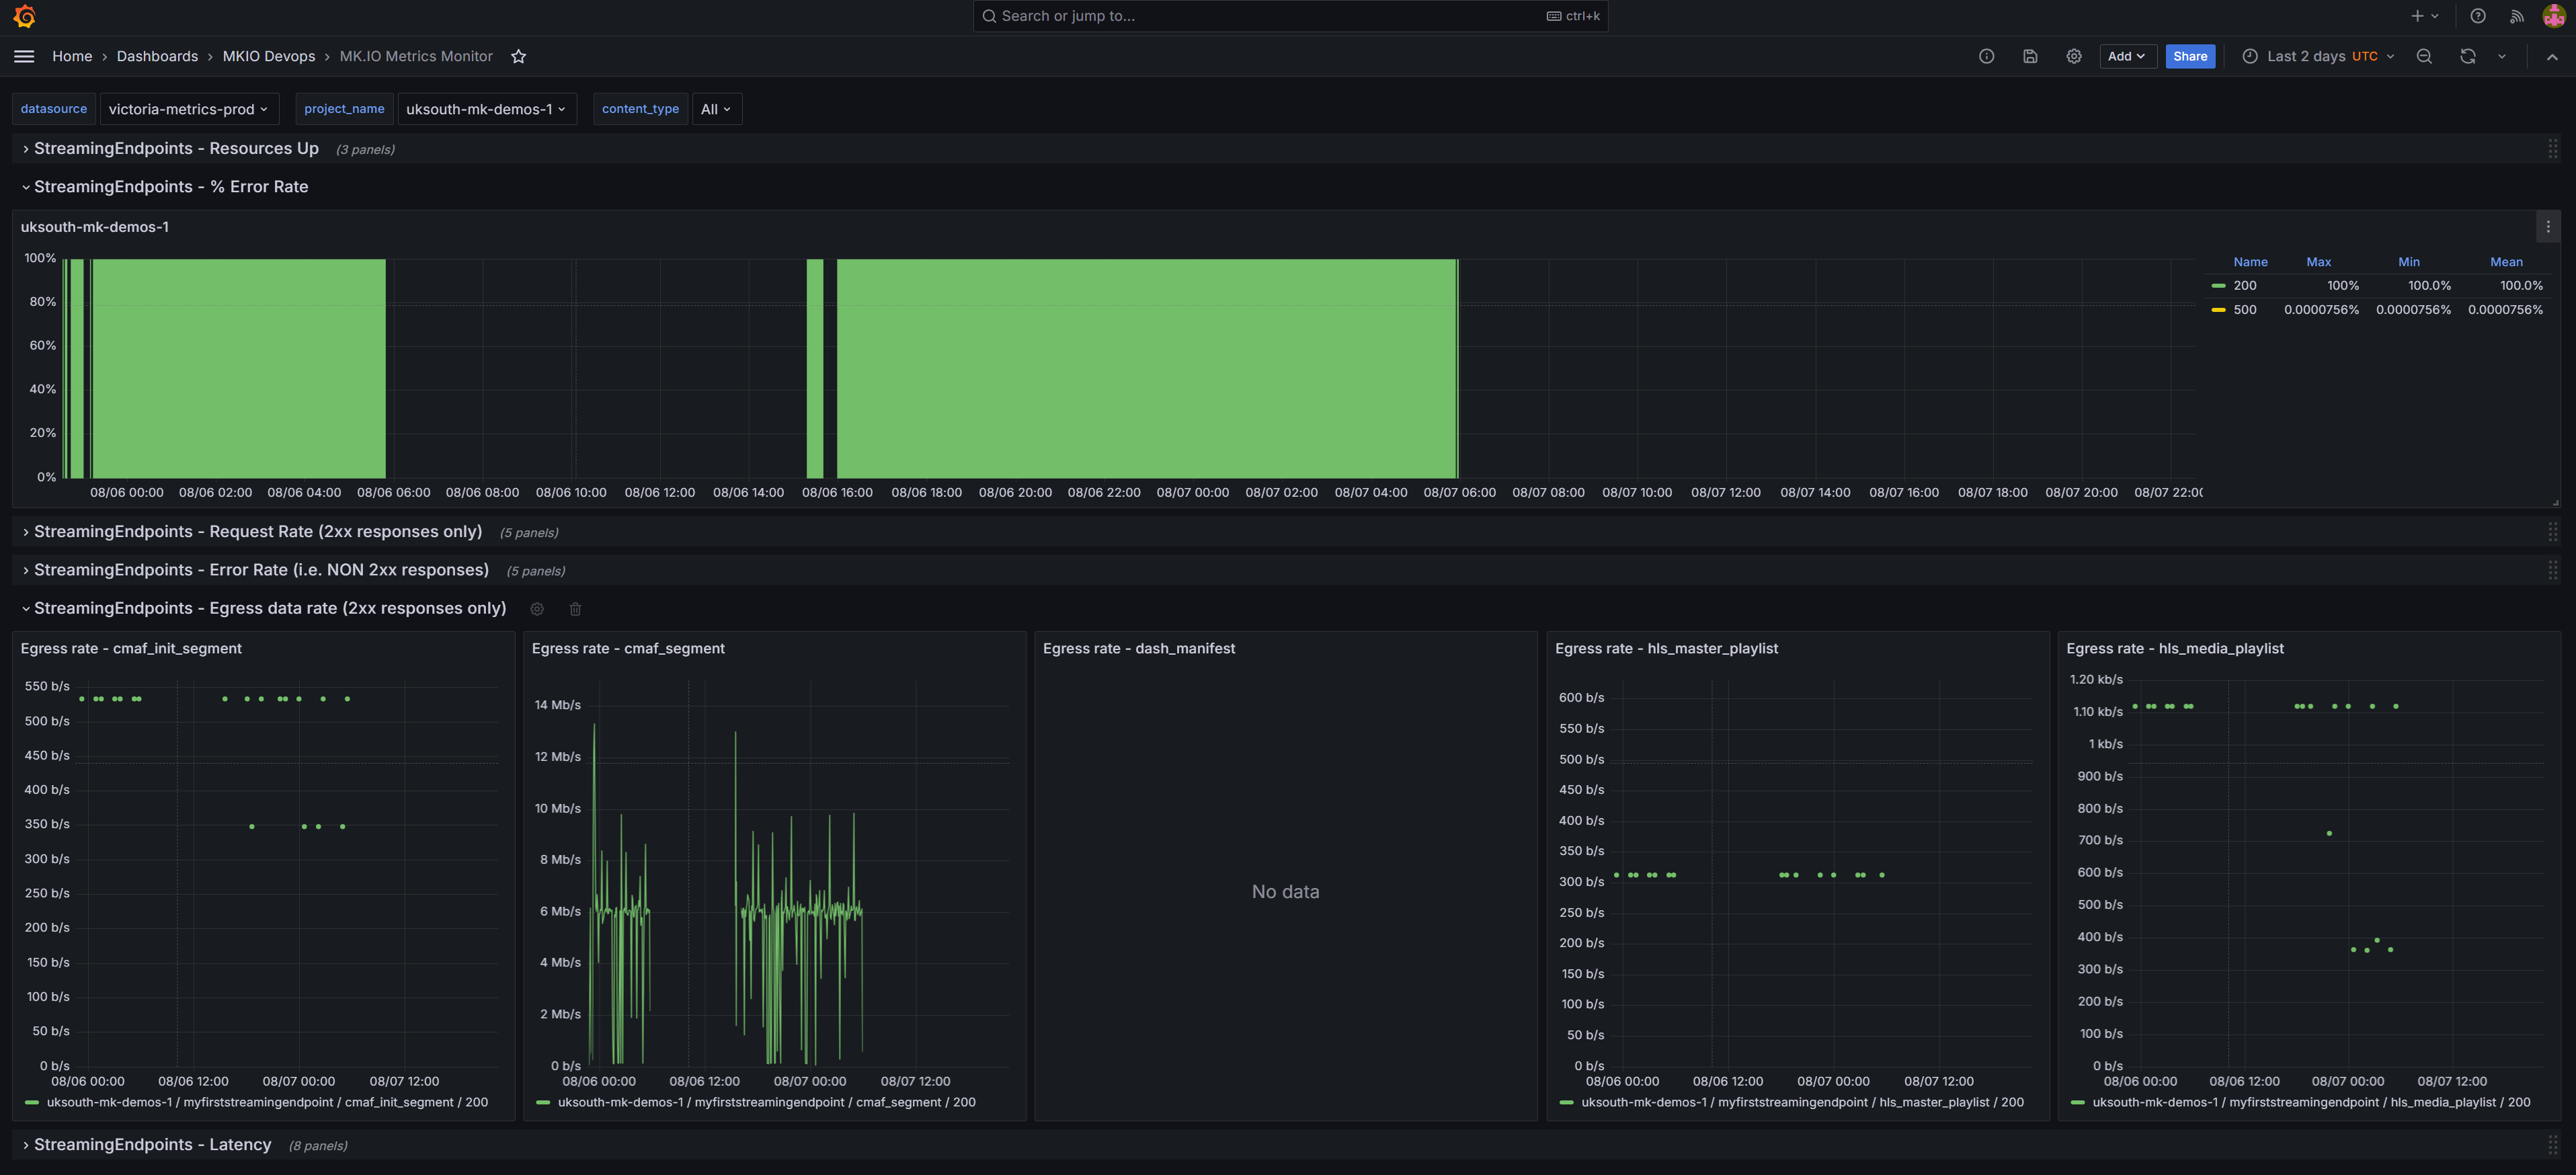
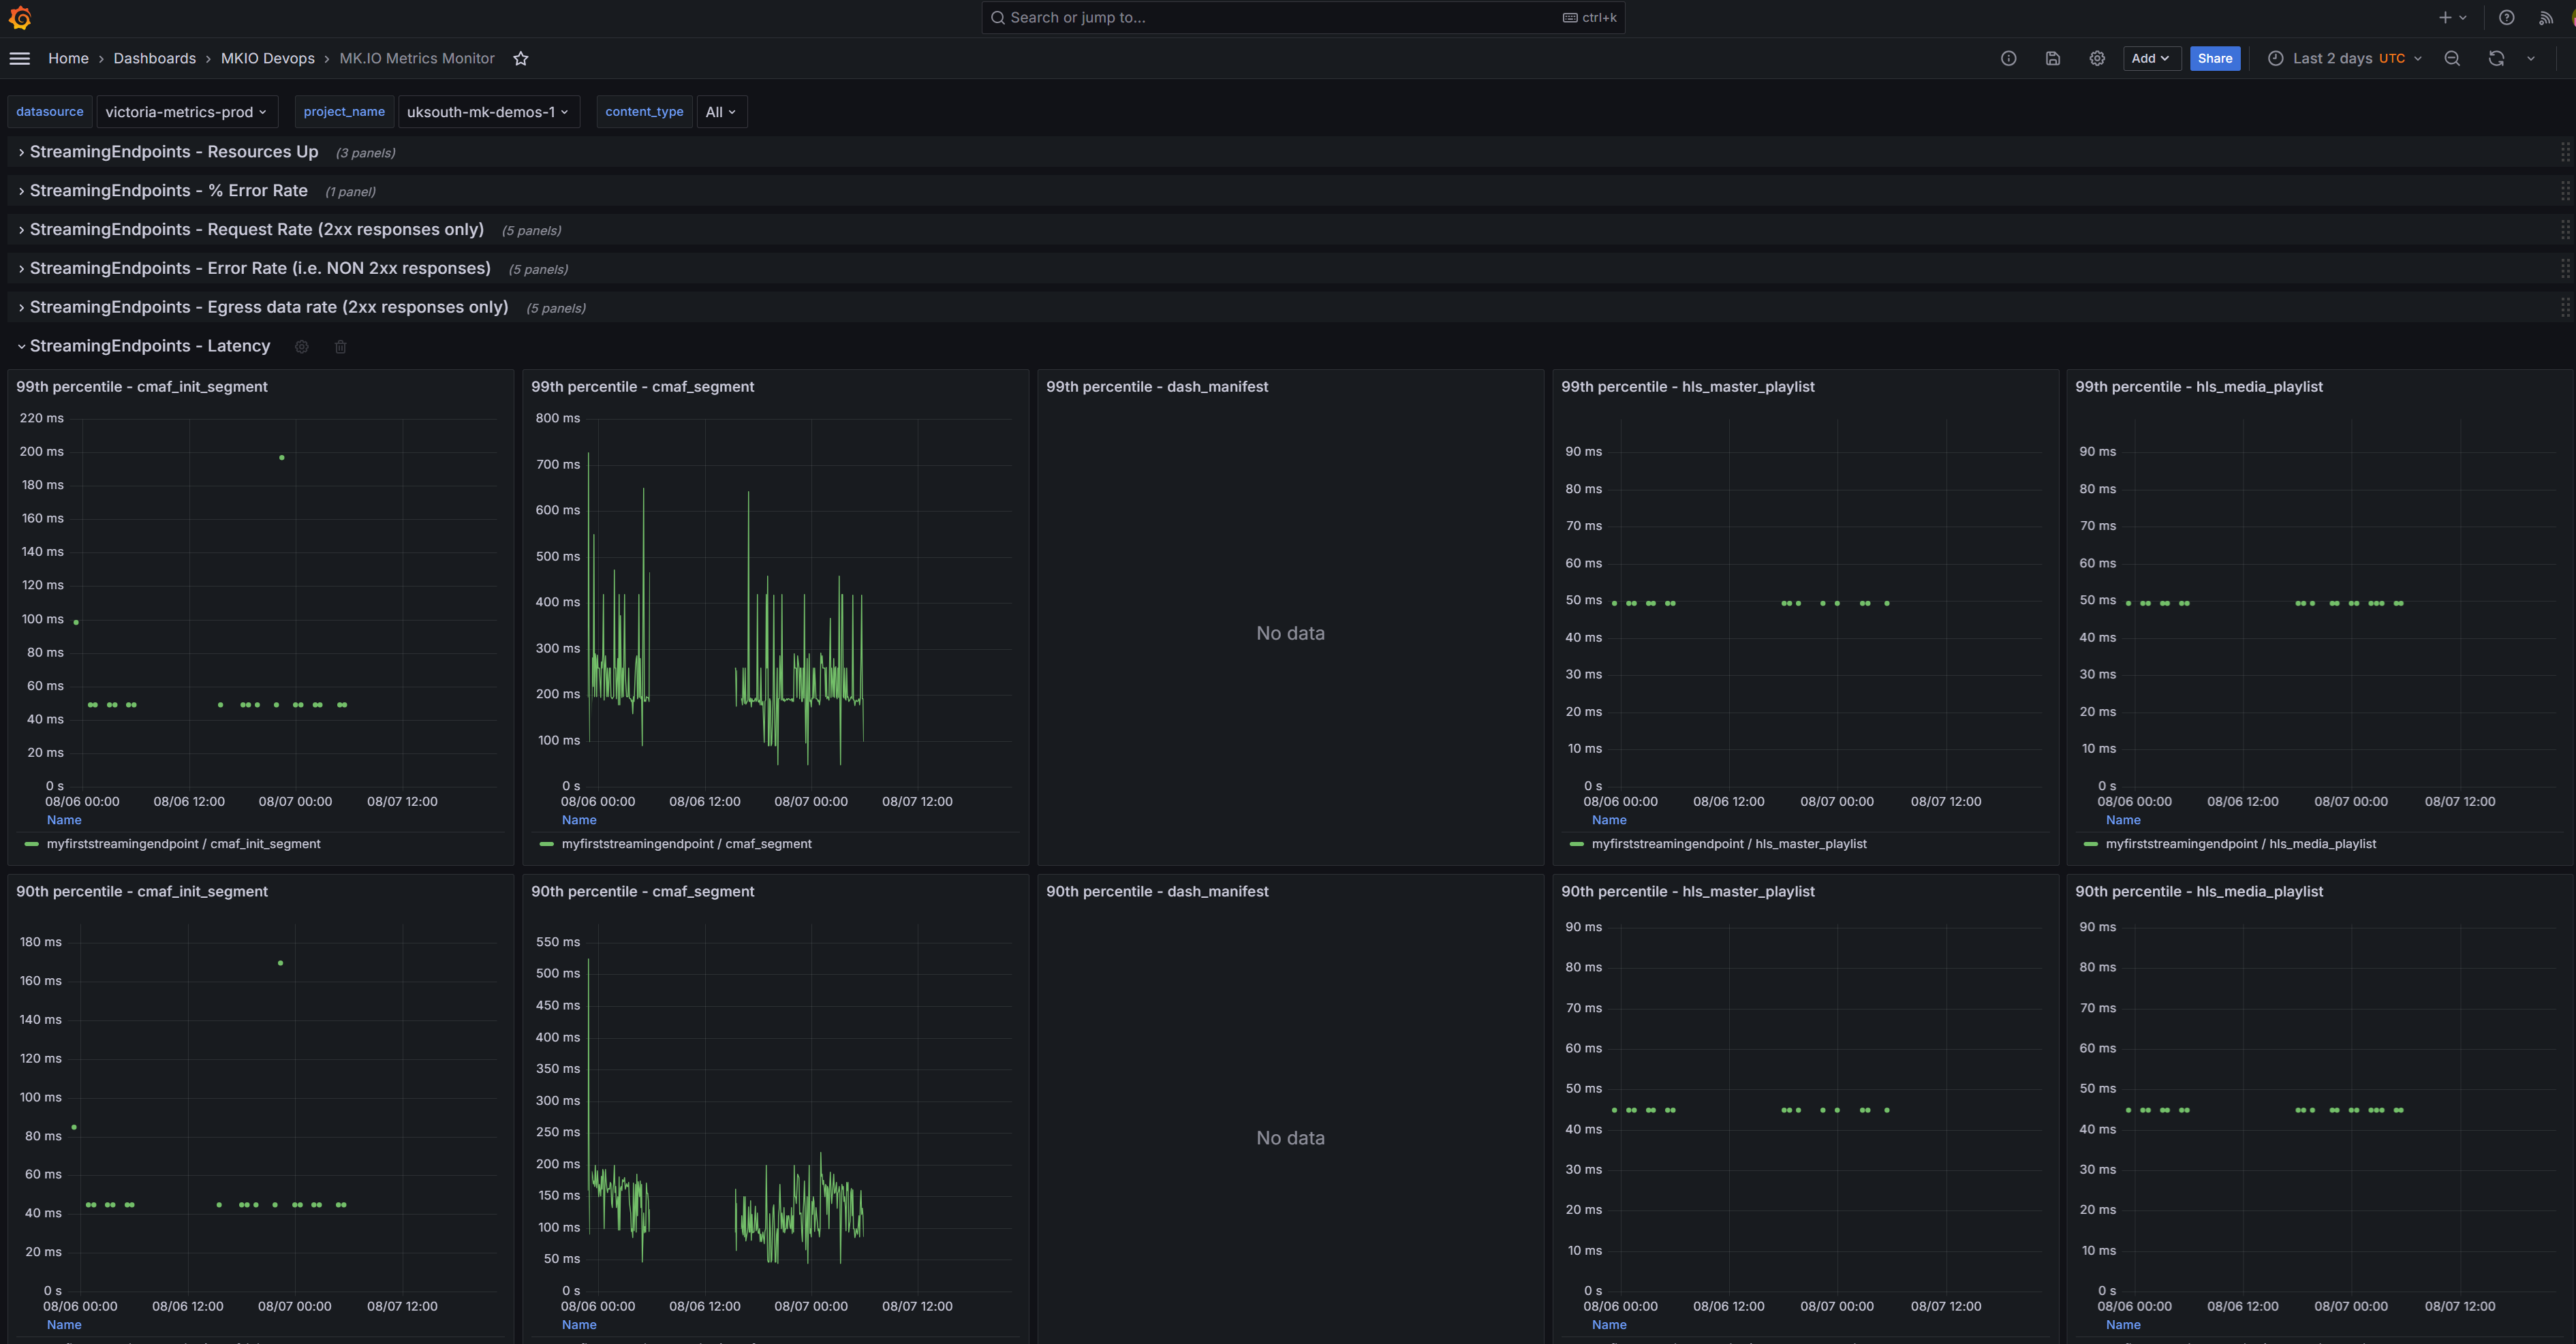
This dashboard showcases metrics you can scrape from your MK.IO services. They can be used to monitor, in realtime, MK.IO workflow services such as:
- Streaming Endpoints (Error rate, Bitrate & Latency)
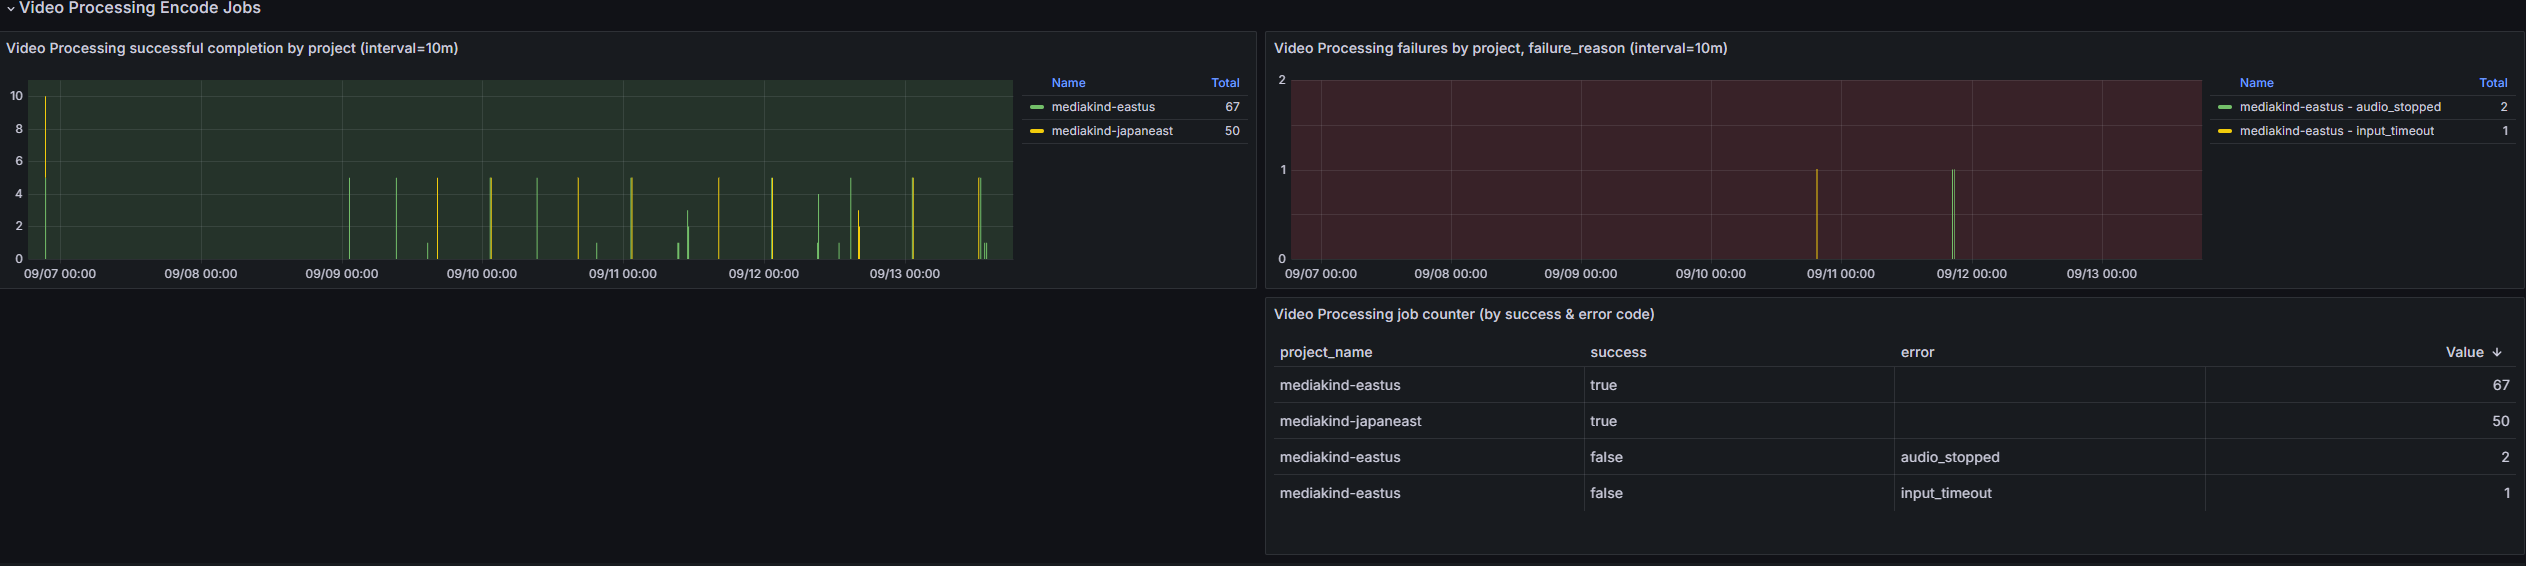
- OD Encode jobs (Count of successful & unsuccessful completed jobs)
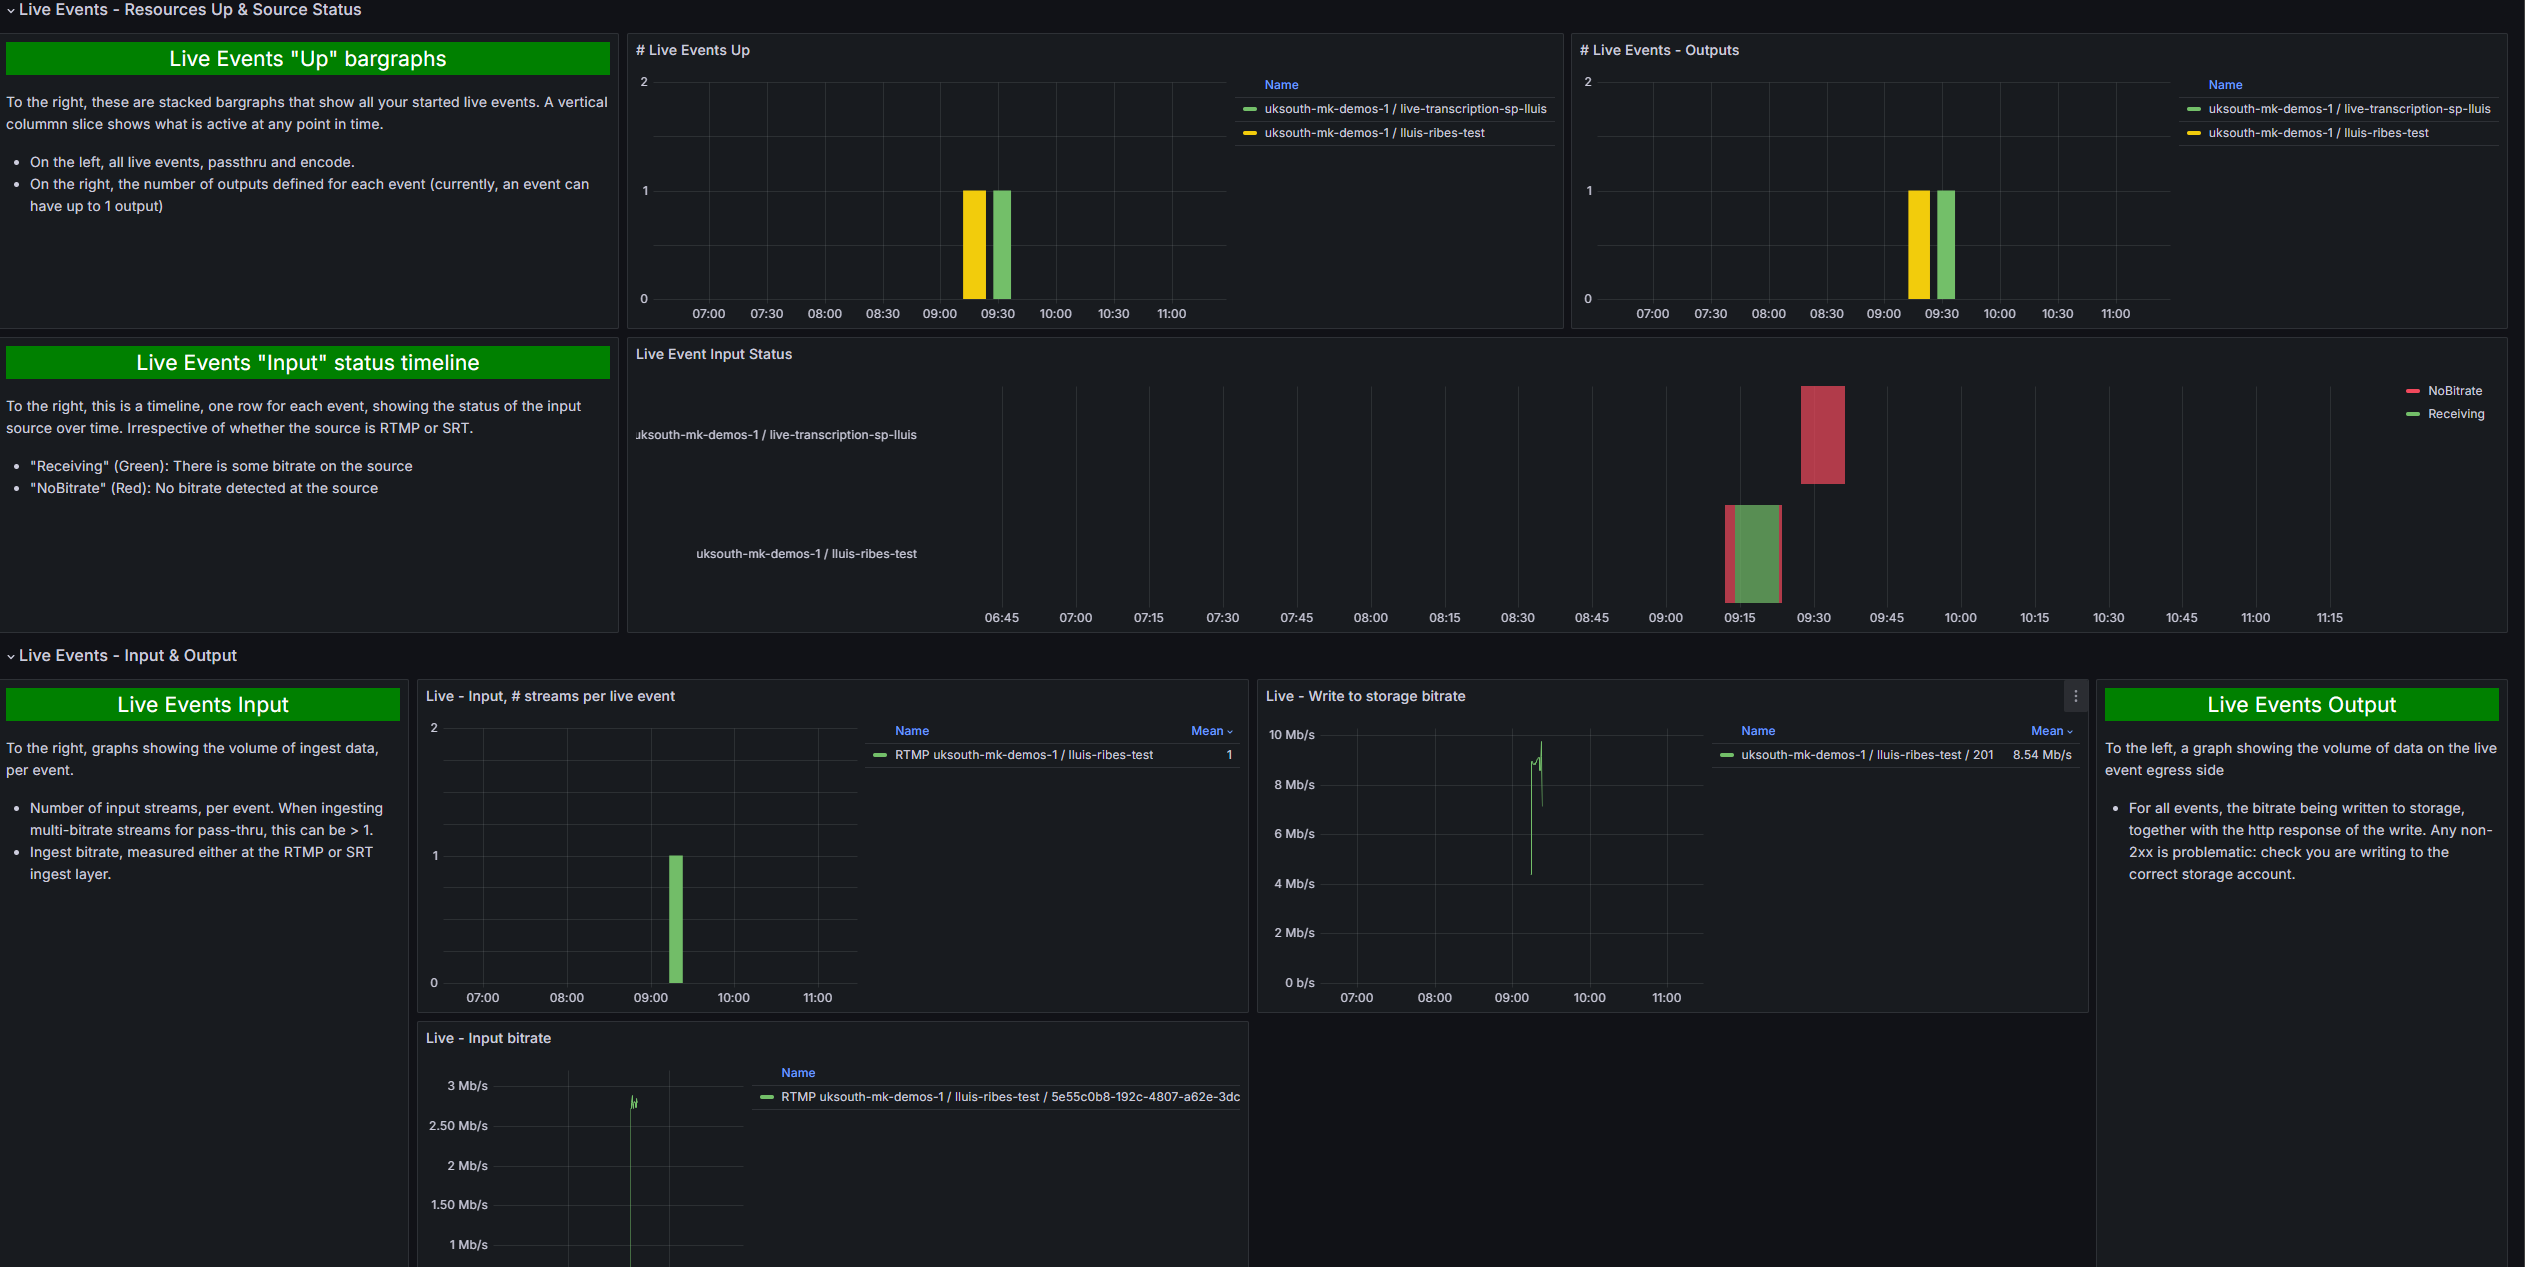
- Live events
Note: Metrics publishing is a chargeable service and is not enabled by default.
Enable metrics on your MK.IO subscription
- Consult our Setup Documentation
- Consult our API documentation on how to enable metrics publishing on your subscription. (Note this is a chargeable service. See MK.IO pricing for all our pricing information.)
- Enable on the MK.IO UI (Deliver / Usage & Metrics), or via the api endpoint
PATCH /api/v1/projects/{project_name}/metricsEndpoint - This will enable metrics and return the url of your public metrics endpoint and BasicAuth username and password. This endpoint is a prometheus-compatible "federate" endpoint.
- To receive the metrics, you will need to scrape this endpoint using a scrape mechanism of your choice.
Scrape metrics into Grafana Cloud
Once metrics are enabled in MK.IO, you can obtain a realtime stream of metrics by scraping the "federate" endpoint returned in the enable API call. Metrics are updated every 30s.
To scrape metrics into your Grafana Cloud account:
- If you do not already have a Grafana Cloud account, you can create a free account on grafana.com. The free account is free-forever for up to 10,000 metrics series. As a guide, a single streaming endpoint in mkio will be less than 500 series.
- create a "Metrics Endpoint" integration in Grafana Cloud. See the Metrics Endpoint documentation in Grafana Cloud.
- the "Scrape Job URL" should be set to the url that can be copied from the UI or returned in the api call. It will be of the form "https://<>/federate?<>"
- Use Basic Auth, with Username and Password set to the credentials that can be copied from the UI or returned in the mk.io api enable call.
- Normally, set the scrape interval to 1minute as a balance between your cost in Grafana cloud and timely data visibility.
- Import this dashboard into your Grafana Cloud account, or simply use the "Explore" tab to investigate metrics. All MK.IO metrics begin with "mk_".
Data source config
Collector config:
Upload an updated version of an exported dashboard.json file from Grafana
| Revision | Description | Created | |
|---|---|---|---|
| Download |