Etcd Cluster Overview
Etcd Cluster Overview showing details scraped from the etcd Prometheus metrics endpoint.
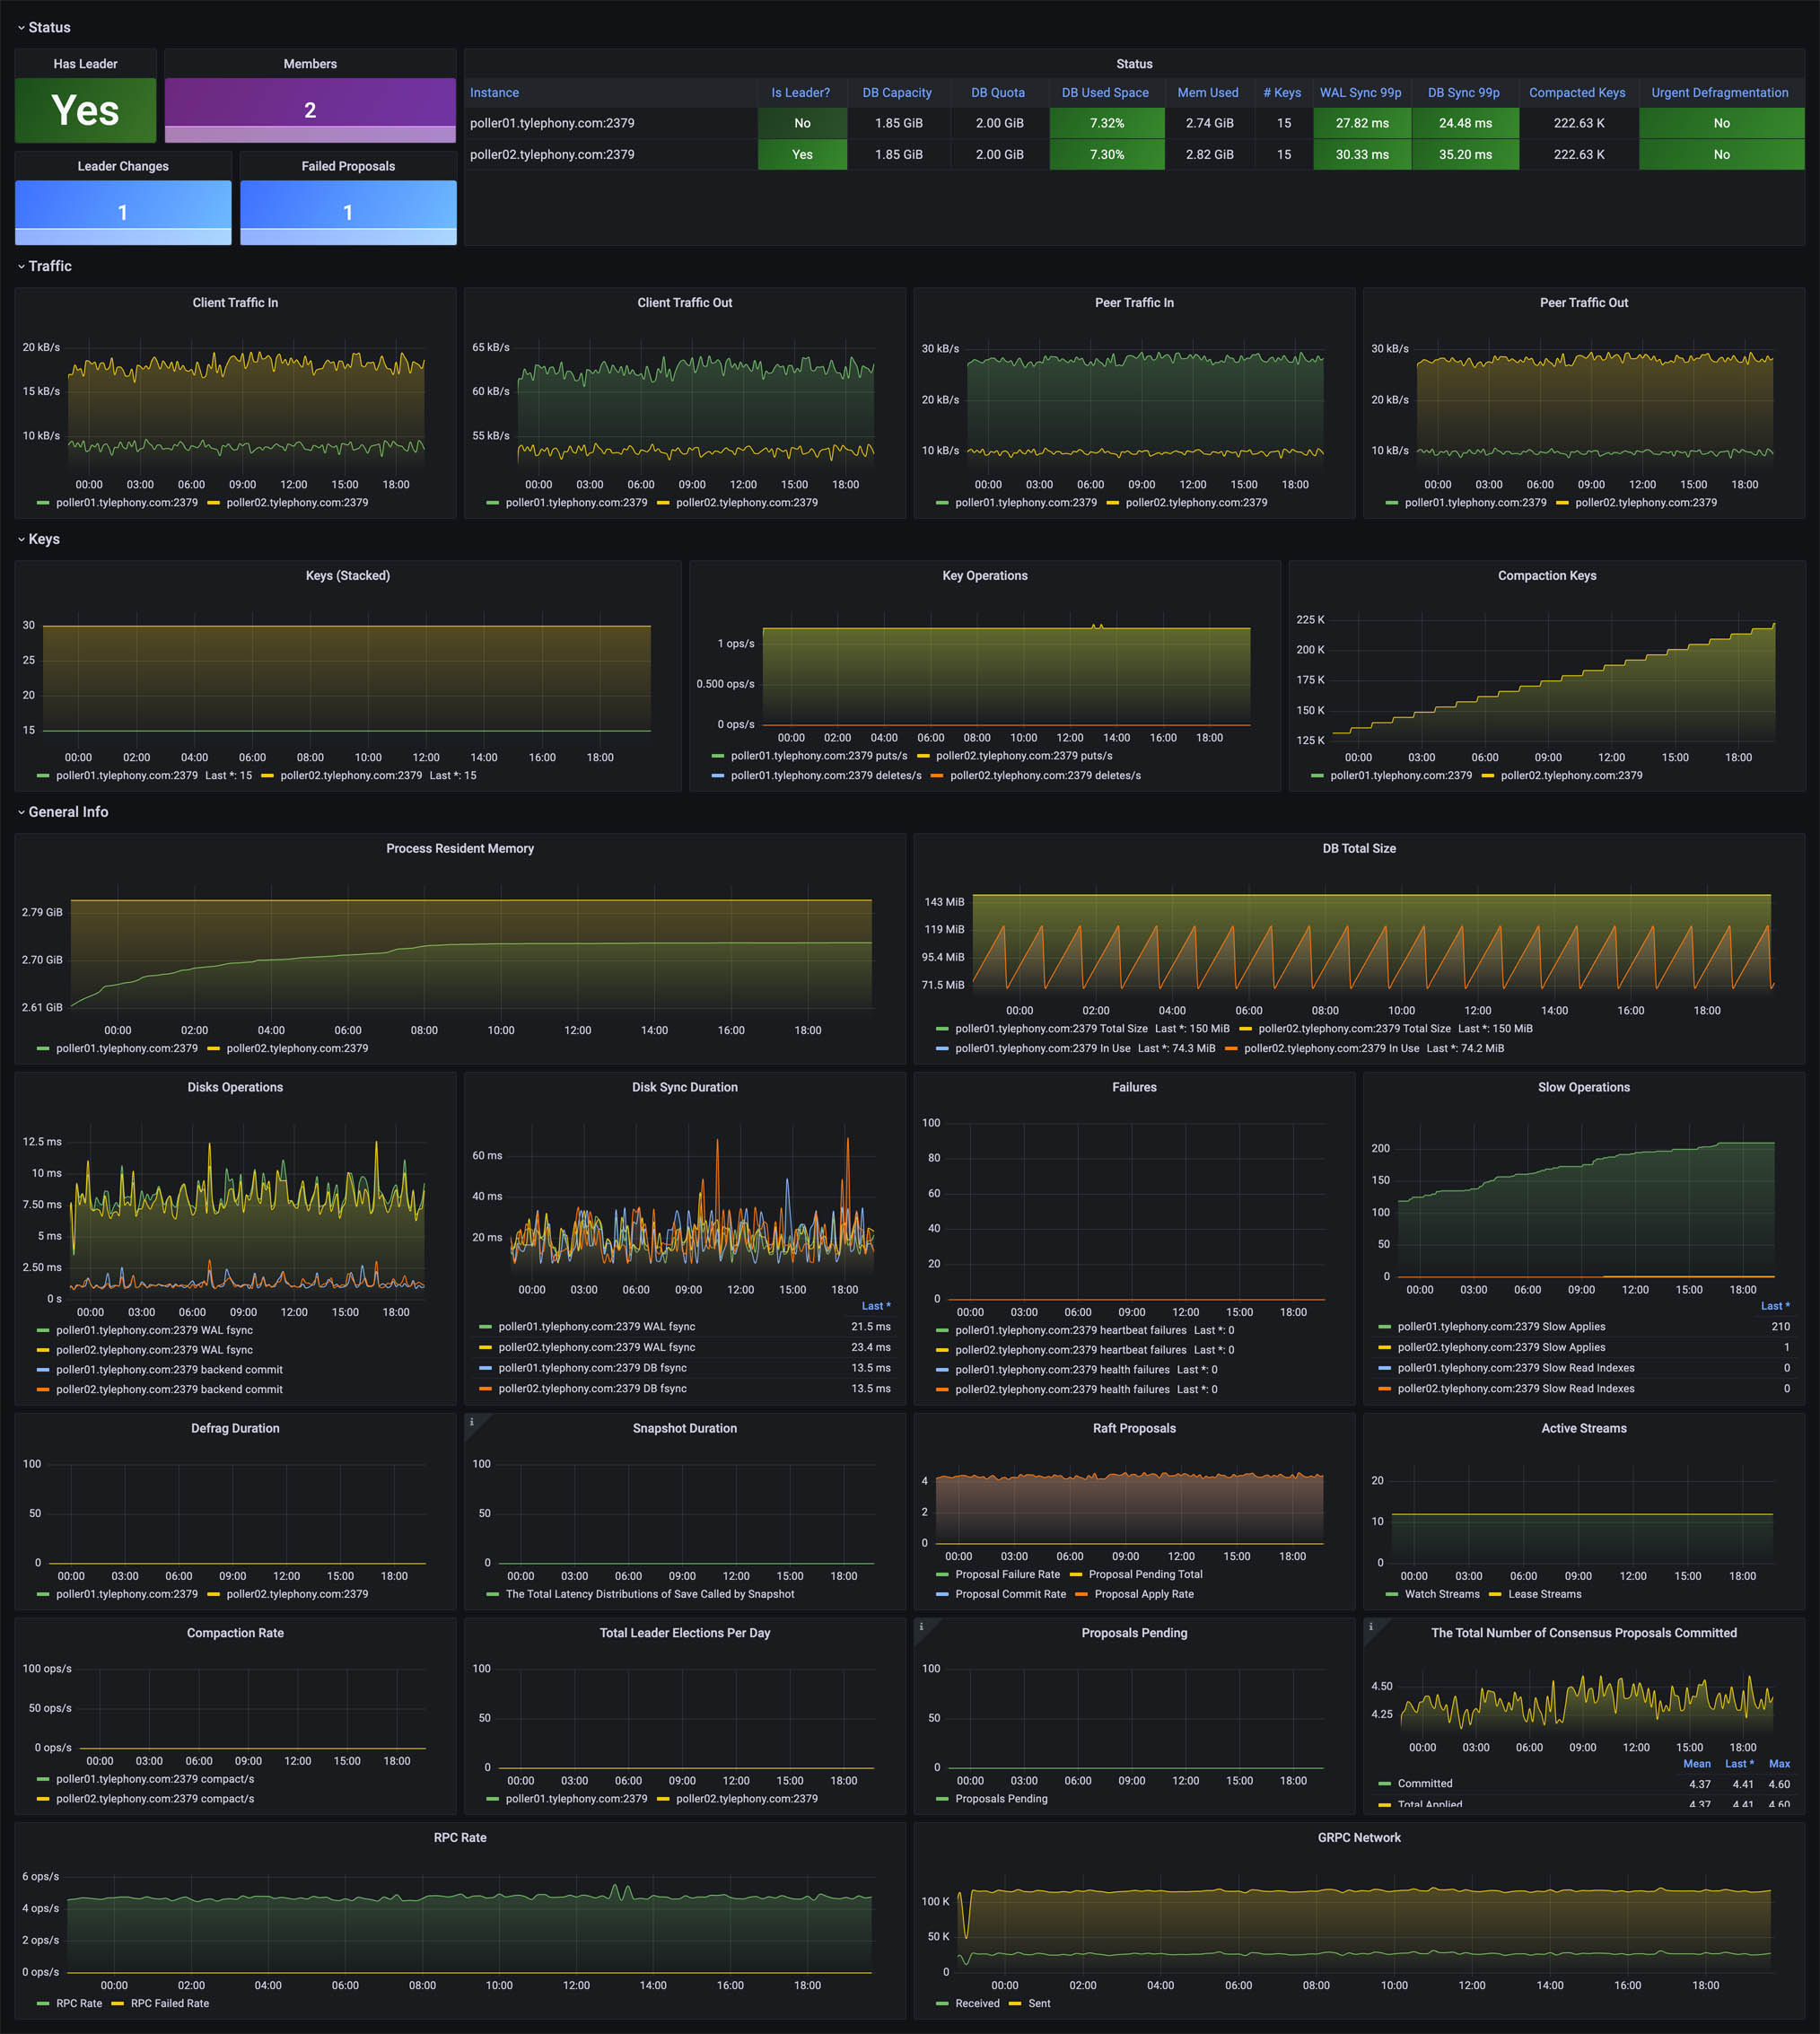
Etcd Cluster Overview showing details scraped from the etcd Prometheus metrics endpoint.
Example Scrape Config:
scrape_configs:
  - job_name: "etcd"
    scrape_interval: 15s
    metrics_path: /metrics
    static_configs:
      - targets: ['10.0.2.1:2379', '10.0.2.2:2379', '10.0.2.3:2379']
Based on https://grafana.com/grafana/dashboards/15308-etcd-cluster-overview/ with fixes for newer etcd versions.
Data source config
Collector type:
Collector plugins:
Collector config:
Revisions
Upload an updated version of an exported dashboard.json file from Grafana
| Revision | Description | Created | |
|---|---|---|---|
| Download |
etcd
Easily monitor etcd, a distributed key-value store, ewith Grafana Cloud's out-of-the-box monitoring solution.
Learn more