Etcd Cluster Overview
Etcd Cluster Overview showing details scraped from the etcd Prometheus metrics endpoint.
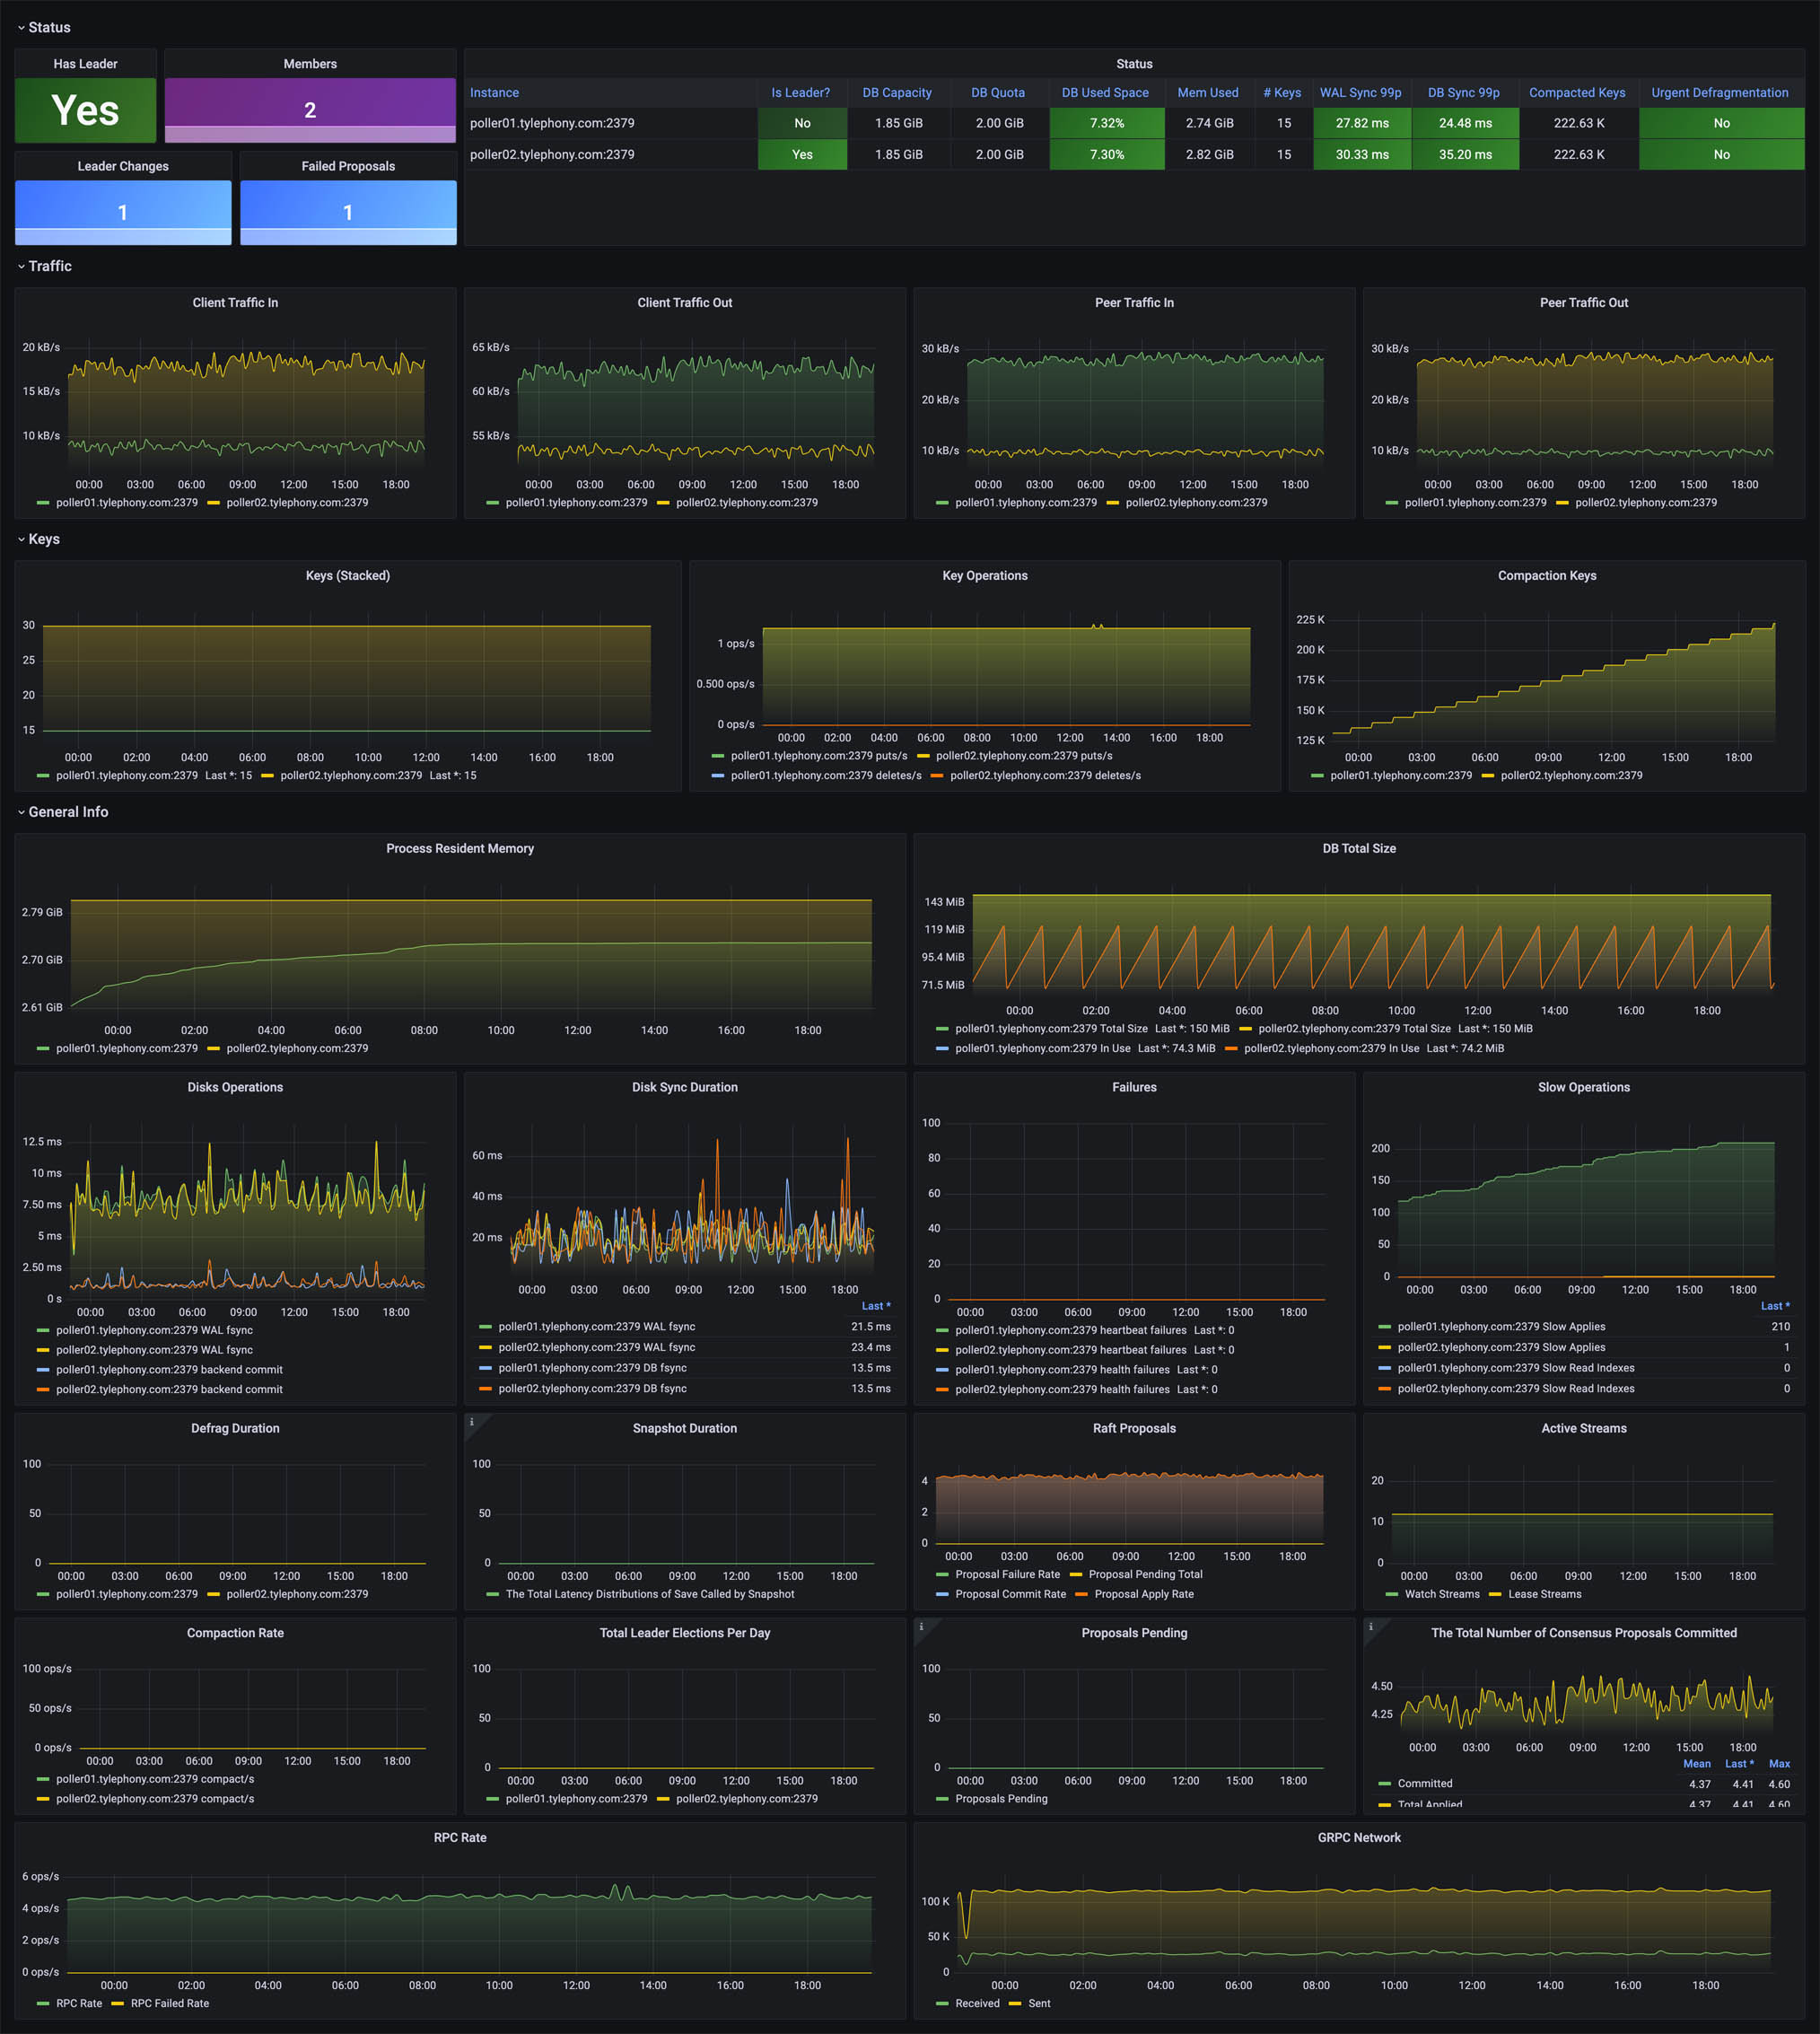
Etcd Cluster Overview showing details scraped from the etcd Prometheus metrics endpoint.
Example Scrape Config:
scrape_configs:
  - job_name: "etcd"
    scrape_interval: 15s
    metrics_path: /metrics
    static_configs:
      - targets: ["poller01.tylephony.com:2379", "poller02.tylephony.com:2379"]
Additional Grafana dashboards and projects may be found at my Lux4rd0 Labs Web site.
Data source config
Collector type:
Collector plugins:
Collector config:
Revisions
Upload an updated version of an exported dashboard.json file from Grafana
| Revision | Description | Created | |
|---|---|---|---|
| Download |
etcd
Easily monitor etcd, a distributed key-value store, ewith Grafana Cloud's out-of-the-box monitoring solution.
Learn more