GPU with Linux Server
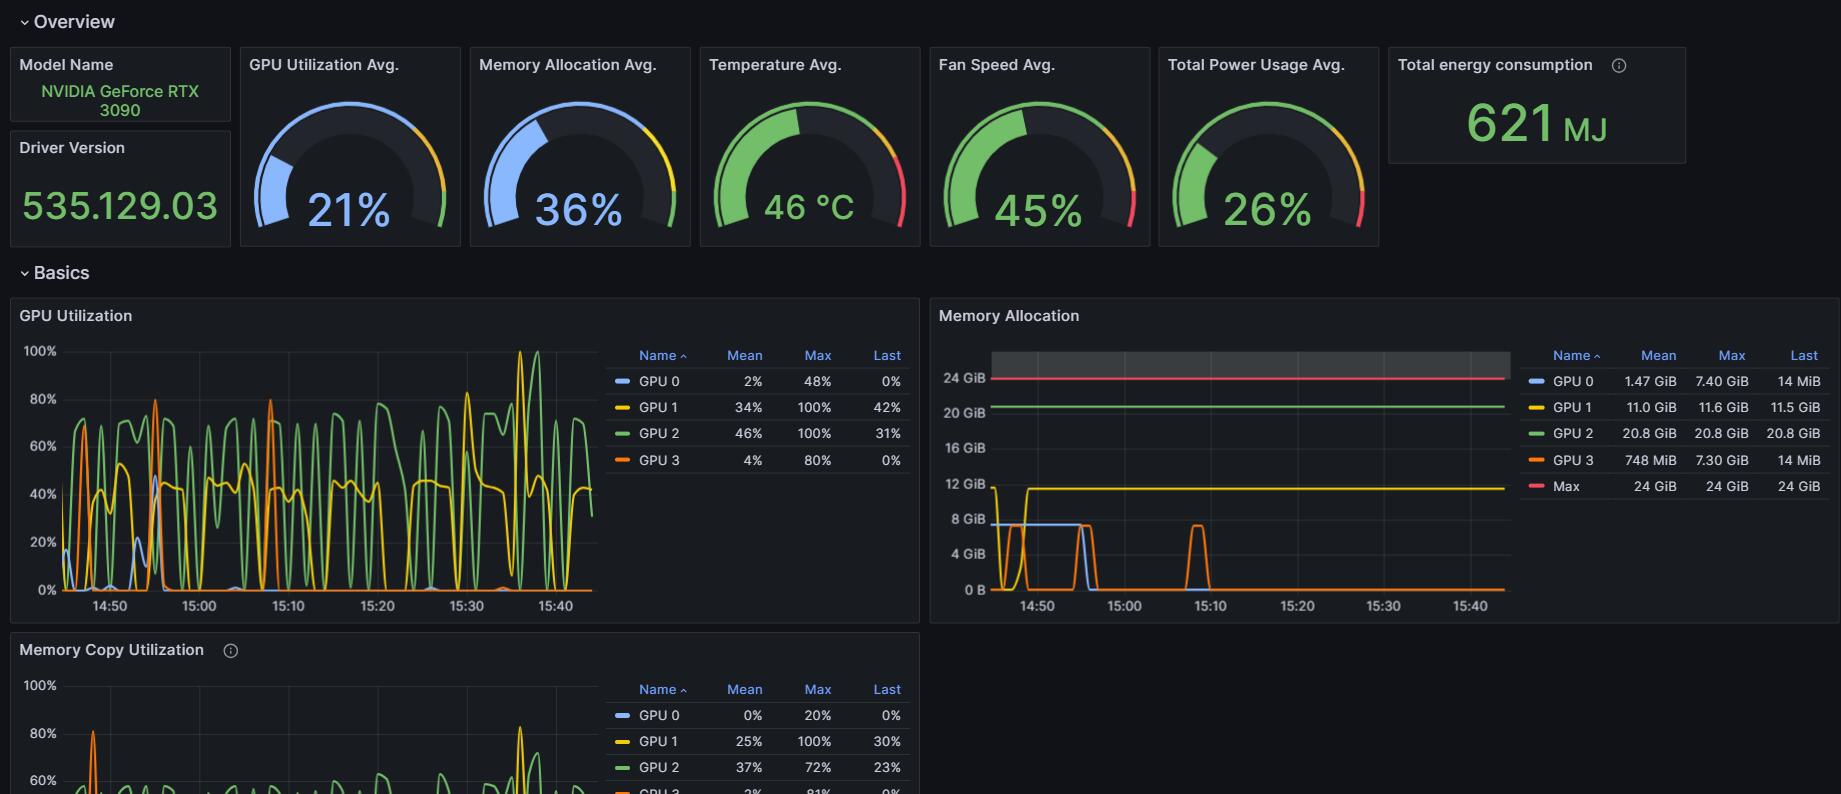
This dashboard is to display the metrics from DCGM Exporter, and it is designed to work with Linux Server integration
This dashboard is to display the metrics from DCGM Exporter and it is designed to work with Linux Server integration.
Important: set instance to your instance name as in linux server integration, here is a simple example of metric scrape_configs in grafana-agent.yaml
    - job_name: gpu_metrics
      static_configs:
        - targets: ['localhost:9400']
      relabel_configs:
      - replacement: 'your_instance_name'
        target_label: instance
Data source config
Collector config:
Upload an updated version of an exported dashboard.json file from Grafana
| Revision | Description | Created | |
|---|---|---|---|
| Download |
Linux Server
Monitor Linux with Grafana. Easily monitor your Linux deployment with Grafana Cloud's out-of-the-box monitoring solution.
Learn more
