AWS Prowler Dashboard
When running Prowler as a job/cron in a K8s cluster that also has Grafana Loki, the scan's results will be picked up by Loki. You can then use specific filters and parsing patterns to return what you'd like. This is just a sample of some of the metrics we like to track.
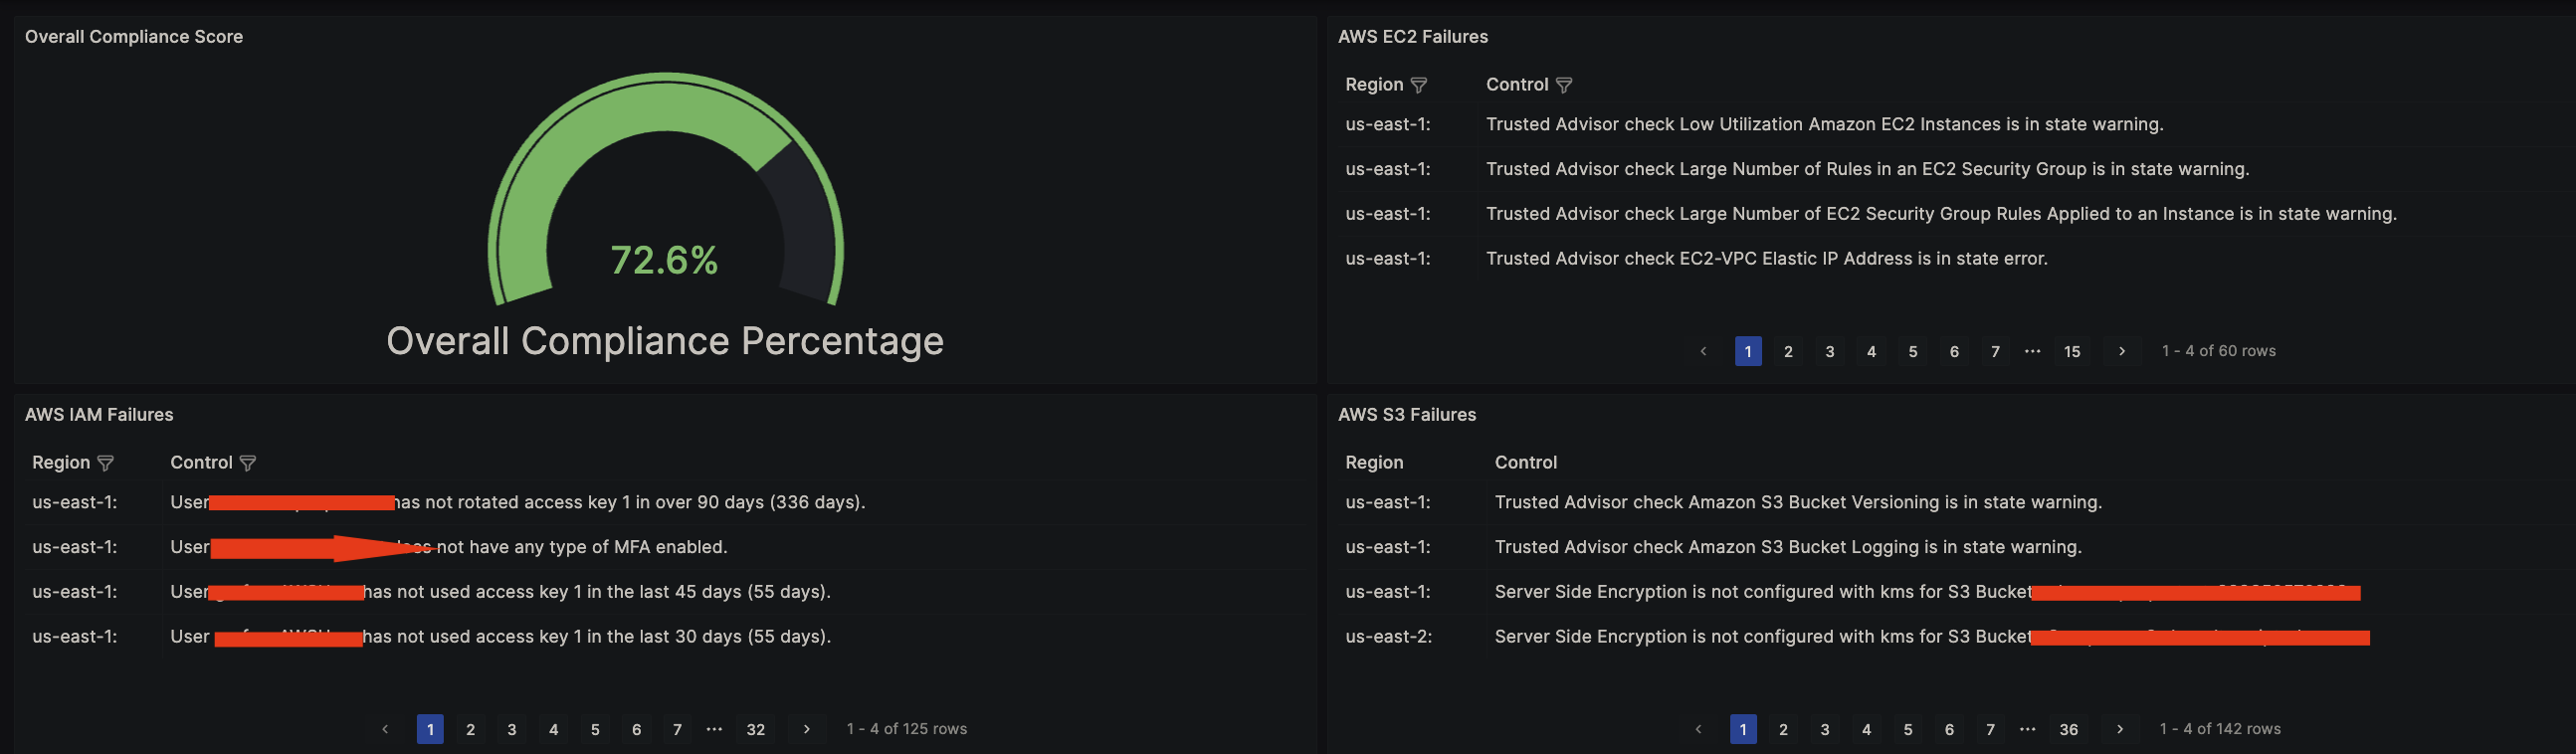
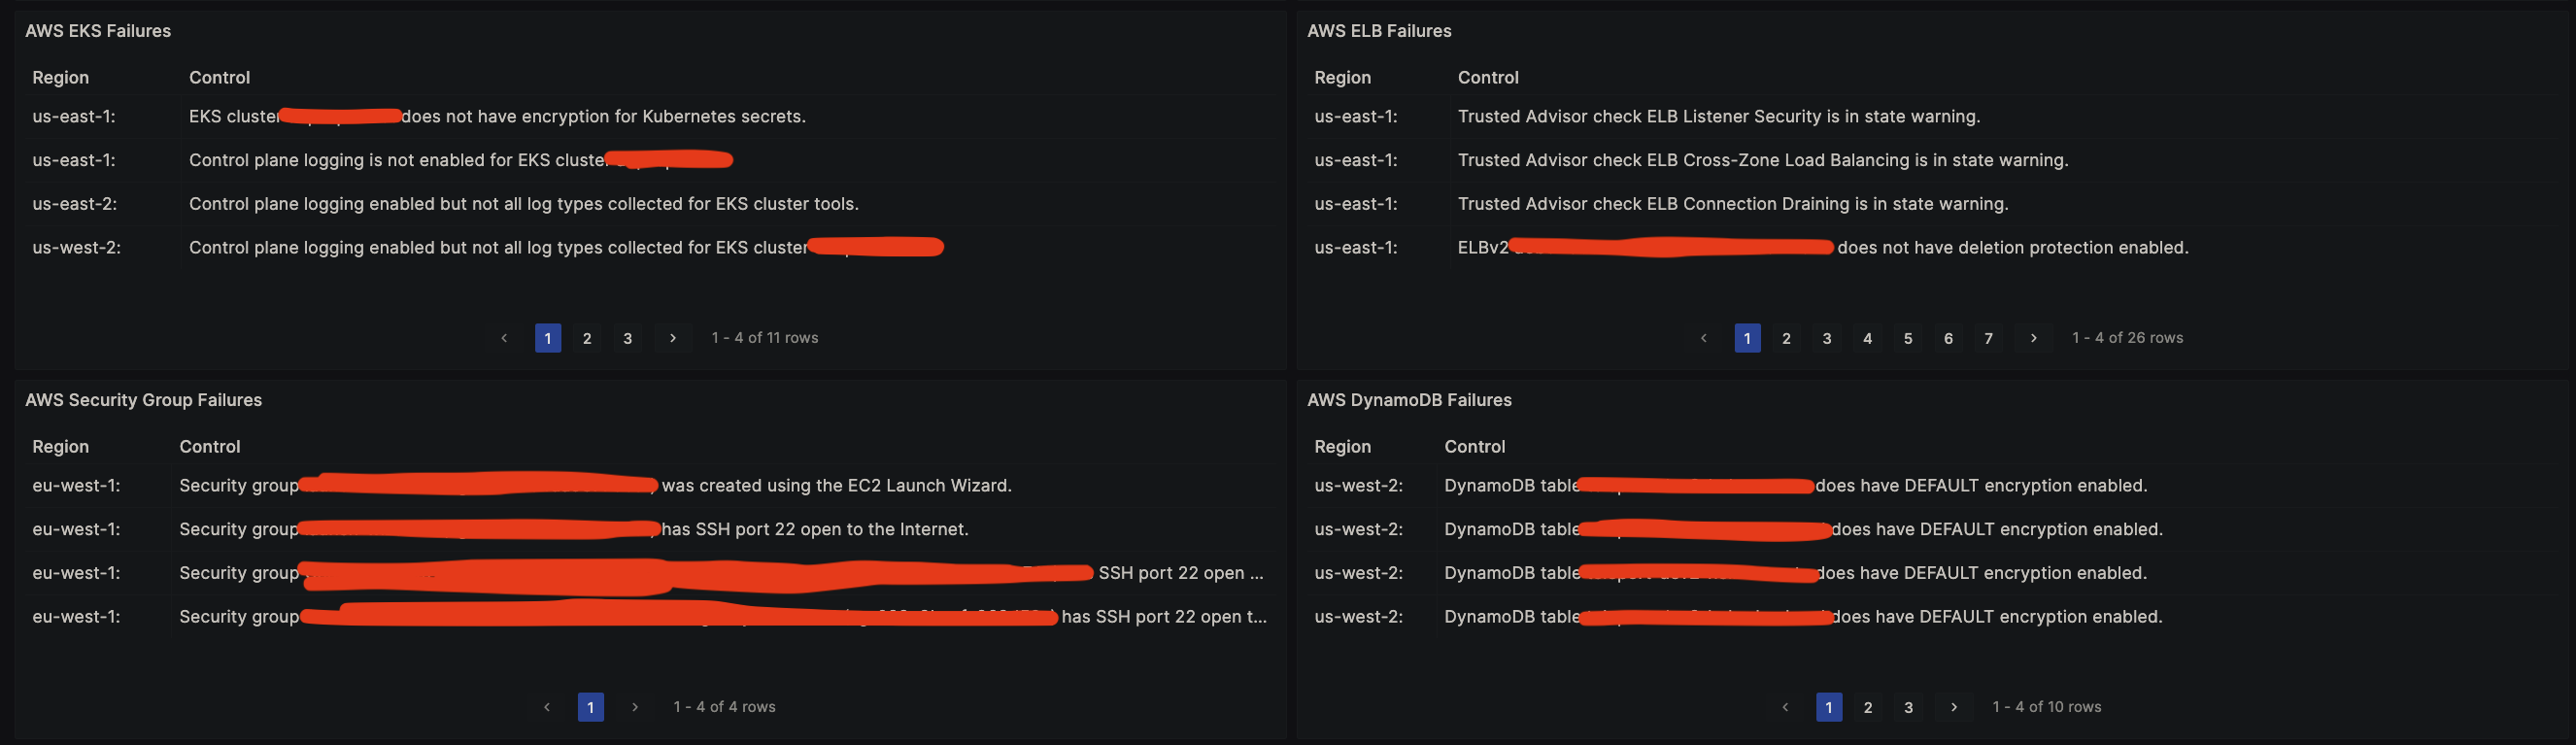
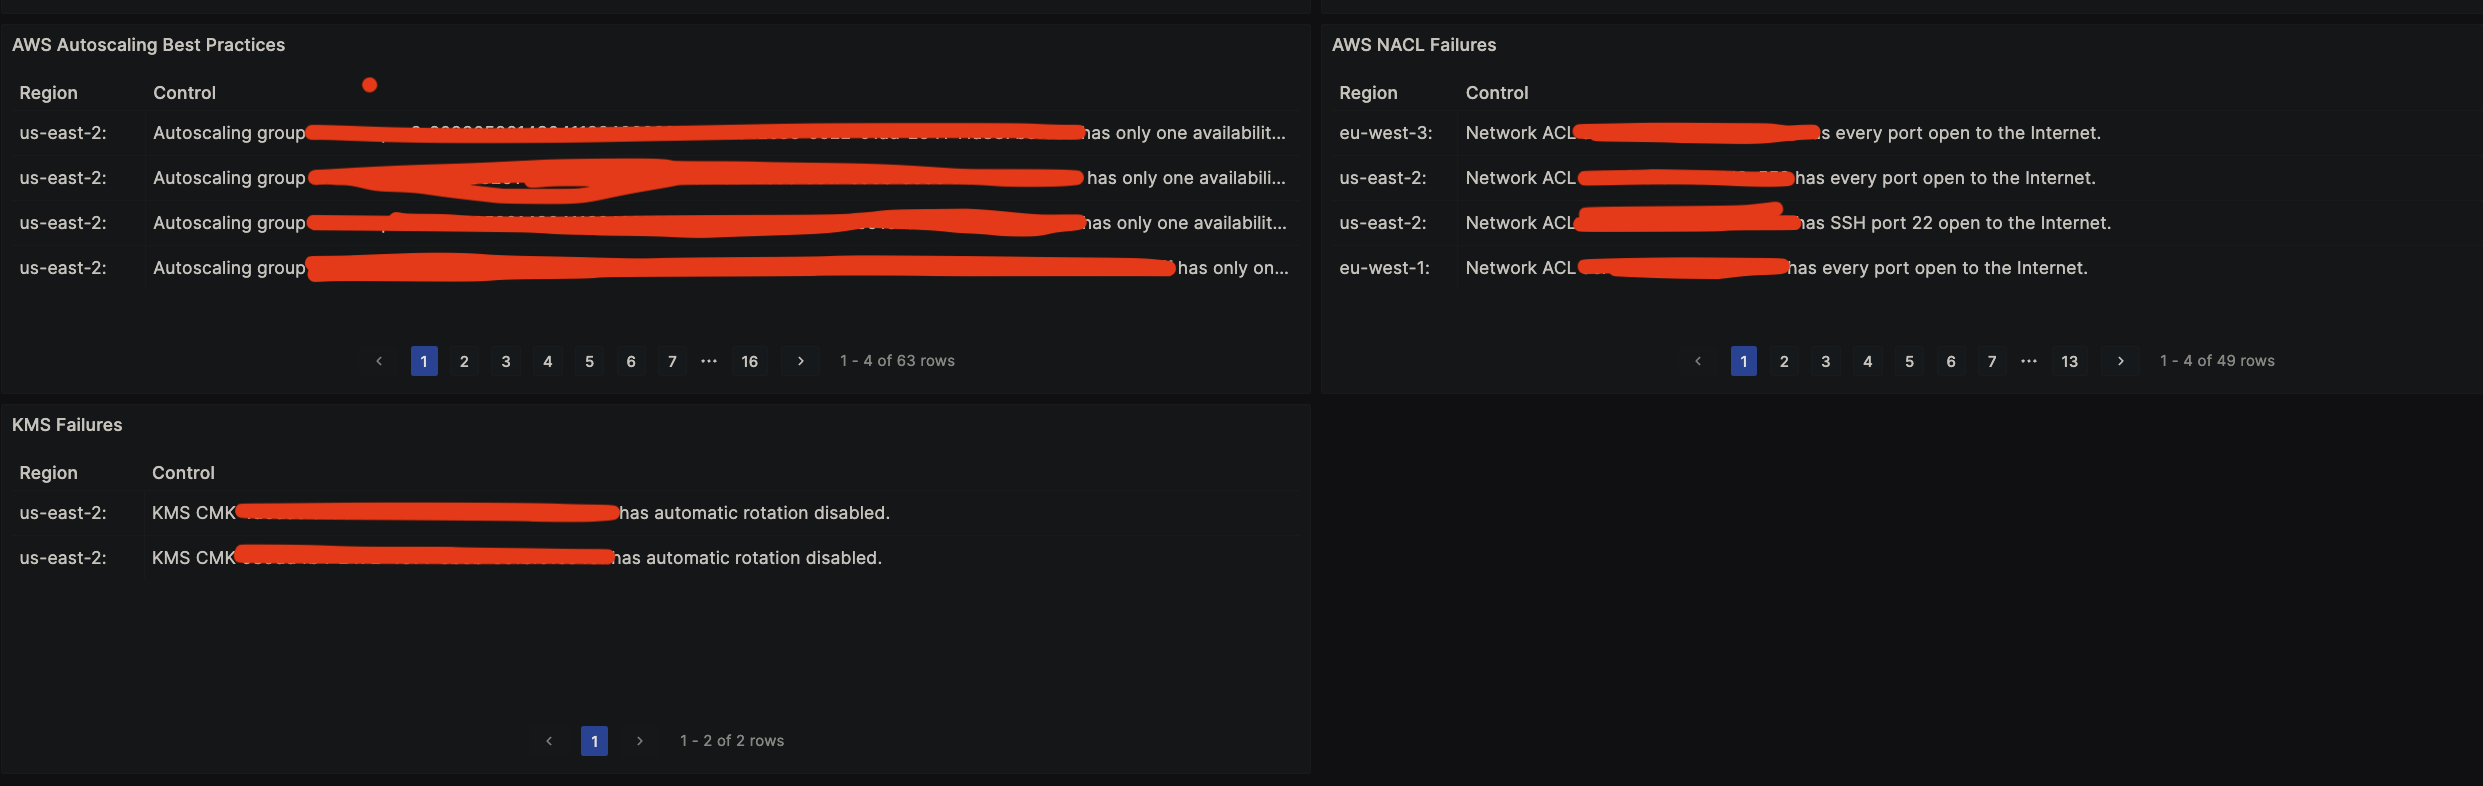
The AWS Prowler Dashboard dashboard uses the loki data source to create a Grafana dashboard with the gauge and table panels.
Data source config
Collector type:
Collector plugins:
Collector config:
Revisions
Upload an updated version of an exported dashboard.json file from Grafana
| Revision | Description | Created | |
|---|---|---|---|
| Download |
AWS
Easily visualize and alert on more than 60 Amazon Web Services (AWS) resources using the fully managed Grafana Cloud platform.
Learn more