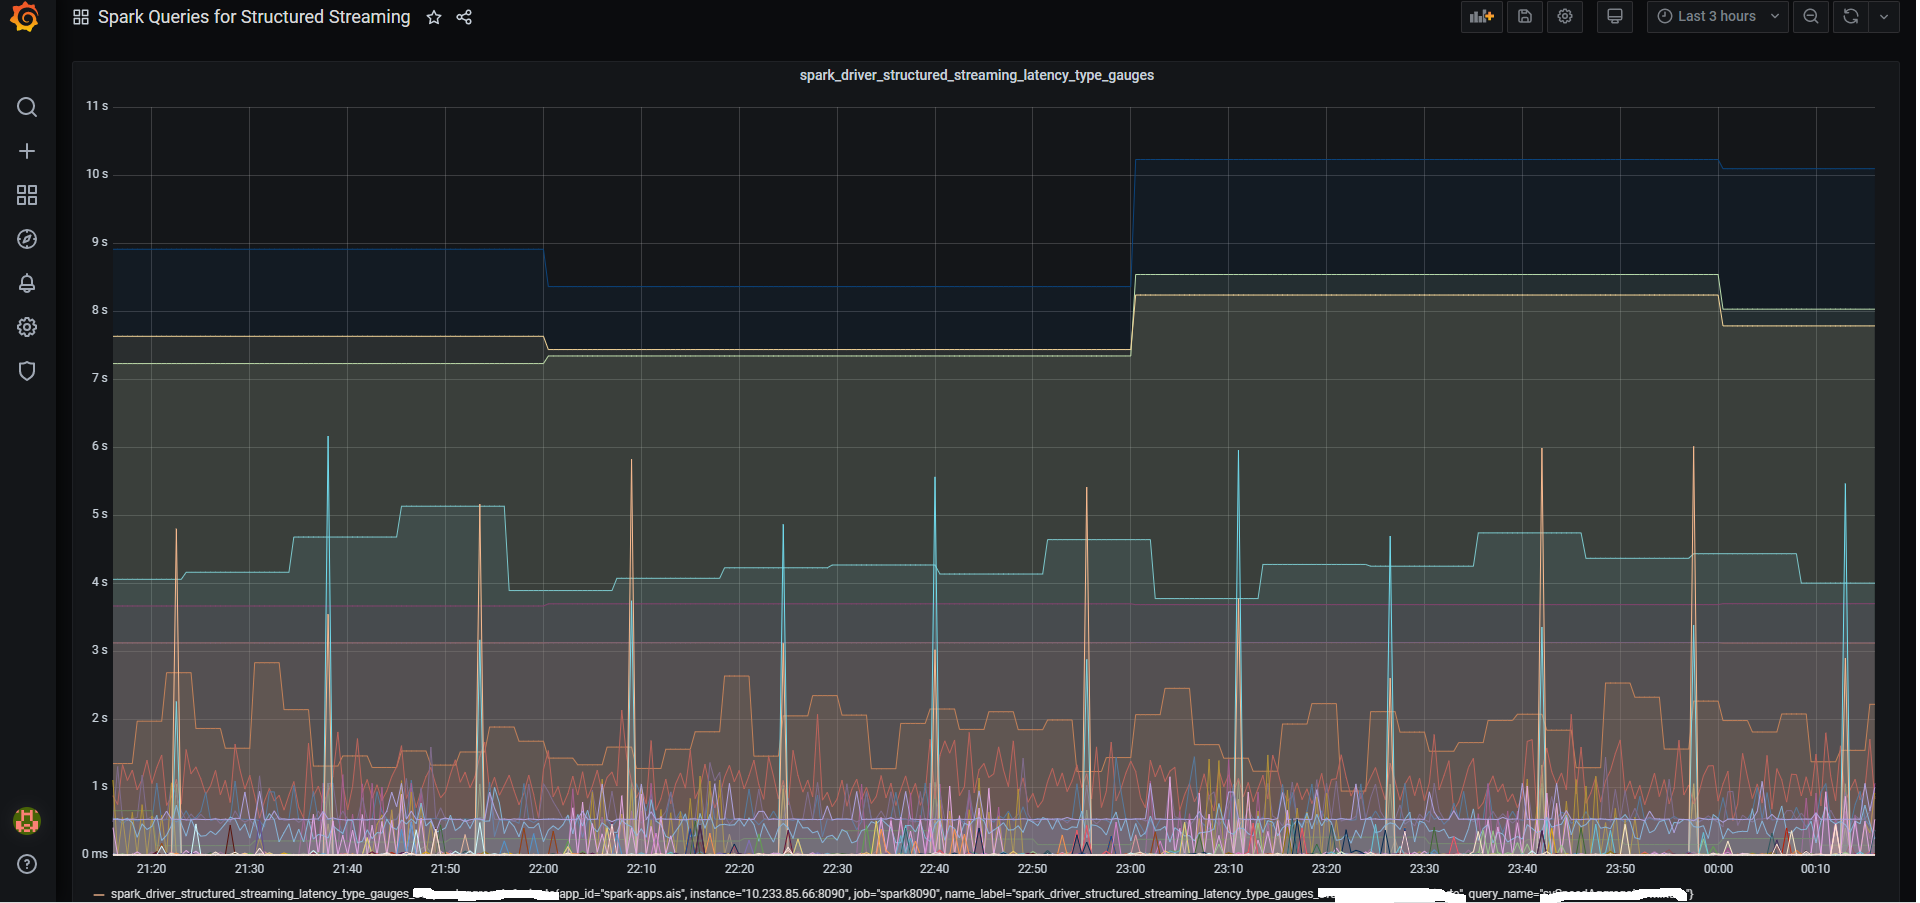
Spark Queries for Structured Streaming
Just plotting of all metrics, produced by enabled Prometheus output of Spark Structured Streaming jobs
To prometheus.yaml add
lowercaseOutputName: true attrNameSnakeCase: true rules:
These come from the application driver if it's a streaming application
Example: default/streaming.driver.com.example.ClassName.StreamingMetrics.streaming.lastCompletedBatch_schedulingDelay
- pattern: metrics<name=(\S+).(\S+).driver.(\S+).StreamingMetrics.streaming.(\S+)><>Value name: spark_streaming_driver_$4 type: GAUGE labels: app_namespace: "$1" app_id: "$2"
These come from the application driver if it's a structured streaming application
Example: default/sstreaming.driver.spark.streaming.QueryName.inputRate-total
- pattern: metrics<name=(\S+).(\S+).driver.spark.streaming.(\S+).(\S+)><>Value name: spark_structured_streaming_driver_$4 type: GAUGE labels: app_namespace: "$1" app_id: "$2" query_name: "$3"
These come from the application driver if it's a streaming application
Example: app-20160809000059-0000.driver.com.example.ClassName.StreamingMetrics.streaming.lastCompletedBatch_schedulingDelay
- pattern: "metrics<name=(.)\.driver\.(.)\.StreamingMetrics\.streaming\.(.*)><>Value" name: spark_driver_streaming_$3 type: GAUGE labels: app_id: "$1" app_name: "$2"
These come from the application driver if it's a structured streaming application
Example: app-20160809000059-0000.driver.spark.streaming.QueryName.inputRate-total
- pattern: "metrics<name=(.)\.driver\.spark\.streaming\.(.)\.(.*)><>Value" name: spark_driver_structured_streaming_$3_$2 type: GAUGE labels: app_id: "$1" query_name: "$2"
These come from the application executors
Example: default/spark-pi.0.executor.threadpool.activeTasks
- pattern: metrics<name=(\S+).(\S+).(\S+).executor.(\S+)><>Value name: spark_executor_$4 type: GAUGE labels: app_namespace: "$1" app_id: "$2" executor_id: "$3"
These come from the application driver
Example: default/spark-pi.driver.DAGScheduler.stage.failedStages
- pattern: metrics<name=(\S+).(\S+).driver.(BlockManager|DAGScheduler|jvm).(\S+)><>Value name: spark_driver_$3_$4 type: GAUGE labels: app_namespace: "$1" app_id: "$2"
These come from the application driver
Emulate timers for DAGScheduler like messagePRocessingTime
- pattern: metrics<name=(\S+).(\S+).driver.DAGScheduler.(.*)><>Count name: spark_driver_DAGScheduler_$3_count type: COUNTER labels: app_namespace: "$1" app_id: "$2"
HiveExternalCatalog is of type counter
- pattern: metrics<name=(\S+).(\S+).driver.HiveExternalCatalog.(.*)><>Count name: spark_driver_HiveExternalCatalog_$3_count type: COUNTER labels: app_namespace: "$1" app_id: "$2"
These come from the application driver
Emulate histograms for CodeGenerator
- pattern: metrics<name=(\S+).(\S+).driver.CodeGenerator.(.*)><>Count name: spark_driver_CodeGenerator_$3_count type: COUNTER labels: app_namespace: "$1" app_id: "$2"
These come from the application driver
Emulate timer (keep only count attribute) plus counters for LiveListenerBus
- pattern: metrics<name=(\S+).(\S+).driver.LiveListenerBus.(.*)><>Count name: spark_driver_LiveListenerBus_$3_count type: COUNTER labels: app_namespace: "$1" app_id: "$2"
Get Gauge type metrics for LiveListenerBus
- pattern: metrics<name=(\S+).(\S+).driver.LiveListenerBus.(.*)><>Value name: spark_driver_LiveListenerBus_$3 type: GAUGE labels: app_namespace: "$1" app_id: "$2"
Executors counters
- pattern: metrics<name=(\S+).(\S+).(.).executor.(.)><>Count name: spark_executor_$4_count type: COUNTER labels: app_namespace: "$1" app_id: "$2" executor_id: "$3"
These come from the application executors
Example: app-20160809000059-0000.0.jvm.threadpool.activeTasks
- pattern: metrics<name=(\S+).(\S+).([0-9]+).(jvm|NettyBlockTransfer).(.*)><>Value name: spark_executor_$4_$5 type: GAUGE labels: app_namespace: "$1" app_id: "$2" executor_id: "$3"
- pattern: metrics<name=(\S+).(\S+).([0-9]+).HiveExternalCatalog.(.*)><>Count name: spark_executor_HiveExternalCatalog_$4_count type: COUNTER labels: app_namespace: "$1" app_id: "$2" executor_id: "$3"
These come from the application driver
Emulate histograms for CodeGenerator
- pattern: metrics<name=(\S+).(\S+).([0-9]+).CodeGenerator.(.*)><>Count name: spark_executor_CodeGenerator_$4_count type: COUNTER labels: app_namespace: "$1" app_id: "$2" executor_id: "$3"
Data source config
Collector type:
Collector plugins:
Collector config:
Revisions
Upload an updated version of an exported dashboard.json file from Grafana
| Revision | Description | Created | |
|---|---|---|---|
| Download |
Apache Spark
Easily monitor Apache Spark, a unified analytics engine for large-scale data processing, with Grafana Cloud's out-of-the-box monitoring solution.
Learn more