Kubernetes monitoring by namespace and instance
Monitor a Kubernetes cluster using Prometheus. Shows overall cluster CPU / Memory / Disk usage and number of nodes. As a individual and with the posibility of filter by namespace: POD CPU / Memory / Network usage and PVC usage.
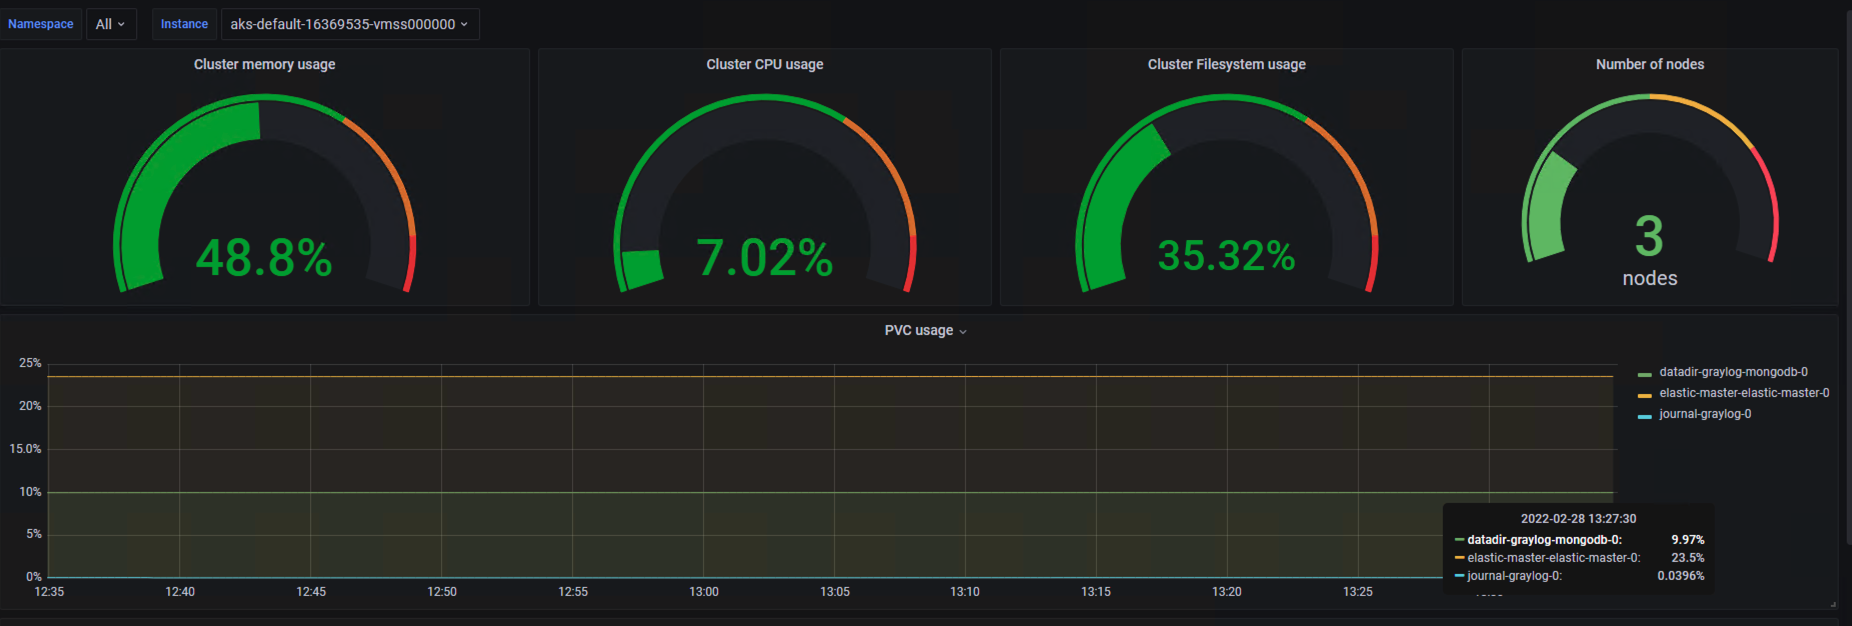
The Kubernetes monitoring by namespace and instance dashboard uses the prometheus data source to create a Grafana dashboard with the gauge, stat and timeseries panels.
Data source config
Collector type:
Collector plugins:
Collector config:
Revisions
Upload an updated version of an exported dashboard.json file from Grafana
| Revision | Description | Created | |
|---|---|---|---|
| Download |
Kubernetes
Monitor your Kubernetes deployment with prebuilt visualizations that allow you to drill down from a high-level cluster overview to pod-specific details in minutes.
Learn more