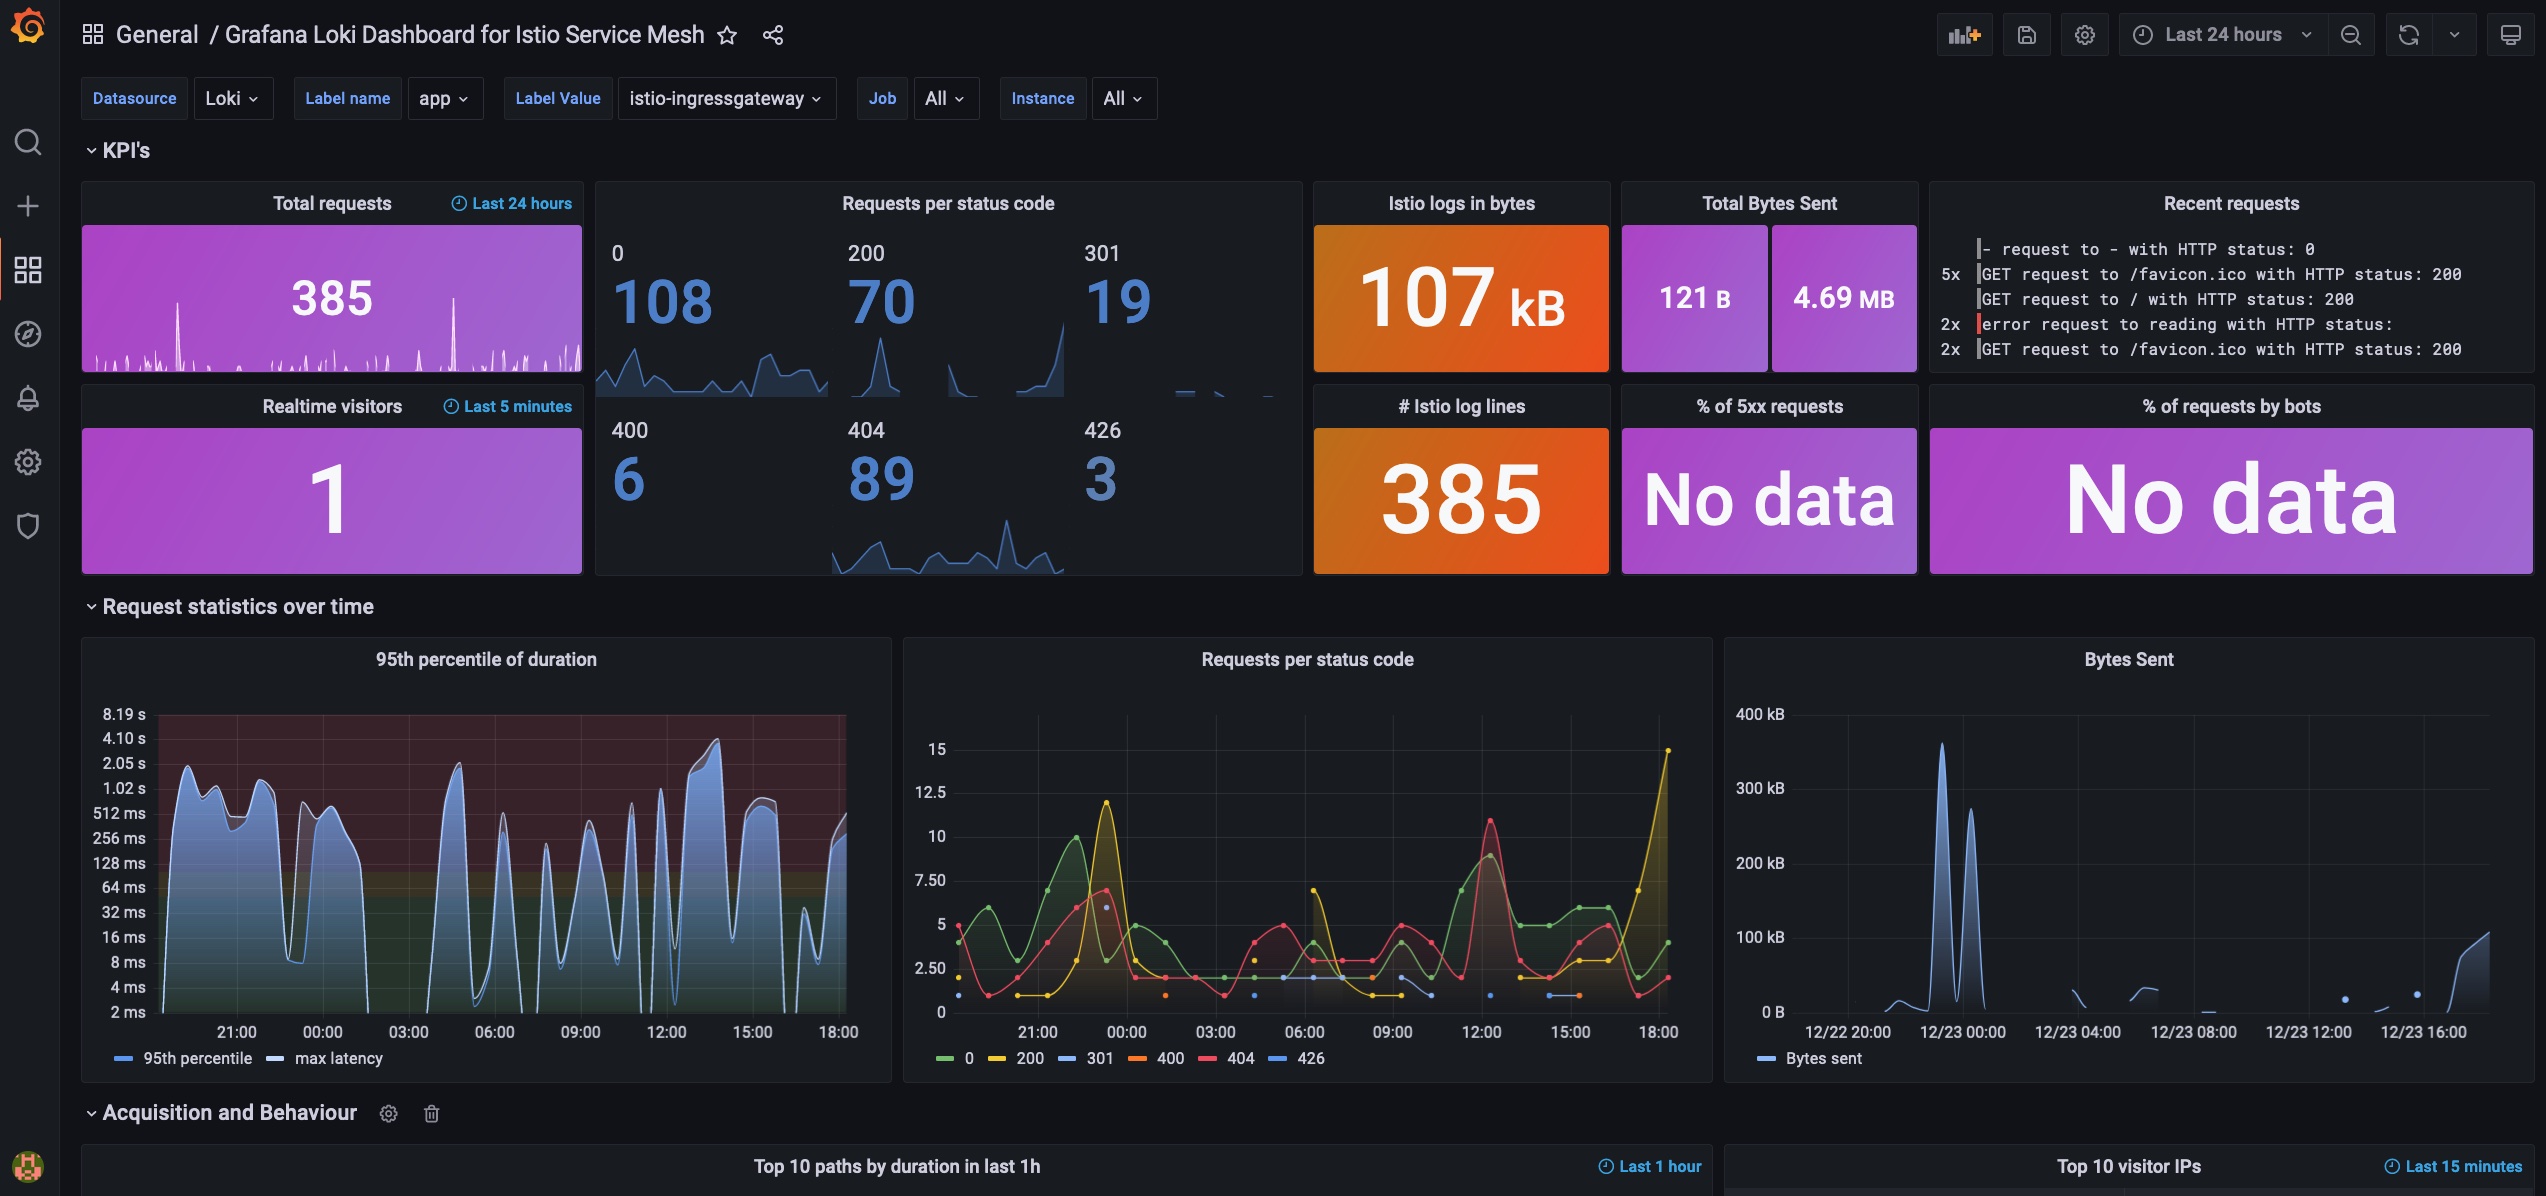
Grafana Loki Dashboard for Istio Service Mesh
Parsing Envoy access logs with Grafana Loki
Grafana Loki Dashboard for Istio Service Mesh
Overview
This dashboard is based on Envoy's (Istio's) access logs, parsed by Grafana Loki.
Prerequisites
- Enable access logging in Istio
spec:
  meshConfig:
    accessLogFile: /dev/stdout
- Only Loki 2.3+ versions are supported, as the panels are leveraging the new pattern parser
Configuration
There's no need for any extra scrape/parse configurations, only the default Promtail configuration, e.g. from the official Helm charts.
Default access log format of Istio's Envoy proxies:
[%START_TIME%] \"%REQ(:METHOD)% %REQ(X-ENVOY-ORIGINAL-PATH?:PATH)% %PROTOCOL%\" %RESPONSE_CODE% %RESPONSE_FLAGS% %RESPONSE_CODE_DETAILS% %CONNECTION_TERMINATION_DETAILS%
\"%UPSTREAM_TRANSPORT_FAILURE_REASON%\" %BYTES_RECEIVED% %BYTES_SENT% %DURATION% %RESP(X-ENVOY-UPSTREAM-SERVICE-TIME)% \"%REQ(X-FORWARDED-FOR)%\" \"%REQ(USER-AGENT)%\" \"%REQ(X-REQUEST-ID)%\"
\"%REQ(:AUTHORITY)%\" \"%UPSTREAM_HOST%\" %UPSTREAM_CLUSTER% %UPSTREAM_LOCAL_ADDRESS% %DOWNSTREAM_LOCAL_ADDRESS% %DOWNSTREAM_REMOTE_ADDRESS% %REQUESTED_SERVER_NAME% %ROUTE_NAME%\n
For further details, check the official docs: https://istio.io/latest/docs/tasks/observability/logs/access-log/
Usage
Select your istio-ingressgateways or applications served behind Envoy proxies via the label selectors to populate the panels of the dashboard.
Disclaimer: the dashboard is based on the original Grafana Loki Dashboard for NGINX Service Mesh by wardbekker1
Data source config
Collector config:
Upload an updated version of an exported dashboard.json file from Grafana
| Revision | Description | Created | |
|---|---|---|---|
| Download |
Grafana Loki (self-hosted)
Easily monitor Grafana Loki (self-hosted), a horizontally scalable, highly available, multi-tenant log aggregation system inspired by Prometheus, with Grafana Cloud's out-of-the-box monitoring solution.
Learn more
