
JVM metrics
Dashboard for JVM metrics within Kubernetes, where Prometheus installed using community helm chart
Based on https://grafana.com/grafana/dashboards/8563
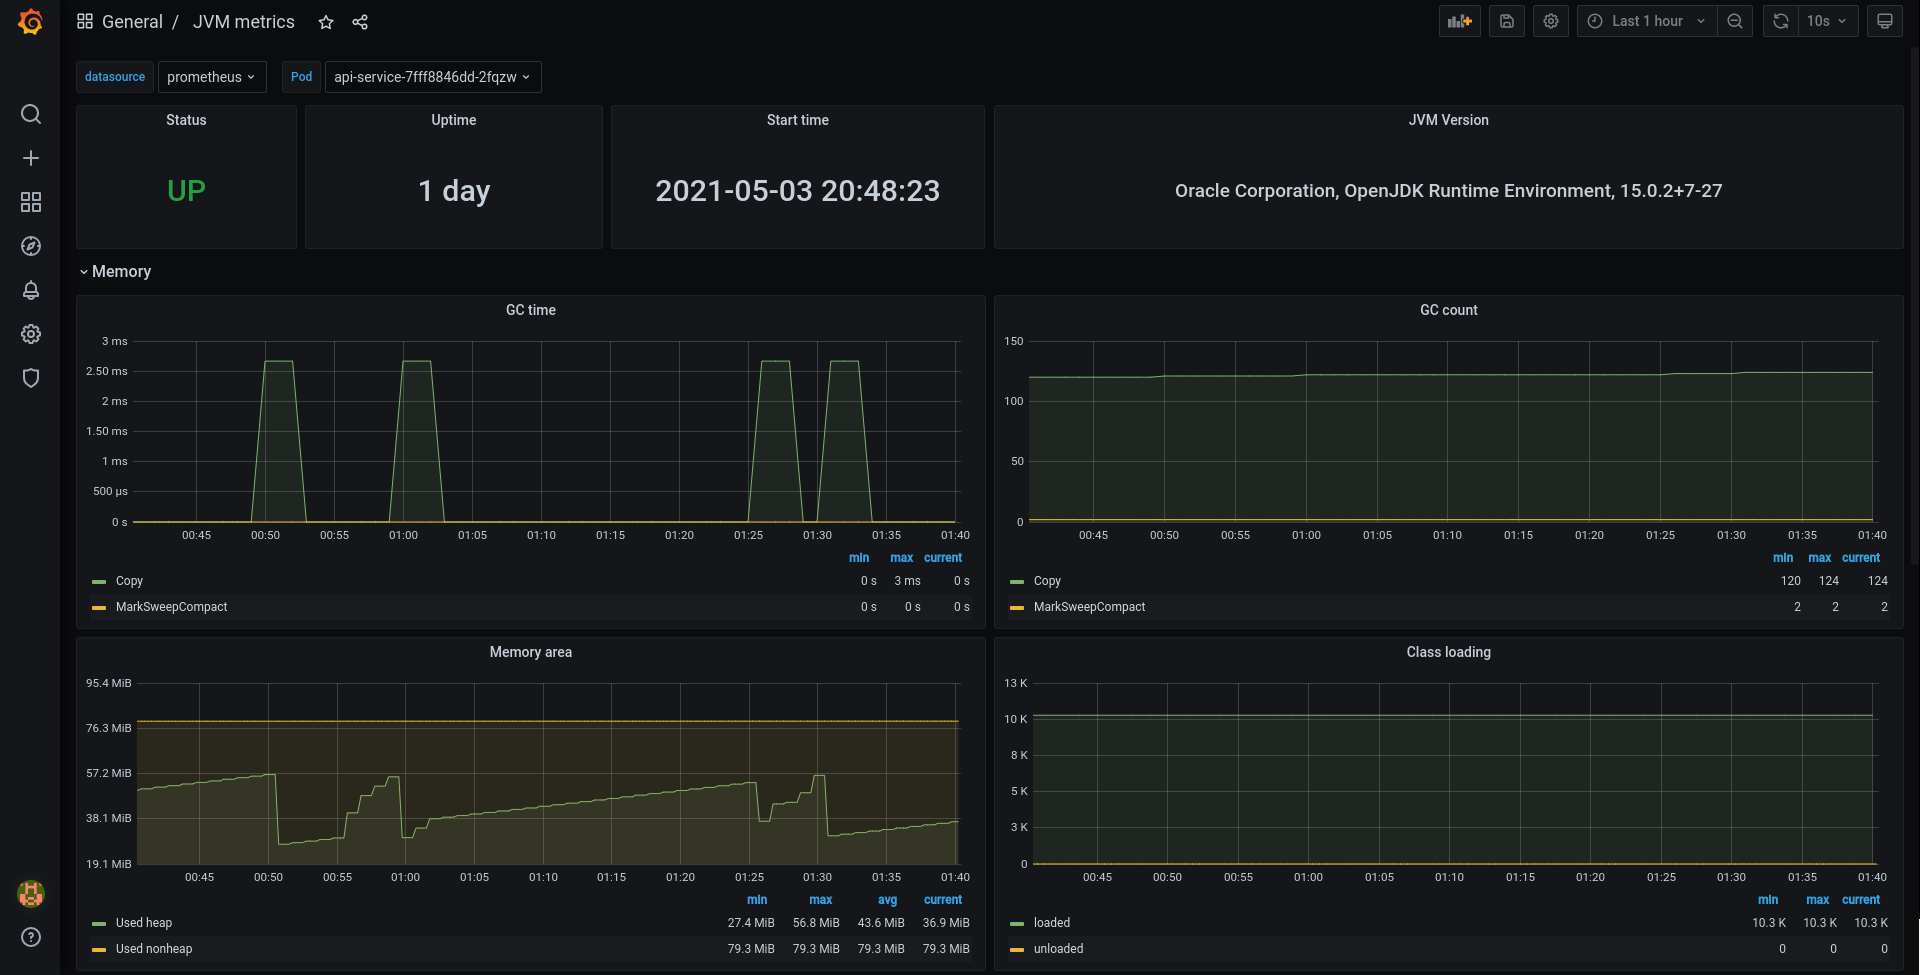
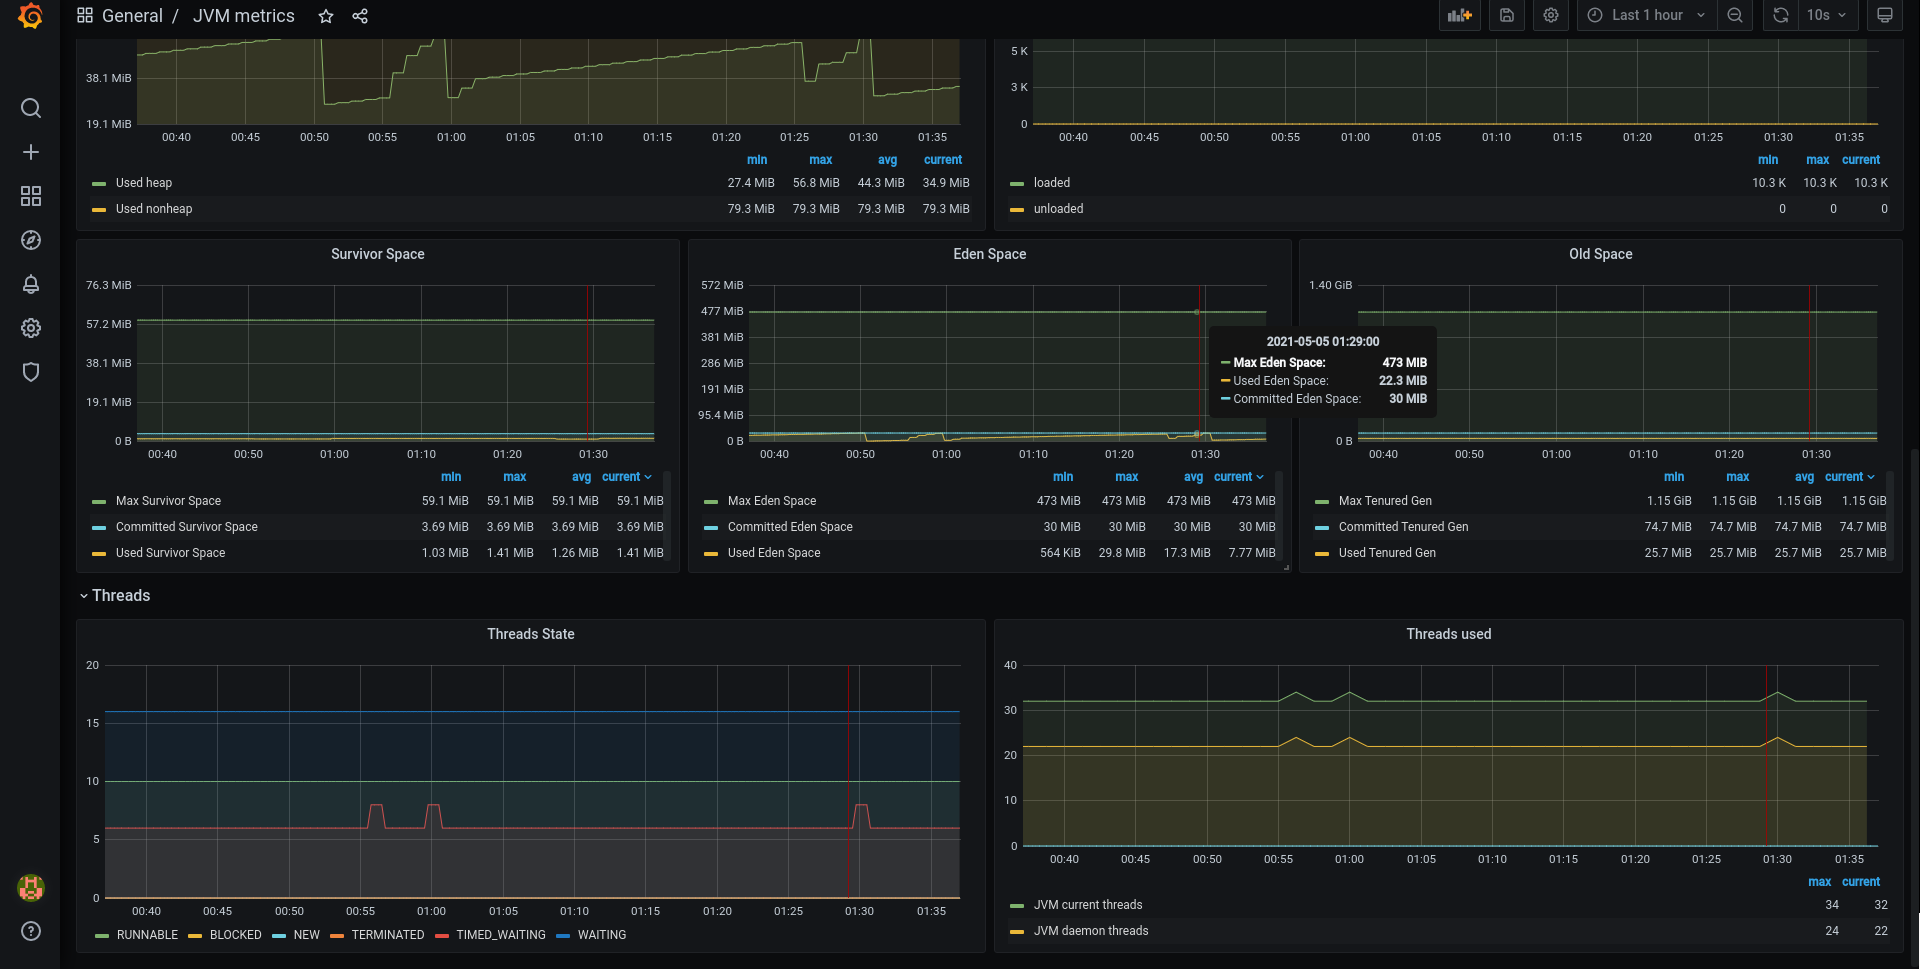
Shows JVM metrics for memory, classes, threads etc.. Uses metrics published by default JMX exporter.
Shows only JVM information, without dependencies on other exporters.
Uses default Prometheus tags names, as configured by https://github.com/prometheus-community/helm-charts
Revision one:
Fixed the label names according to https://github.com/prometheus-community/helm-charts/pull/1520
Data source config
Collector config:
Upload an updated version of an exported dashboard.json file from Grafana
| Revision | Description | Created | |
|---|---|---|---|
| Download |
Java Virtual Machine (JVM)
Easily monitor a Java virtual machine, which allows computers to run Java programs, with Grafana Cloud's out-of-the-box monitoring solution.
Learn more