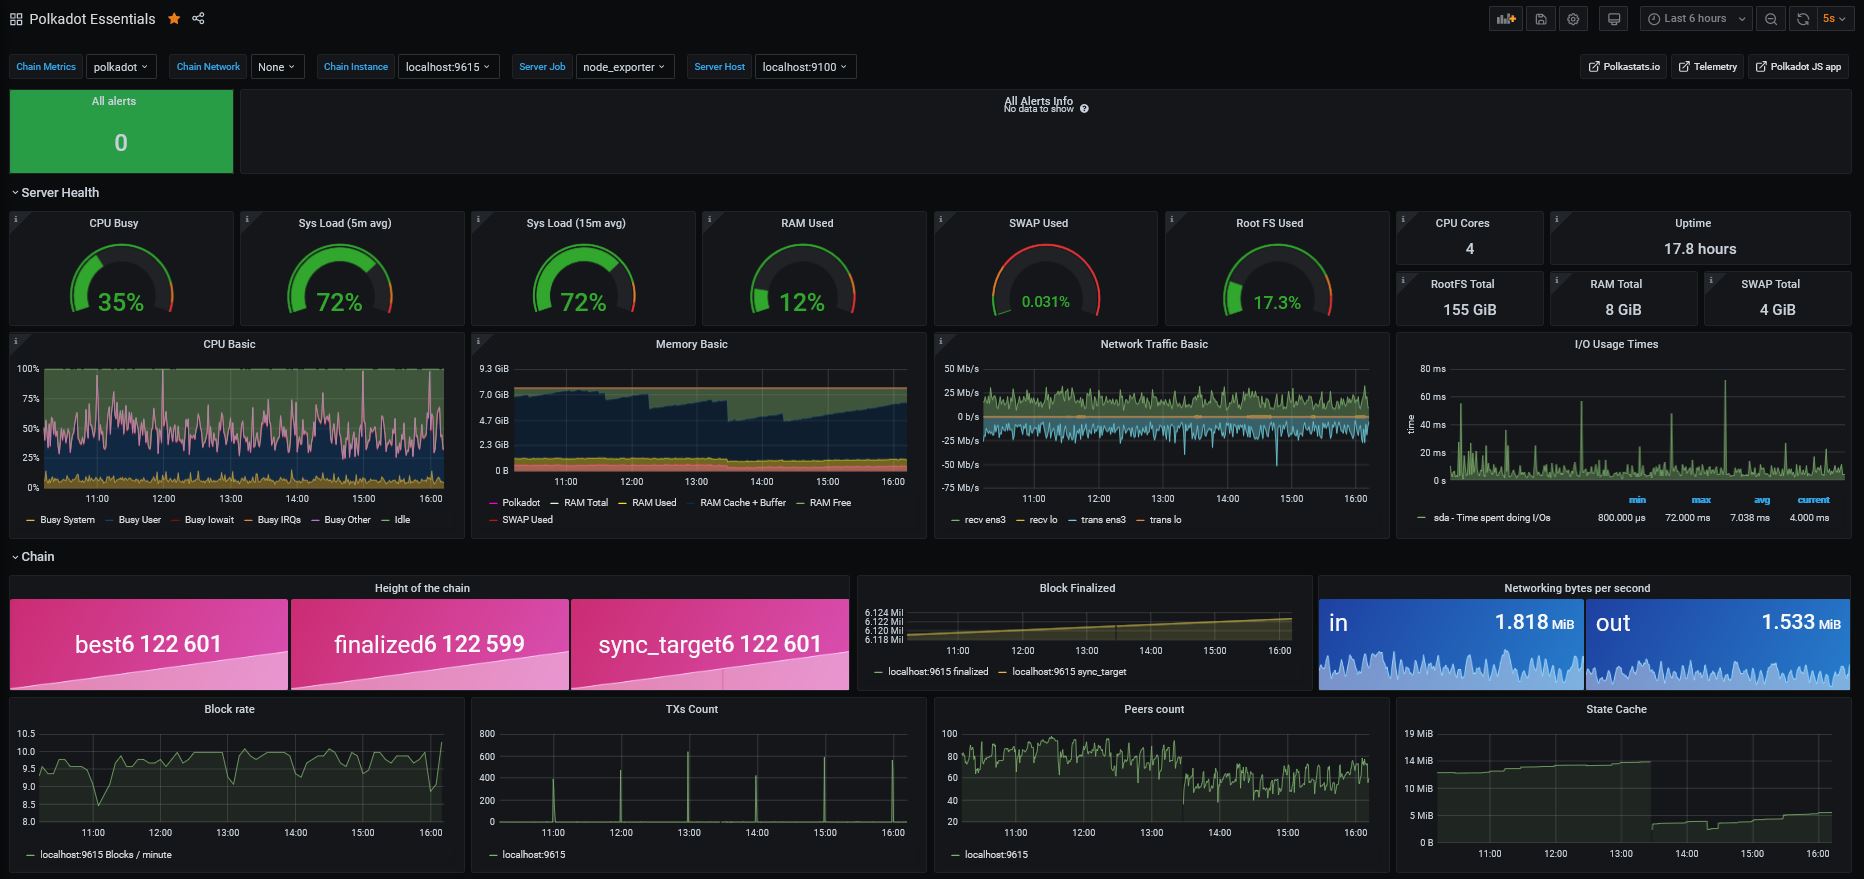
Polkadot Essentials 2021
Server and Substrate chain main metrics, suitable for a node monitoring in 2021 - Tutorial: https://medium.com/bld-nodes/monitoring-substrate-node-polkadot-kusama-parachains-validator-guide-922734ea4cdb
EDIT 2023: this dashboard is becoming outdated and is not maintained anymore, it is strongly recommended to switch to the latest dashobard here: https://grafana.com/grafana/dashboards/16863-polkadot-and-parachains-full-monitoring/
Full tutorial available here: https://medium.com/bld-nodes/monitoring-substrate-node-polkadot-kusama-parachains-validator-guide-922734ea4cdb
The variables will depend on your configuration, make sure you well select 'localhost:9615' in Chain Instance Host, then save the dashboard.
I love my work to be useful for everyone, please feel free to send me any comment or feedback:
- Twitter: https://twitter.com/bLd77
- Matrix: @bld759:matrix.org
If you'd like to tip:
- DOT address: 145nernJ6BXJ684HaegkbHpJLzeqtxmEXynJkxkLppBhXdFY
- KSM address: Hf8C626KBAjitMV7w8AhQWDCiPgUU47htEwbomq5mDMKeyL
Data source config
Collector config:
Upload an updated version of an exported dashboard.json file from Grafana
| Revision | Description | Created | |
|---|---|---|---|
| Download |