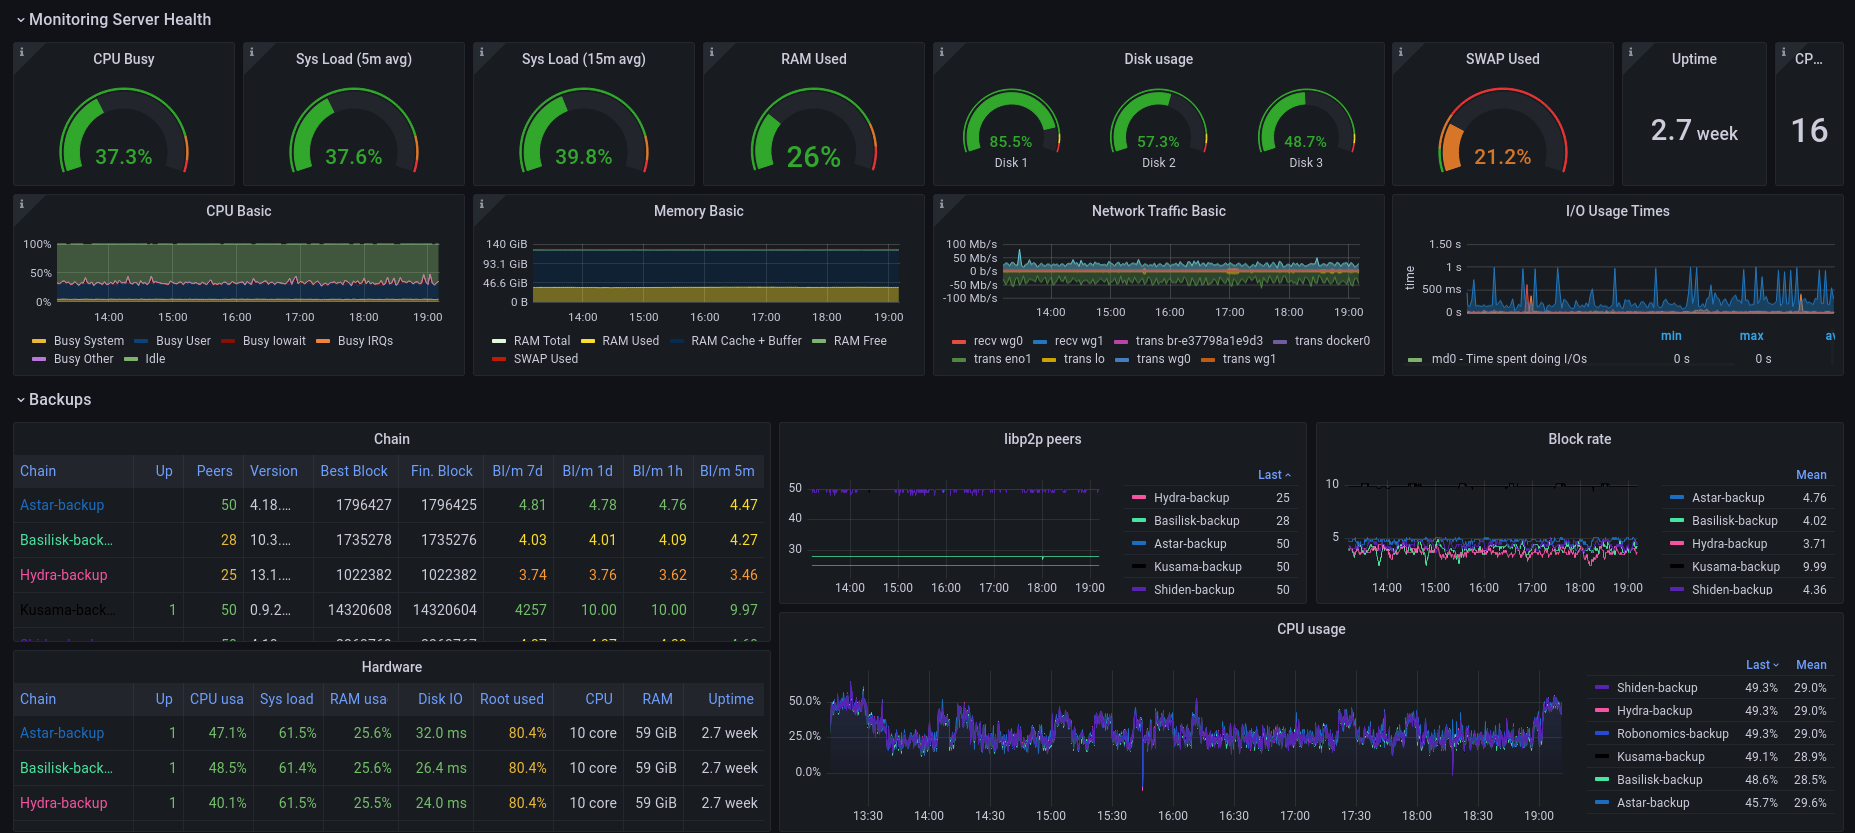
Polkadot and parachains full monitoring
All in one monitoring for Substrate based Relay chain, Parachains and backups
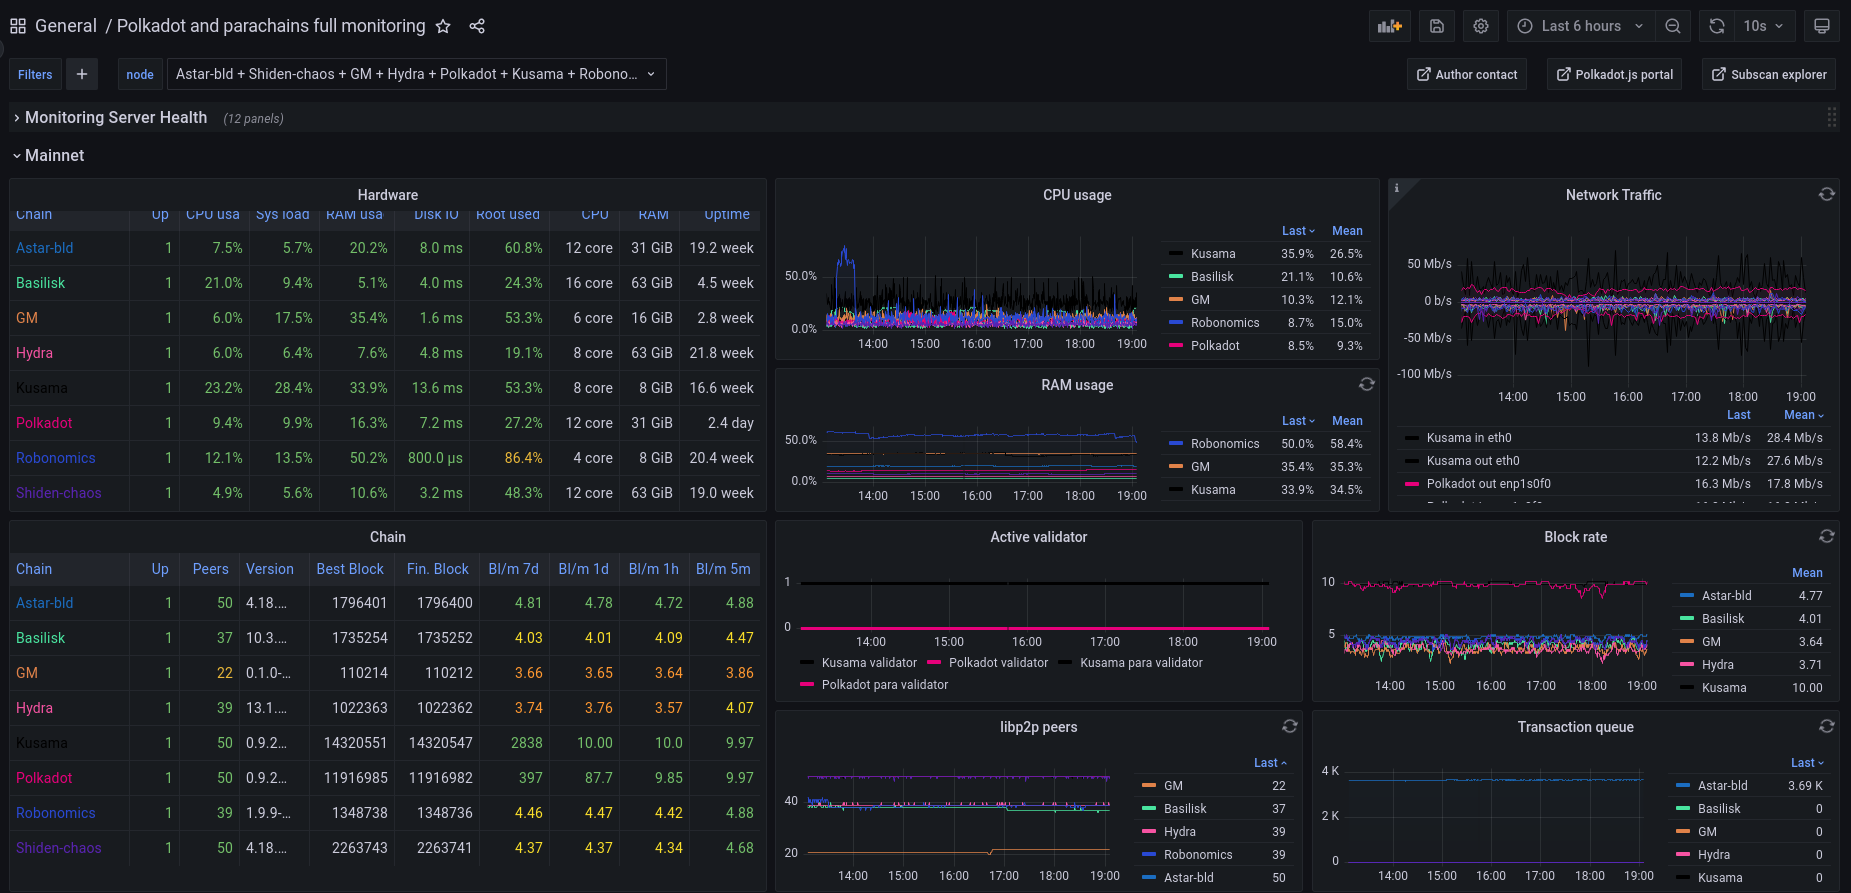
Full integrated dashboard for Substrate blockchains including Polkadot, Kusama and any parachain. If you use it, please add a review that will help improve it! Deployment guide: https://medium.com/bld-nodes/monitoring-multiple-substrate-nodes-polkadot-kusama-parachains-2022-2eb85cdf2533
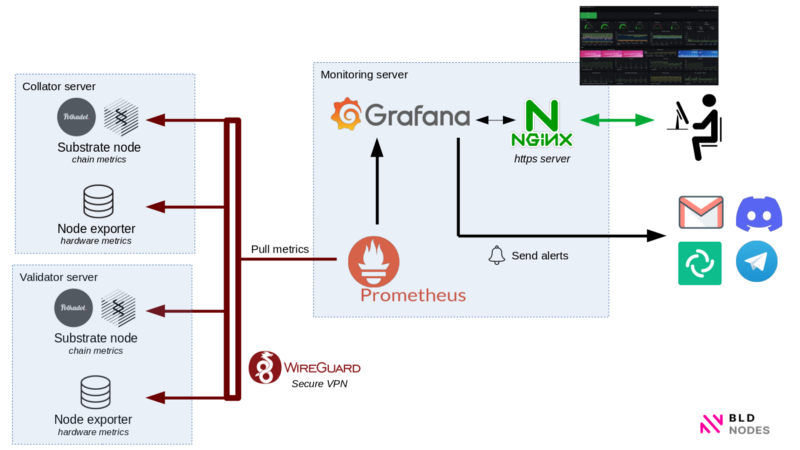
Stack
- Dedicated monitoring instance: Prometheus + Grafana + Node exporter (reverse proxy to DNS is advised)
- Nodes: substrate node + node exporter
- Communication: for a secure and light connection, Wireguard VPN is recommended. But a reverse proxy can also be used if you prefer this solution.
Prometheus config
yml config file has to meet the following requirements:
job_name: "prometheus"andjob_name: "node_exporter"for monitoring local hostjob_name: "mainnet"for all mainnet instances (validators, collators)job_name: "backup"for all backups- for each instance,
targetsto the substrate & the node exporter metric endpoint + labelchainwith the chain name (the name that will be displayed in the dashboard' A template is available here
Contact
I love my work to be useful for everyone, please feel free to send me any comment or feedback:
- Matrix: @bld759:matrix.org
- Or open an issue/PR on the Github repo
If you’d like to tip or nominate my validators:
- DOT validator: 12bLdVAgWiKHgFHtAaQstasMUWVq35oG9iwHCwsKoFFNoNrk
- KSM validator: Hf8C626KBAjitMV7w8AhQWDCiPgUU47htEwbomq5mDMKeyL
Data source config
Collector type:
Collector plugins:
Collector config:
Revisions
Upload an updated version of an exported dashboard.json file from Grafana
| Revision | Description | Created | |
|---|---|---|---|
| Download |