
LDAP DB monitor
Monitor your db suffixes!
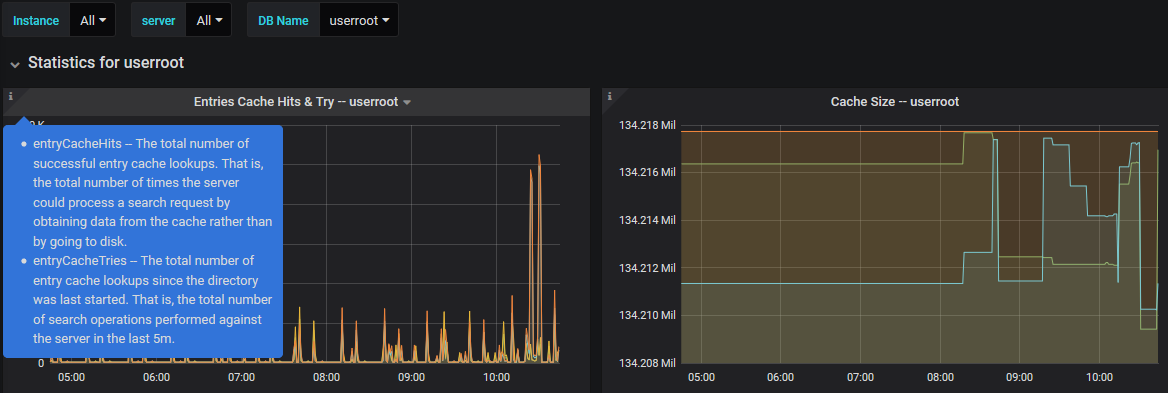
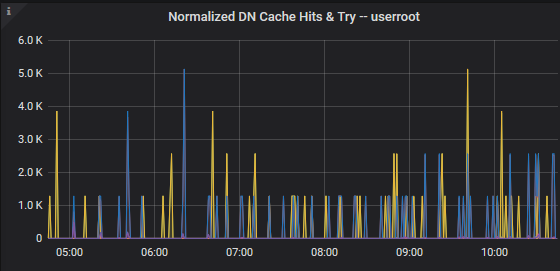
You want to monitor the 389 Directory Server DBs activity and load. Please download and compile the ds389 input plugin, now in beta version at Github.
- Create your telegraf config file, with many LDAP instances tags as your need.
- Test the plugin to ensure you are collecting the data as explained in the plugin README
- Then install this dashboard and enjoy!
PS: the alert section still has to improve.
The plugin is still waiting to be added to Telegraf. Meanwhile you can add it as external here.
Data source config
Collector type:
Collector plugins:
Collector config:
Revisions
Upload an updated version of an exported dashboard.json file from Grafana
| Revision | Description | Created | |
|---|---|---|---|
| Download |
Azure Cosmos DB
With the Grafana plugin for Azure Cosmos DB, you can quickly visualize and query your Azure Cosmos DB data from within Grafana.
Learn more