Stellar Core Full
Stellar core node health information and detailed metrics
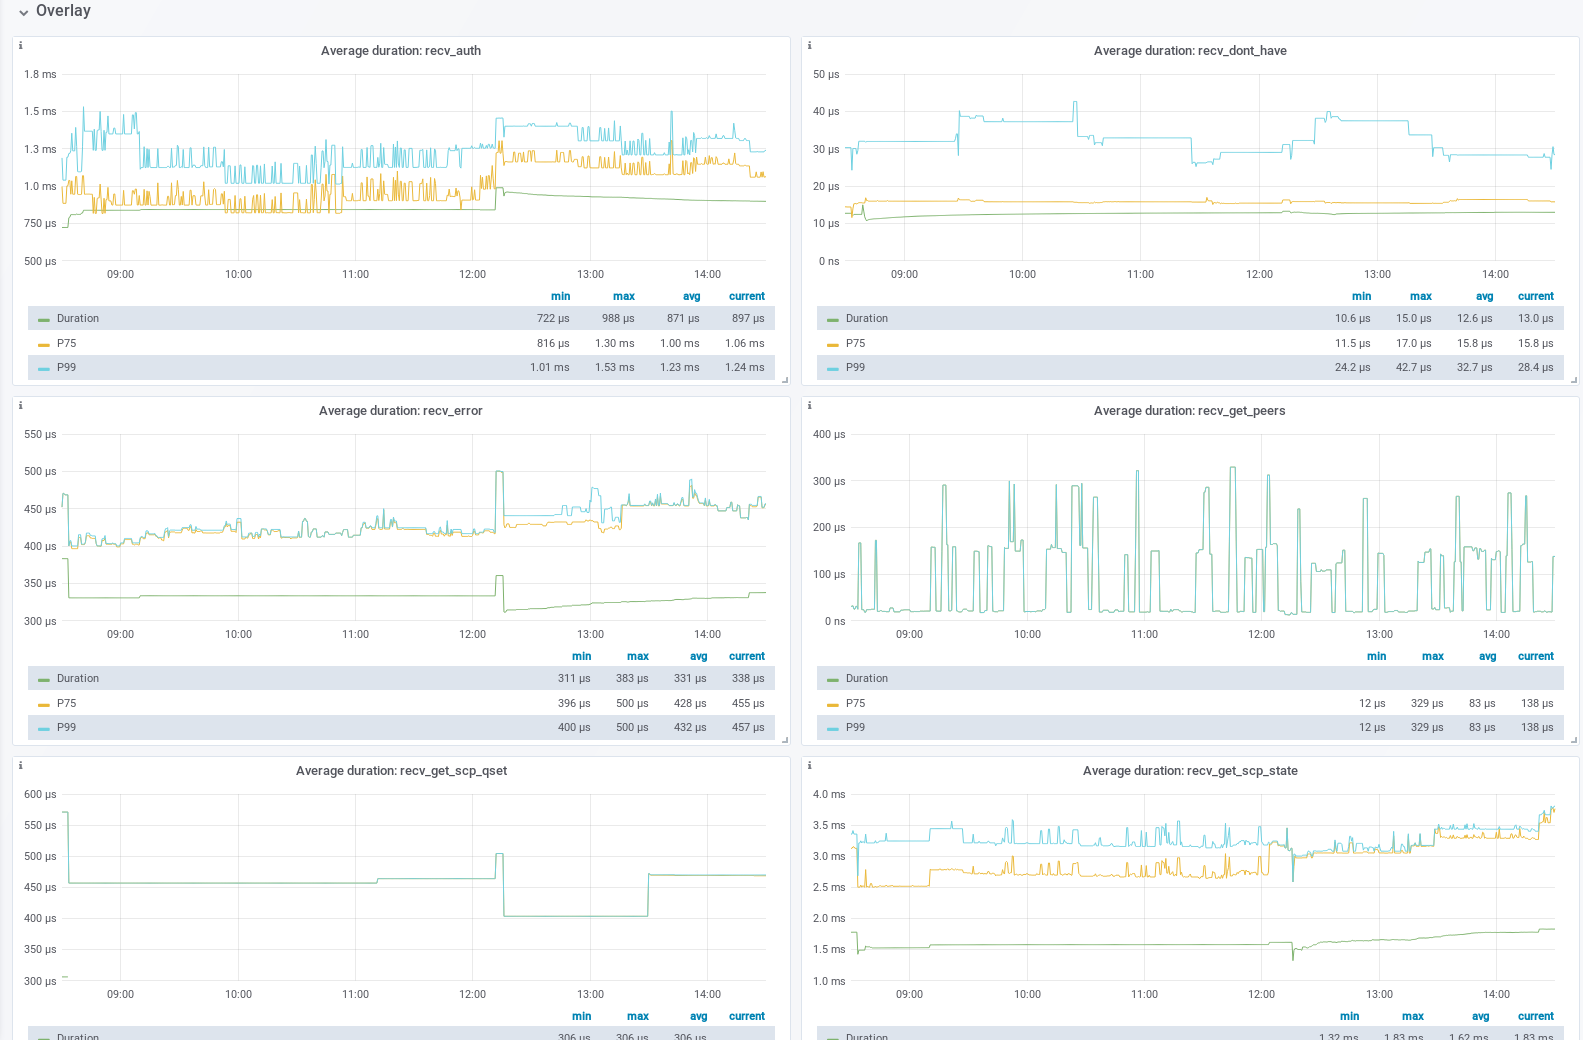
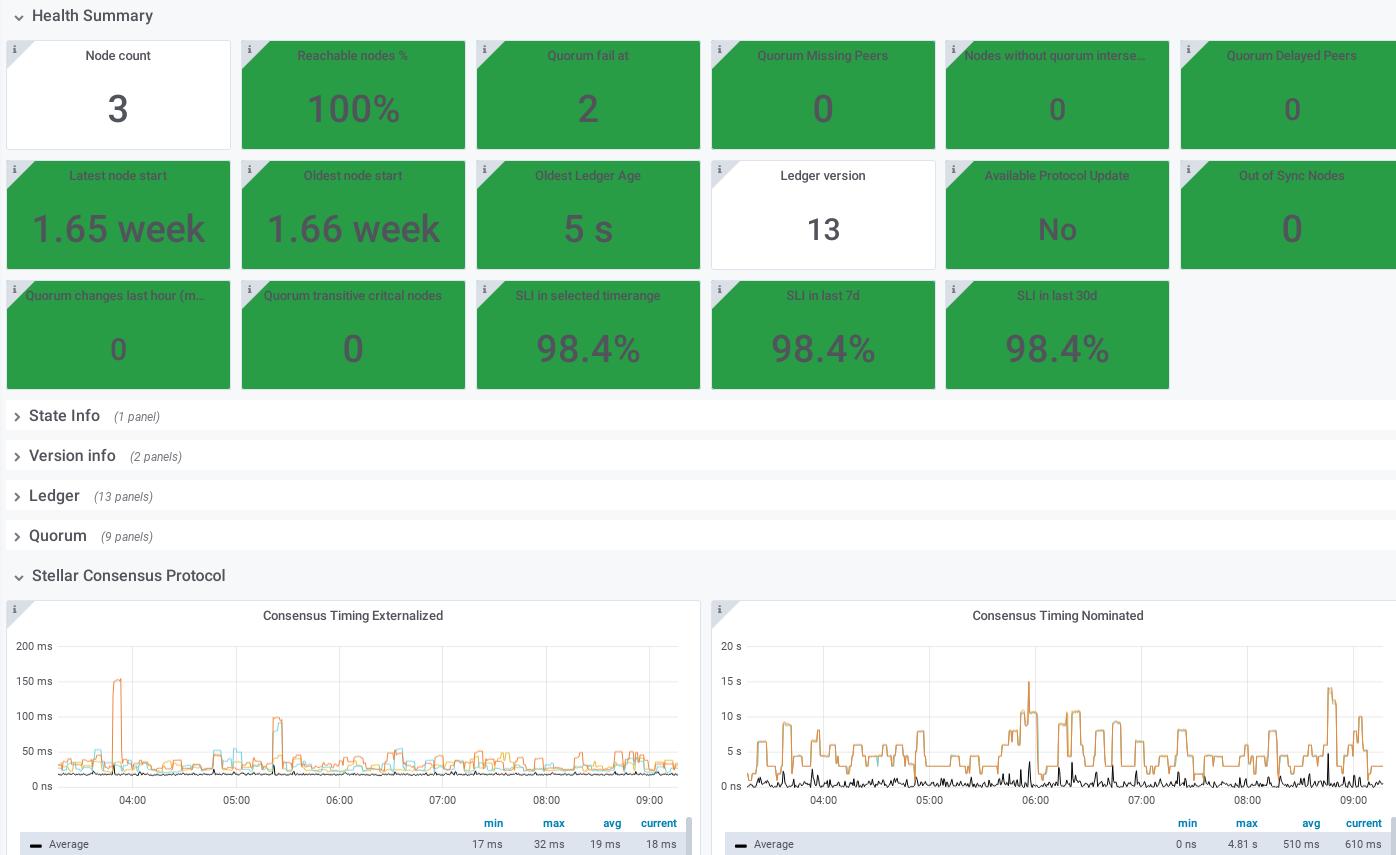
Visualizes all metrics exposed by the stellar-core-prometheus-exporter. Intended for in-depth troubleshooting. For smaller more focused monitoring dashboard please see Stellar Core Monitoring
Please refer to the official documentation for details about stellar-core monitoring and suggested prometheus alerting rules.
Revision 8 changes:
- display healthy nodes in the "Quorum Transitive Critical Peers Details" panel
- move away from using "instant" queries in some panels. Those panels broke when "Today" timerange was selected becuase latest timestamp was in the future
Data source config
Collector type:
Collector plugins:
Collector config:
Revisions
Upload an updated version of an exported dashboard.json file from Grafana
| Revision | Description | Created | |
|---|---|---|---|
| Download |