
Important: This documentation is about an older version. It's relevant only to the release noted, many of the features and functions have been updated or replaced. Please view the current version.
Using Google Stackdriver in Grafana
Only available in Grafana v5.3+. The datasource is currently a beta feature and is subject to change.
Grafana ships with built-in support for Google Stackdriver. Just add it as a datasource and you are ready to build dashboards for your Stackdriver metrics.
Adding the data source to Grafana
- Open the side menu by clicking the Grafana icon in the top header.
- In the side menu under the
Dashboardslink you should find a link namedData Sources. - Click the
+ Add data sourcebutton in the top header. - Select
Stackdriverfrom the Type dropdown. - Upload or paste in the Service Account Key file. See below for steps on how to create a Service Account Key file.
NOTE: If you’re not seeing the
Data Sourceslink in your side menu it means that your current user does not have theAdminrole for the current organization.
Authentication
Service Account Credentials - Private Key File
To authenticate with the Stackdriver API, you need to create a Google Cloud Platform (GCP) Service Account for the Project you want to show data for. A Grafana datasource integrates with one GCP Project. If you want to visualize data from multiple GCP Projects then you need to create one datasource per GCP Project.
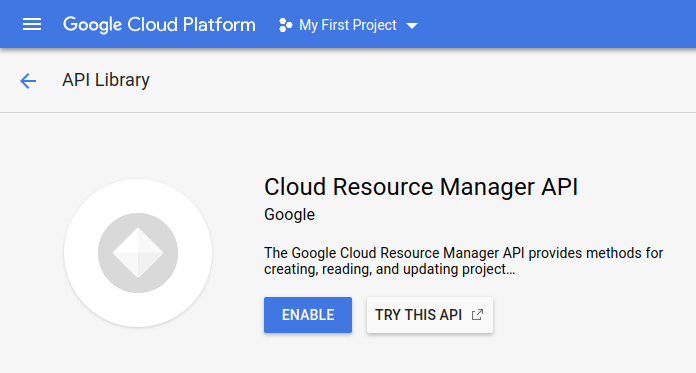
Enable APIs
The following APIs need to be enabled first:
Click on the links above and click the Enable button:
Create a GCP Service Account for a Project
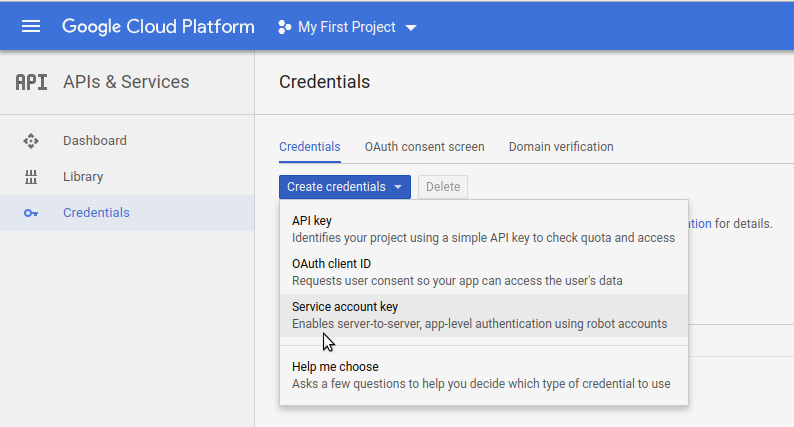
Navigate to the APIs & Services Credentials page.
Click on the
Create credentialsdropdown/button and choose theService account keyoption.![Create service account button]()
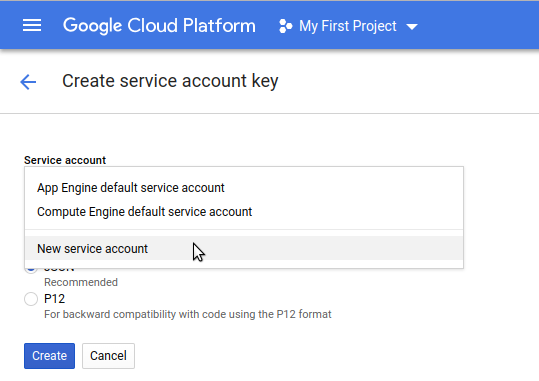
On the
Create service account keypage, choose key typeJSON. Then in theService Accountdropdown, choose theNew service accountoption:![Create service account key]()
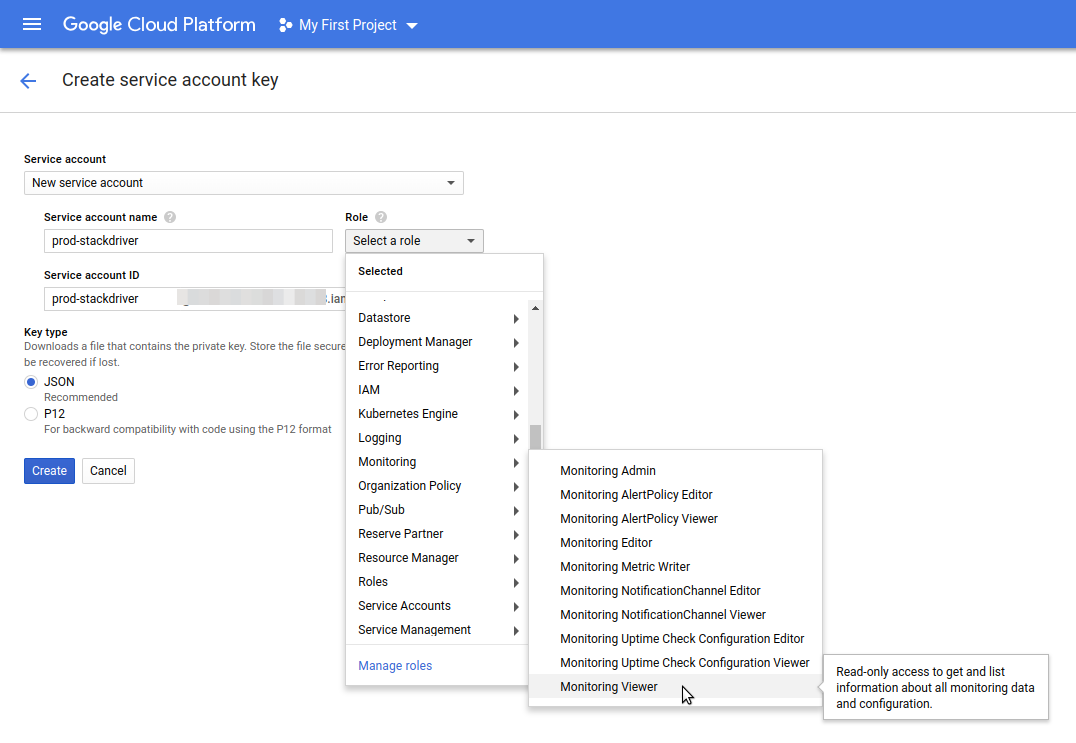
Some new fields will appear. Fill in a name for the service account in the
Service account namefield and then choose theMonitoring Viewerrole from theRoledropdown:![Choose role]()
Click the Create button. A JSON key file will be created and downloaded to your computer. Store this file in a secure place as it allows access to your Stackdriver data.
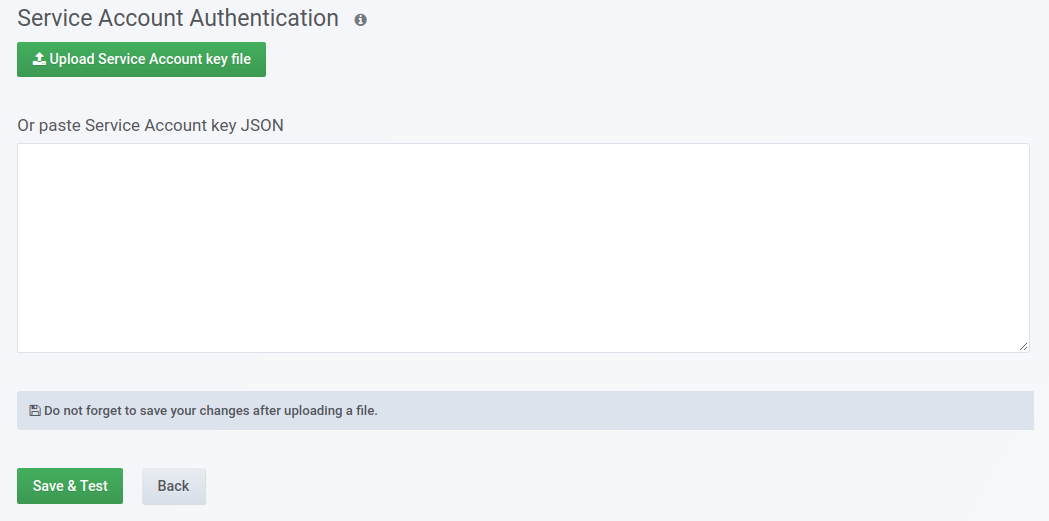
Upload it to Grafana on the datasource Configuration page. You can either upload the file or paste in the contents of the file.
![Choose role]()
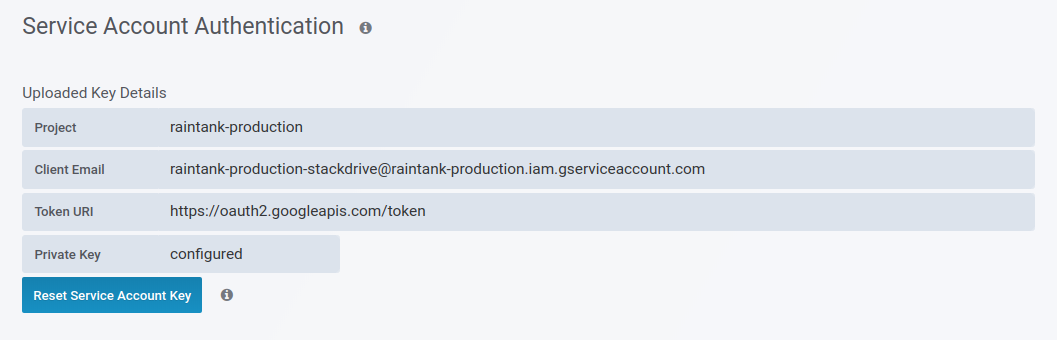
The file contents will be encrypted and saved in the Grafana database. Don’t forget to save after uploading the file!
![Choose role]()
Metric Query Editor
Choose a metric from the Metric dropdown.
Filter
To add a filter, click the plus icon and choose a field to filter by and enter a filter value e.g. instance_name = grafana-1. You can remove the filter by clicking on the filter name and select --remove filter--.
Simple wildcards
When the operator is set to = or != it is possible to add wildcards to the filter value field. E.g us-* will capture all values that starts with “us-” and *central-a will capture all values that ends with “central-a”. *-central-* captures all values that has the substring of -central-. Simple wildcards are less expensive than regular expressions.
Regular expressions
When the operator is set to =~ or !=~ it is possible to add regular expressions to the filter value field. E.g us-central[1-3]-[af] would match all values that starts with “us-central”, is followed by a number in the range of 1 to 3, a dash and then either an “a” or an “f”. Leading and trailing slashes are not needed when creating regular expressions.
Aggregation
The aggregation field lets you combine time series based on common statistics. Read more about this option here.
The Aligner field allows you to align multiple time series after the same group by time interval. Read more about how it works here.
Alignment Period/Group by Time
The Alignment Period groups a metric by time if an aggregation is chosen. The default is to use the GCP Stackdriver default groupings (which allows you to compare graphs in Grafana with graphs in the Stackdriver UI).
The option is called Stackdriver auto and the defaults are:
- 1m for time ranges < 23 hours
- 5m for time ranges >= 23 hours and < 6 days
- 1h for time ranges >= 6 days
The other automatic option is Grafana auto. This will automatically set the group by time depending on the time range chosen and the width of the graph panel. Read more about the details here.
It is also possible to choose fixed time intervals to group by, like 1h or 1d.
Group By
Group by resource or metric labels to reduce the number of time series and to aggregate the results by a group by. E.g. Group by instance_name to see an aggregated metric for a Compute instance.
Alias Patterns
The Alias By field allows you to control the format of the legend keys. The default is to show the metric name and labels. This can be long and hard to read. Using the following patterns in the alias field, you can format the legend key the way you want it.
Metric Type Patterns
Label Patterns
In the Group By dropdown, you can see a list of metric and resource labels for a metric. These can be included in the legend key using alias patterns.
Example Alias By: {{metric.type}} - {{metric.labels.instance_name}}
Example Result: compute.googleapis.com/instance/cpu/usage_time - server1-prod
It is also possible to resolve the name of the Monitored Resource Type.
Example Alias By: {{resource.type}} - {{metric.type}}
Example Result: gce_instance - compute.googleapis.com/instance/cpu/usage_time
Templating
Instead of hard-coding things like server, application and sensor name in you metric queries you can use variables in their place. Variables are shown as dropdown select boxes at the top of the dashboard. These dropdowns makes it easy to change the data being displayed in your dashboard.
Checkout the Templating documentation for an introduction to the templating feature and the different types of template variables.
Query Variable
Writing variable queries is not supported yet.
Using variables in queries
There are two syntaxes:
$<varname>Example: rate(http_requests_total{job=~"$job"}[5m])[[varname]]Example: rate(http_requests_total{job=~"[[job]]"}[5m])
Why two ways? The first syntax is easier to read and write but does not allow you to use a variable in the middle of a word. When the Multi-value or Include all value options are enabled, Grafana converts the labels from plain text to a regex compatible string, which means you have to use =~ instead of =.
Annotations
Annotations allows you to overlay rich event information on top of graphs. You add annotation queries via the Dashboard menu / Annotations view.
Configure the Datasource with Provisioning
It’s now possible to configure datasources using config files with Grafana’s provisioning system. You can read more about how it works and all the settings you can set for datasources on the provisioning docs page
Here is a provisioning example for this datasource.
apiVersion: 1

datasources:
  - name: Stackdriver
    type: stackdriver
    jsonData:
      tokenUri: https://oauth2.googleapis.com/token
      clientEmail: stackdriver@myproject.iam.gserviceaccount.com
    secureJsonData:
      privateKey: "<contents of your Service Account JWT Key file>"
Was this page helpful?
Related resources from Grafana Labs


