OPC UA Datasource plugin for Grafana
Utilizing the datasource plugin framework, this projects allows you to access data from OPC UA servers directly from Grafana.
TLDR;
To build on any platform:
yarn build

Status
Currently used in production and under active maintenance
What works
- Browsing and adding multiple servers
- Authenticated connection with certificate or no security
- Graphical query editor
- Data Access (DA)
- Historical Access (HA / HDA)
- Alarms & Conditions (AC / AE)
What needs to be implemented
- OPCUA DA Subscriptions: These are the ones where you will not need to hit the refresh button. If you have subscribed to a data point at 500ms, you will get an unsolicited update every 500ms.
- Password authentication
- Two-way communication with the OPC UA server (currently read only)
Description and Architecture
This plugin uses GRPC and a C# backend to communicate with Grafana directly. See pkg/dotnet directory for the backend component
Building
yarn installto install dependenciesyarn build | yarn devto build the pluginmake buildto build the backend component
Restart Grafana and you should have the datasource installed.
Configuration
You will need to add a plugin specific configuration section to your configuration file (grafana.conf)
[plugin.grafana-opcua-datasource]
data_dir = "/some/path/to/config/grafana-opcua-datasource"
An example of this using common linux default paths would be
[plugin.grafana-opcua-datasource]
data_dir = "/var/lib/grafana-opcua-datasource"
Contributing
Contributions that addresses the needs above or other feature you’d like to see are most welcome. Fork the project and commit a PR with your requests.
 is a proud contributor
Open Software like this project and open standards like OPC UA fits perfectly with our quest to give our clients the freedom to operate. To know more about our offerings and get in touch, check out https://prediktor.com.
Prediktor has a public test OPC UA Server running at opc.tcp://opcua.prediktor.com:4880. It provides a small information model with Realtime/Historic data and Alarms&Events. Feel free to use it
You can find complementary OPC UA Grafana panel plugins at https://github.com/PrediktorAS/grafana
Q&A
Q: Can it read OPC Classic DA/HDA/AE?
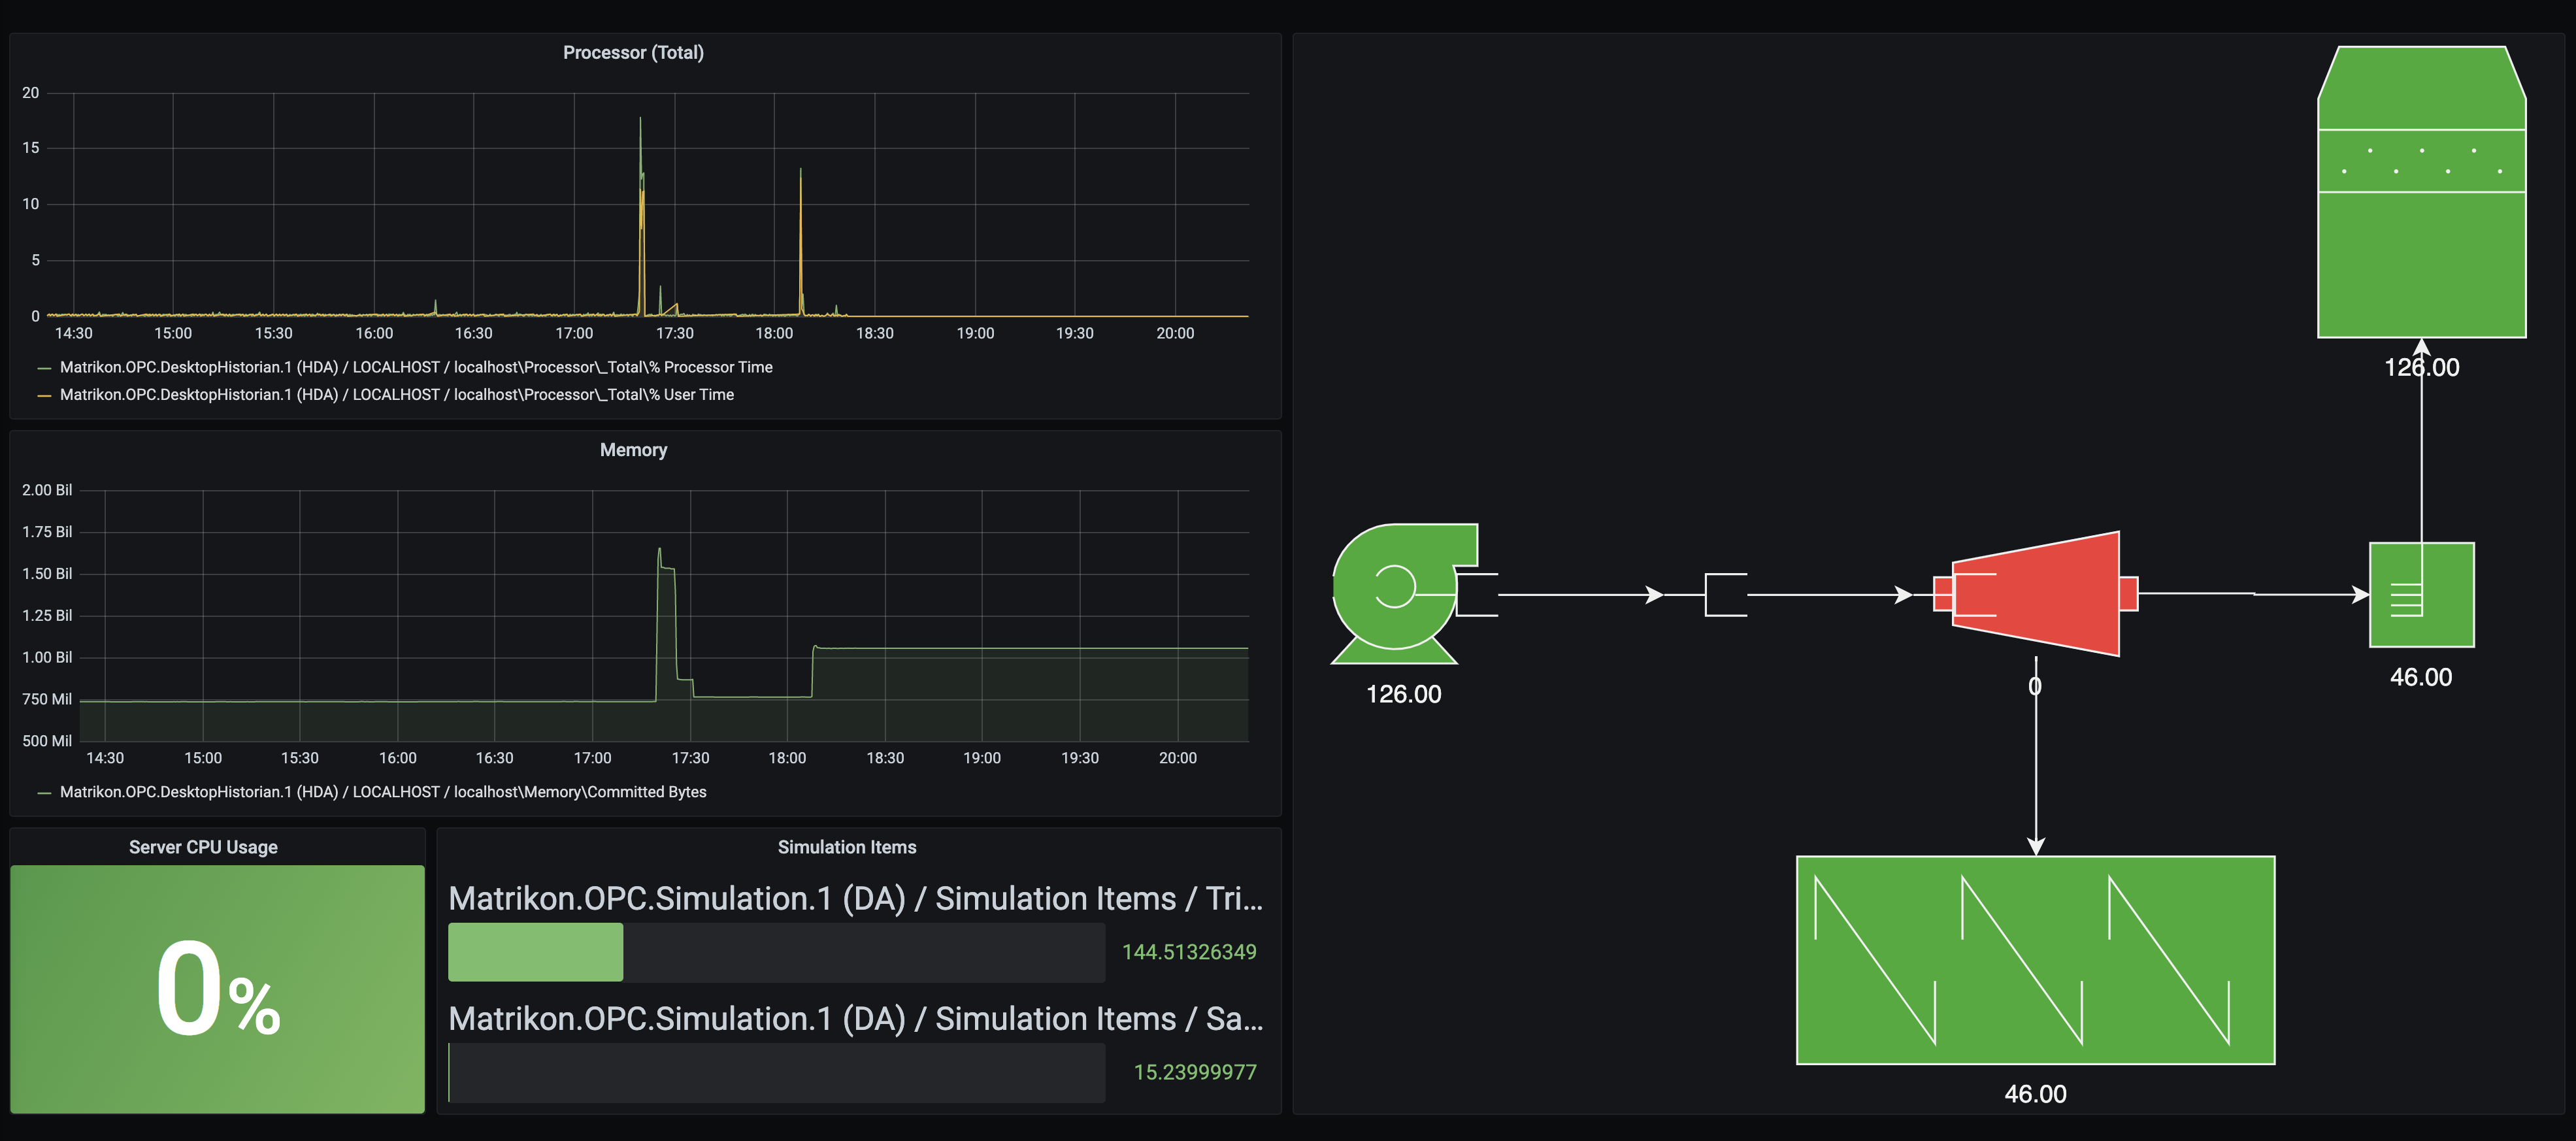
A: Yes, provided use use the OPC Foundations COMIOP wrapper, which you can find here. You will need to configure IOP to wrap your OPC COM server. Tested against Matrikon OPC Desktop Historian and Matrikon OPC Simulation Server.
Vision
The OPC UA datasource should be
- Easy to use
- Graphically configurable
- Smart (ie: Able to use metadata from the browsing of tags to ease configuration in whatever panel the datasource is interacting with)
- Robust and Reliable (of course!)


