Important: This documentation is about an older version. It's relevant only to the release noted, many of the features and functions have been updated or replaced. Please view the current version.
Using Loki in Grafana
Grafana ships with built-in support for Loki, an open source log aggregation system by Grafana Labs. This topic explains options, variables, querying, and other options specific to this data source.
Add it as a data source and you are ready to build dashboards or query your log data in Explore. Refer to Add a data source for instructions on how to add a data source to Grafana. Only users with the organization admin role can add data sources.
Hosted Loki
You can run Loki on your own hardware or use Grafana Cloud. The free forever plan includes Grafana, 50 GB of Loki logs, 10K Prometheus series, and more. Create a free account to get started.
Loki settings
To access Loki settings, click the Configuration (gear) icon, then click Data Sources, and then click the Loki data source.
Note: To troubleshoot configuration and other issues, check the log file located at /var/log/grafana/grafana.log on Unix systems or in <grafana_install_dir>/data/log on other platforms and manual installations.
Derived fields
The Derived Fields configuration allows you to:
- Add fields parsed from the log message.
- Add a link that uses the value of the field.
For example, you can use this functionality to link to your tracing backend directly from your logs, or link to a user profile page if a userId is present in the log line. These links appear in the log details.
Note: Grafana Cloud users can request modifications to this feature by opening a support ticket in the Cloud Portal.
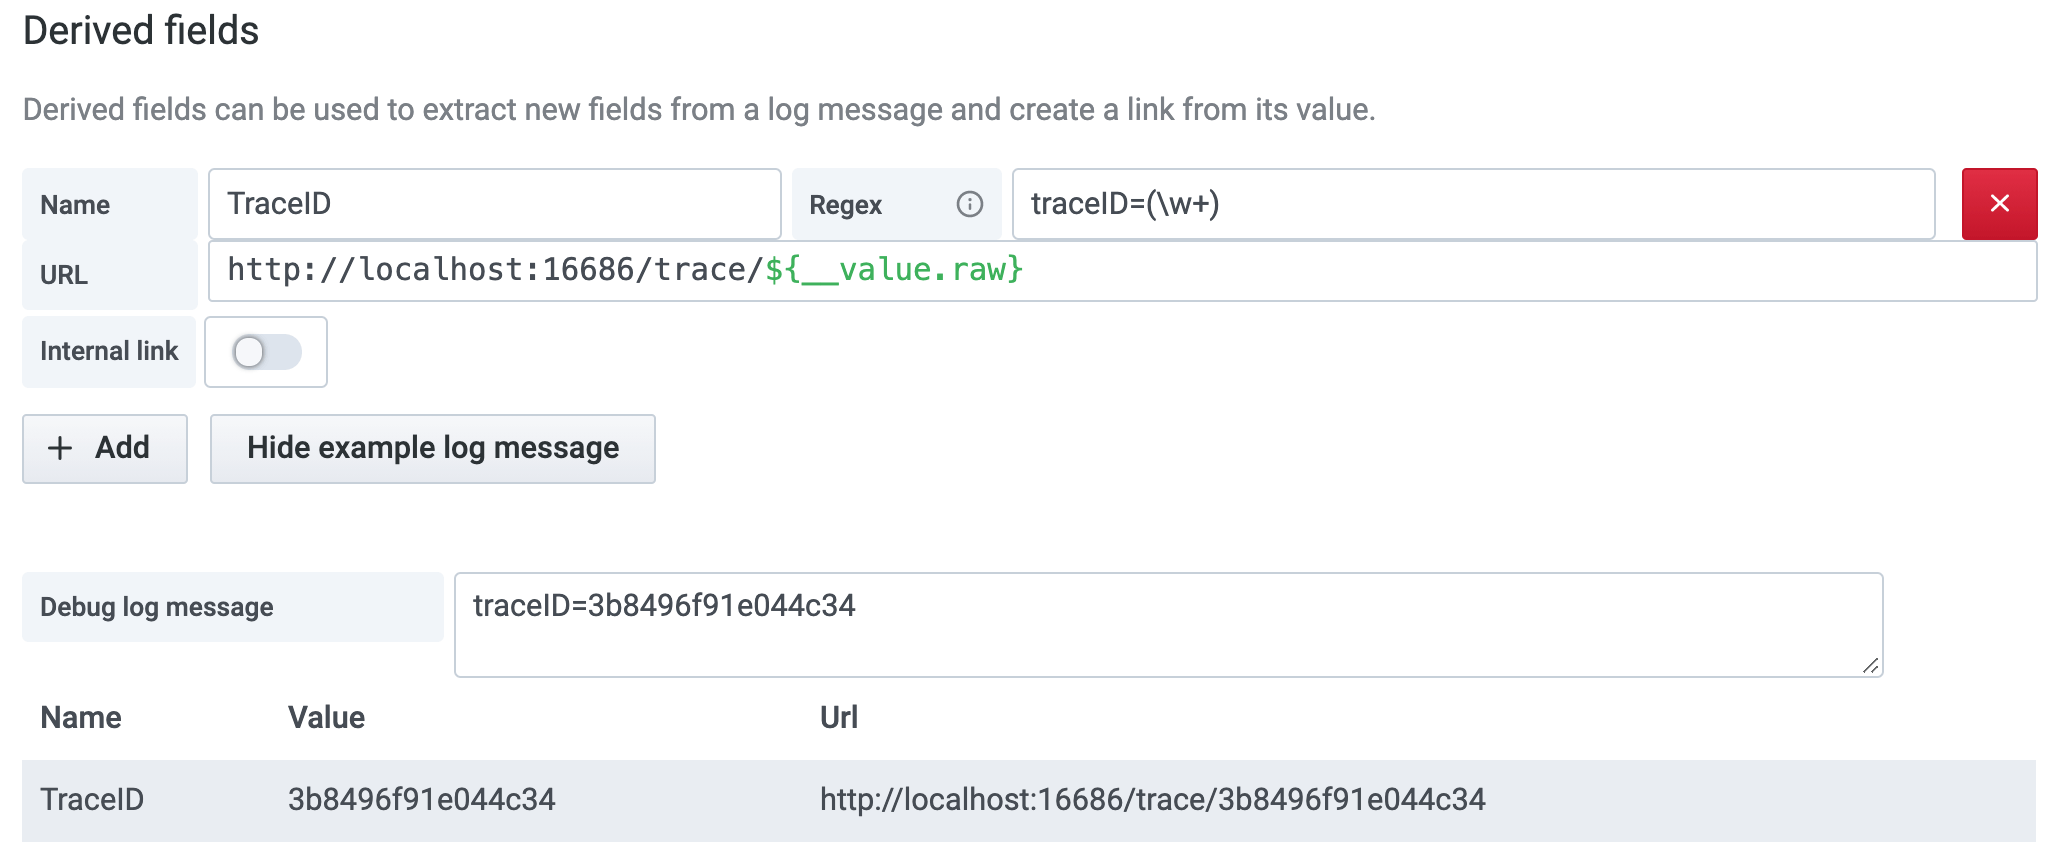
Each derived field consists of:
- Name - Shown in the log details as a label.
- Regex - A Regex pattern that runs on the log message and captures part of it as the value of the new field. Can only contain a single capture group.
- URL/query - If the link is external, then enter the full link URL. If the link is internal link, then this input serves as query for the target data source. In both cases, you can interpolate the value from the field with
${__value.raw}macro. - URL Label - (Optional) Set a custom display label for the link. The link label defaults to the full external URL or name of the linked internal data source and is overridden by this setting.
- Internal link - Select if the link is internal or external. In case of internal link, a data source selector allows you to select the target data source. Only tracing data sources are supported.
You can use a debug section to see what your fields extract and how the URL is interpolated. Click Show example log message to show the text area where you can enter a log message.
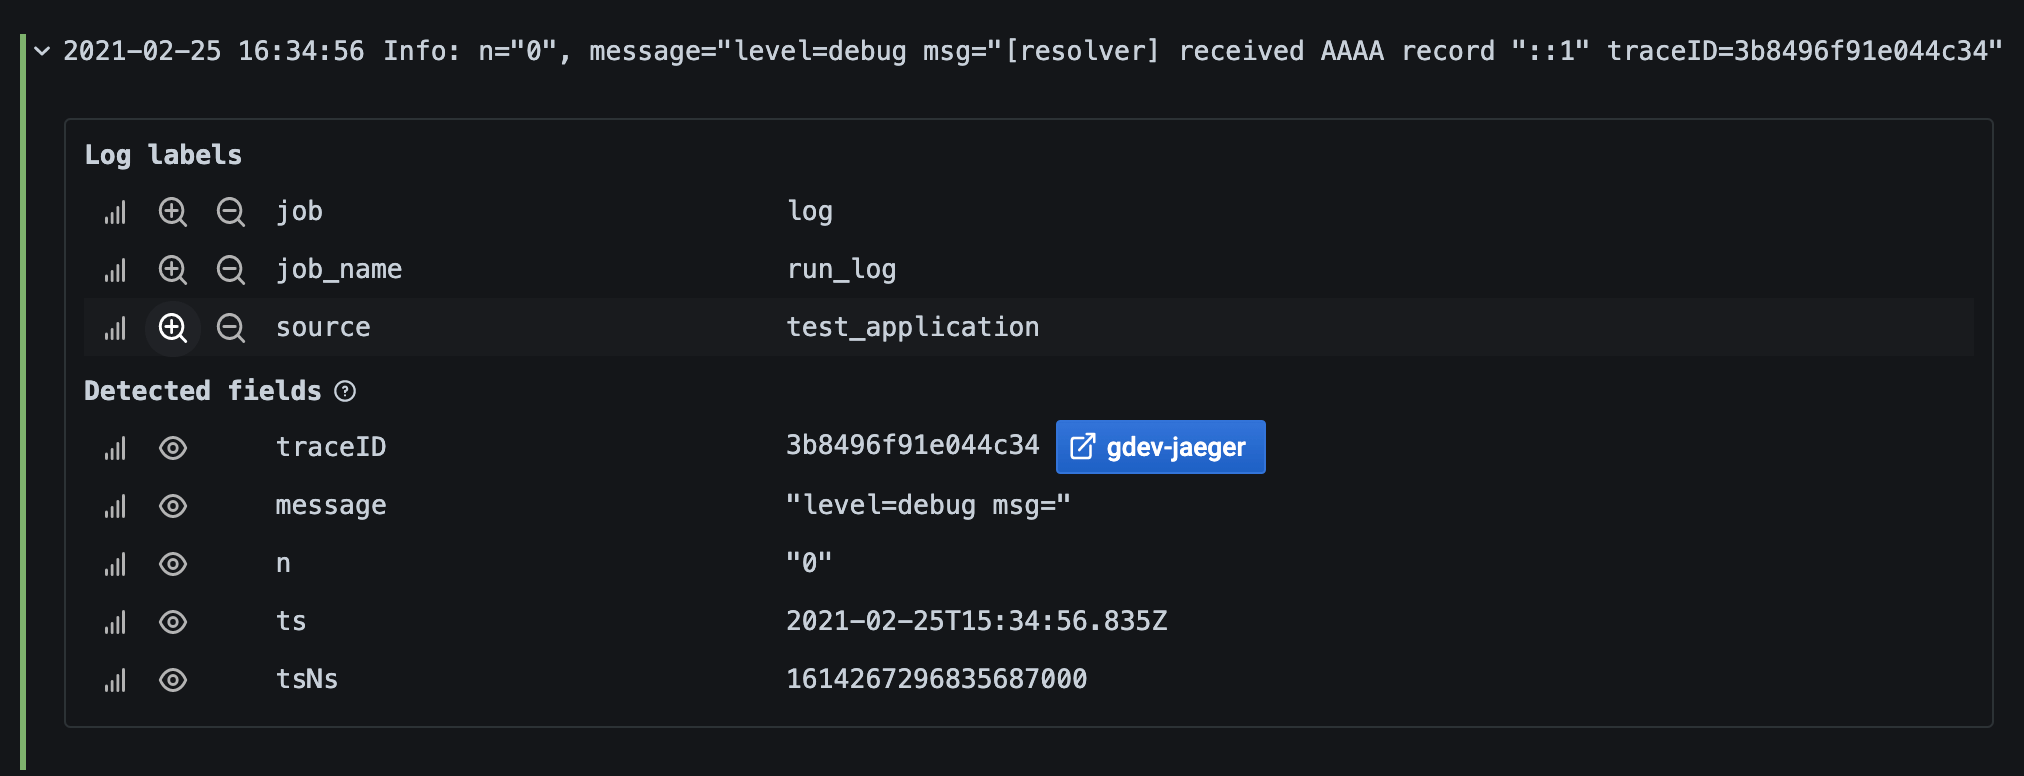
The new field with the link shown in log details:
Loki query editor
Loki query editor is separated into 2 distinct modes that you can switch between. See docs for each section below.
At the top of the editor, select Run queries to run a query. Select Builder | Code tabs to switch between the editor modes. If the query editor is in Builder mode, there are additional elements explained in the Builder section.
Note: In Explore, to run Loki queries, select
Run query.
Each mode is synchronized with the other modes, so you can switch between them without losing your work, although there are some limitations. Some more complex queries are not yet supported in the builder mode. If you try to switch from Code to Builder with such query, editor will show a popup explaining that you can lose some parts of the query, and you can decide if you still want to continue to Builder mode or not.
Code mode
Code mode allows you to write raw queries in a textual editor. It implements autocomplete features and syntax highlighting to help with writing complex queries. In addition, it also contains Log browser to further aid with writing queries (see more docs below).
For more information about Loki query language, refer to the Loki documentation.
Autocomplete
Autocomplete kicks automatically in appropriate times during typing. Autocomplete can suggest both static functions, aggregations and parsers but also dynamic items like labels. Autocomplete dropdown also shows documentation for the suggested items, either static one or dynamic metric documentation where available.
Log browser
With Loki log browser you can easily navigate through your list of labels and values and construct the query of your choice. Log browser has multi-step selection:
- Choose the labels you would like to consider for your search.
- Search for the values for selected labels. Search filed supports fuzzy search. Log browser also supports facetting and therefore it shows you only possible label combinations.
- Choose the type of query - logs query or rate metrics query. Additionally, you can also validate selector.

Options
Builder mode
Toolbar
In addition to Run query button and mode switcher, in builder mode additional elements are available:
Labels selector
Select desired labels and their values from the dropdown list. When label is selected, available values are fetched from the server. Use the + button to add more labels. Use the x button to remove a label.
Operations
Use the + Operations button to add operation to your query. Operations are grouped into sections for easier navigation. When the operations dropdown is open, write into the search input to search and filter operations list.
Operations in a query are shown as boxes in the operations section. Each has a header with a name and additional action buttons. Hover over the operation header to show the action buttons. Click the v button to quickly replace the operation with different one of the same type. Click the info button to open operations’ description tooltip. Click the x button to remove the operation.
Operation can have additional parameters under the operation header. See the operation description or Loki docs for more details about each operation.
Some operations make sense only in specific order, if adding an operation would result in nonsensical query, operation will be added to the correct place. To order operations manually drag operation box by the operation name and drop in appropriate place.
Hints
In same cases the query editor can detect which operations would be most appropriate for a selected log stream. In such cases it will show a hint next to the + Operations button. Click on the hint to add the operations to your query.
Explain mode
Explain mode helps with understanding the query. It shows a step by step explanation of all query parts and the operations.
Raw query
This section is shown only if the Raw query switch from the query editor top toolbar is set to on. It shows the raw query that will be created and executed by the query editor.
Querying with Loki
There are two types of LogQL queries:
- Log queries
- Metric queries
Log queries
Loki log queries return the contents of the log lines. Querying and displaying log data from Loki is available via Explore, and with the logs panel in dashboards. Select the Loki data source, and then enter a LogQL query to display your logs.F or more information about log queries and LogQL, refer to the Loki log queries documentation.
Log context
When using a search expression as detailed above, you can retrieve the context surrounding your filtered results.
By clicking the Show Context link on the filtered rows, you’ll be able to investigate the log messages that came before and after the
log message you’re interested in.
Live tailing
Loki supports Live tailing which displays logs in real-time. This feature is supported in Explore.
Note that Live Tailing relies on two Websocket connections: one between the browser and the Grafana server, and another between the Grafana server and the Loki server. If you run any reverse proxies, please configure them accordingly. The following example for Apache2 can be used for proxying between the browser and the Grafana server:
ProxyPassMatch "^/(api/datasources/proxy/\d+/loki/api/v1/tail)" "ws://127.0.0.1:3000/$1"The following example shows basic NGINX proxy configuration. It assumes that the Grafana server is available at http://localhost:3000/, Loki server is running locally without proxy, and your external site uses HTTPS. If you also host Loki behind NGINX proxy, then you might want to repeat the following configuration for Loki as well.
In the http section of NGINX configuration, add the following map definition:
  map $http_upgrade $connection_upgrade {
    default upgrade;
    '' close;
  }
In your server section, add the following configuration:
  location ~ /(api/datasources/proxy/\d+/loki/api/v1/tail) {
      proxy_pass          http://localhost:3000$request_uri;
      proxy_set_header    Host              $host;
      proxy_set_header    X-Real-IP         $remote_addr;
      proxy_set_header    X-Forwarded-for   $proxy_add_x_forwarded_for;
      proxy_set_header    X-Forwarded-Proto "https";
      proxy_set_header    Connection        $connection_upgrade;
      proxy_set_header    Upgrade           $http_upgrade;
  }

  location / {
      proxy_pass          http://localhost:3000/;
      proxy_set_header    Host              $host;
      proxy_set_header    X-Real-IP         $remote_addr;
      proxy_set_header    X-Forwarded-for   $proxy_add_x_forwarded_for;
      proxy_set_header    X-Forwarded-Proto "https";
  }
Note: This feature is only available in Grafana v6.3+.
Metric queries
LogQL supports wrapping a log query with functions that allow for creating metrics out of the logs. For more information about metric queries, refer to the Loki metric queries documentation
Templating
Instead of hard-coding things like server, application and sensor name in your metric queries, you can use variables in their place. Variables are shown as drop-down select boxes at the top of the dashboard. These drop-down boxes make it easy to change the data being displayed in your dashboard.
Check out the Templating documentation for an introduction to the templating feature and the different types of template variables.
Query variable
Variable of the type Query allows you to query Loki for a list labels or label values. The Loki data source plugin provides a form to select the type of values that can be expected for a given variable. The form has these options:
Ad hoc filters variable
Loki supports the special ad hoc filters variable type. It allows you to specify any number of label/value filters on the fly. These filters are automatically applied to all your Loki queries.
Using interval and range variables
You can use some global built-in variables in query variables; $__interval, $__interval_ms, $__range, $__range_s and $__range_ms. For more information, refer to Global built-in variables.
Annotations
You can use any non-metric Loki query as a source for annotations. Log content will be used as annotation text and your log stream labels as tags, so there is no need for additional mapping.
Configure the data source with provisioning
You can set up the data source via config files with Grafana’s provisioning system. You can read more about how it works and all the settings you can set for data sources on the provisioning docs page
Here is an example:
apiVersion: 1

datasources:
  - name: Loki
    type: loki
    access: proxy
    url: http://localhost:3100
    jsonData:
      maxLines: 1000
Here’s another with basic auth and derived field. Keep in mind that $ character needs to be escaped in YAML values as it is used to interpolate environment variables:
apiVersion: 1

datasources:
  - name: Loki
    type: loki
    access: proxy
    url: http://localhost:3100
    basicAuth: true
    basicAuthUser: my_user
    jsonData:
      maxLines: 1000
      derivedFields:
        # Field with internal link pointing to data source in Grafana.
        # Right now, Grafana supports only Jaeger and Zipkin data sources as link targets.
        # datasourceUid value can be anything, but it should be unique across all defined data source uids.
        - datasourceUid: my_jaeger_uid
          matcherRegex: "traceID=(\\w+)"
          name: TraceID
          # url will be interpreted as query for the datasource
          url: '$${__value.raw}'

        # Field with external link.
        - matcherRegex: "traceID=(\\w+)"
          name: TraceID
          url: 'http://localhost:16686/trace/$${__value.raw}'
    secureJsonData:
      basicAuthPassword: test_password
Here’s an example of a Jaeger data source corresponding to the above example. Note that the Jaeger uid value does match the Loki datasourceUid value.
datasources:
    - name: Jaeger
      type: jaeger
      url: http://jaeger-tracing-query:16686/
      access: proxy
      # UID should match the datasourceUid in dervidedFields.
      uid: my_jaeger_uid

