Important: This documentation is about an older version. It's relevant only to the release noted, many of the features and functions have been updated or replaced. Please view the current version.
Create and manage reports
Note: Looking for prebuilt Grafana dashboards? Check out our full library of dashboards and more →
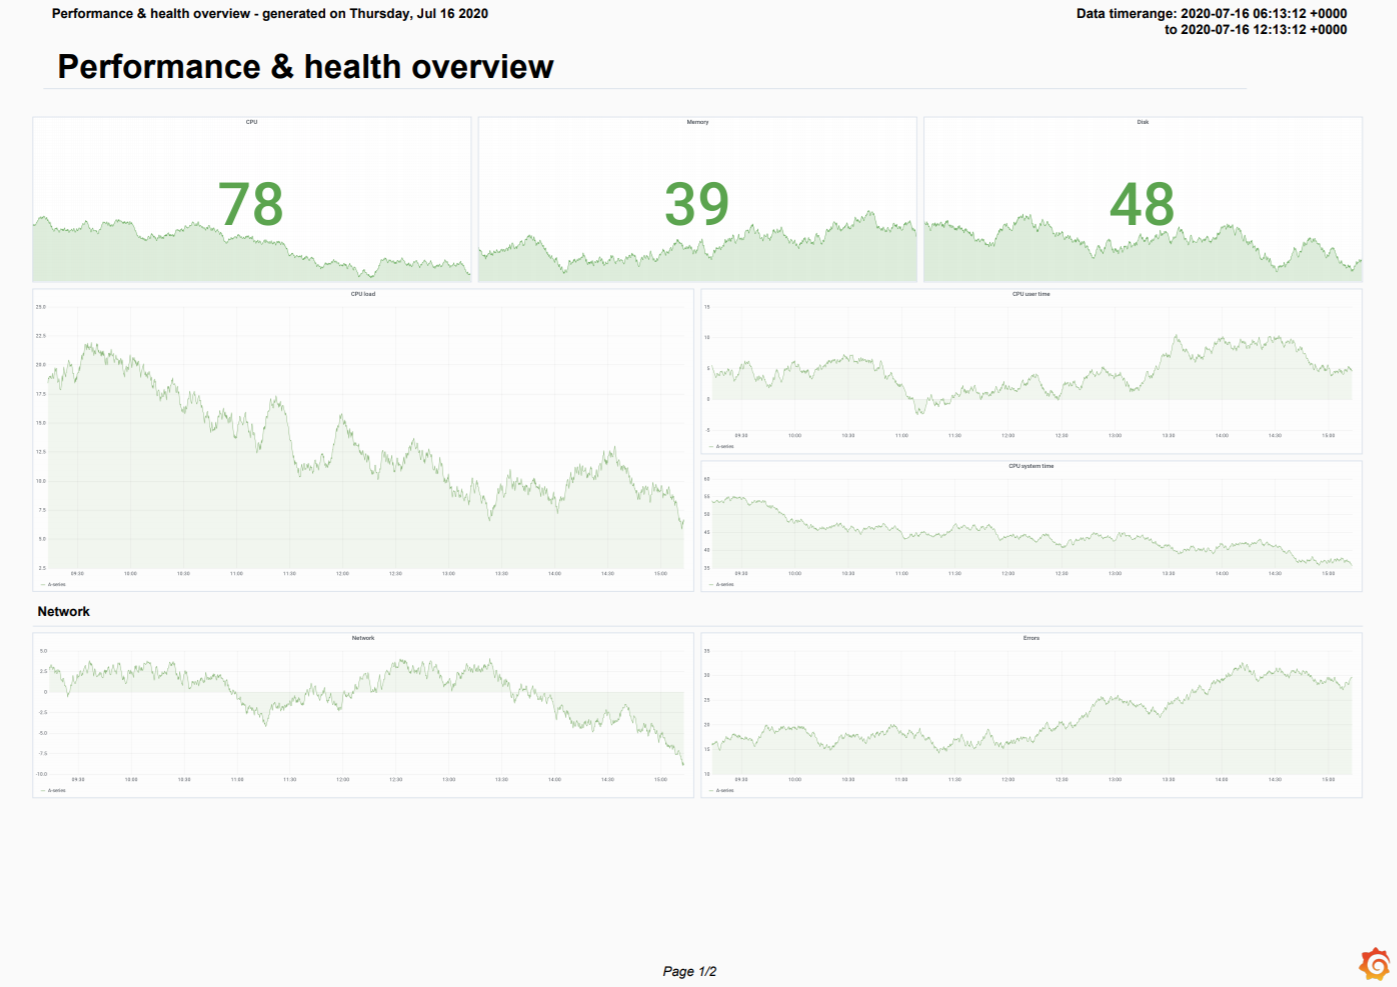
Reporting enables you to automatically generate PDFs from any of your dashboards and have Grafana email them to interested parties on a schedule. This is available in Grafana Cloud Pro and Advanced and in Grafana Enterprise.
If you have Role-based access control enabled, for some actions you would need to have relevant permissions. Refer to specific guides to understand what permissions are required.

Any changes you make to a dashboard used in a report are reflected the next time the report is sent. For example, if you change the time range in the dashboard, then the time range in the report also changes.
For information about recent improvements to the reporting UI, refer to Grafana reporting: How we improved the UX in Grafana.
Requirements
- SMTP must be configured for reports to be sent. Refer to SMTP in Configuration for more information.
- The Image Renderer plugin must be installed or the remote rendering service must be set up. Refer to Image rendering for more information.
Access control
When RBAC is enabled, you need to have the relevant Permissions to create and manage reports.
Create or update a report
Only organization administrators can create reports by default. You can customize who can create reports with Role-based access control.
Click on the Reports icon in the side navigation menu.
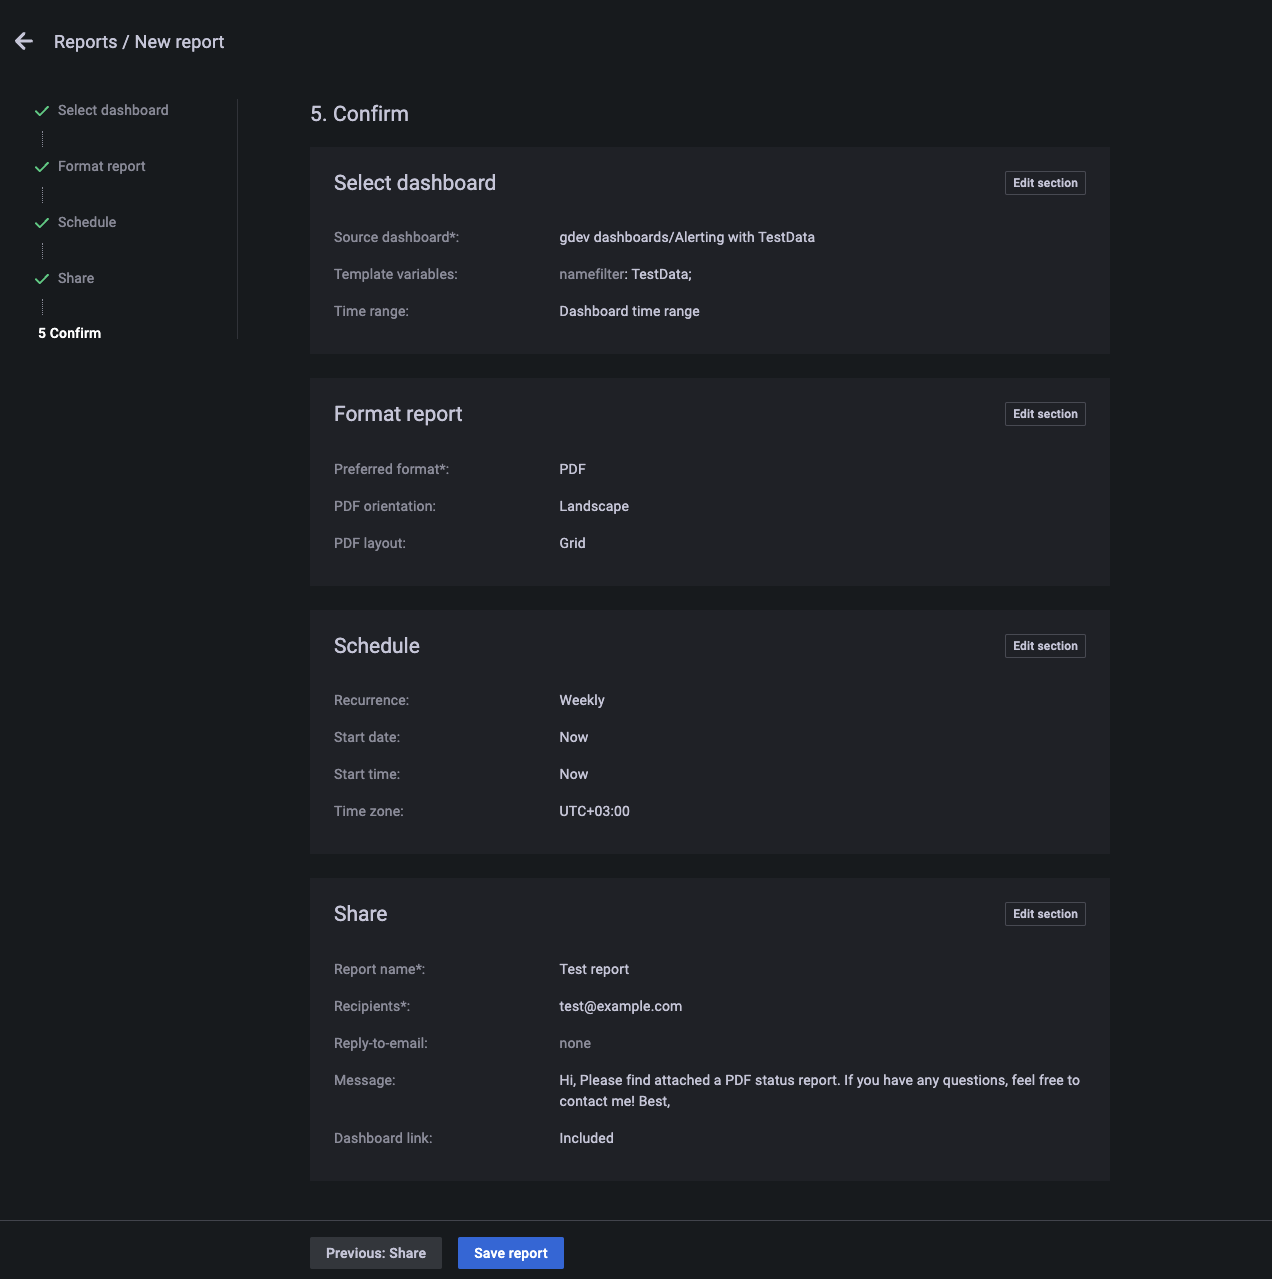
The Reports tab allows you to view, create, and update your reports. The report form has a multi-step layout. The steps do not need to be completed in succession and can be skipped over by clicking a step name.
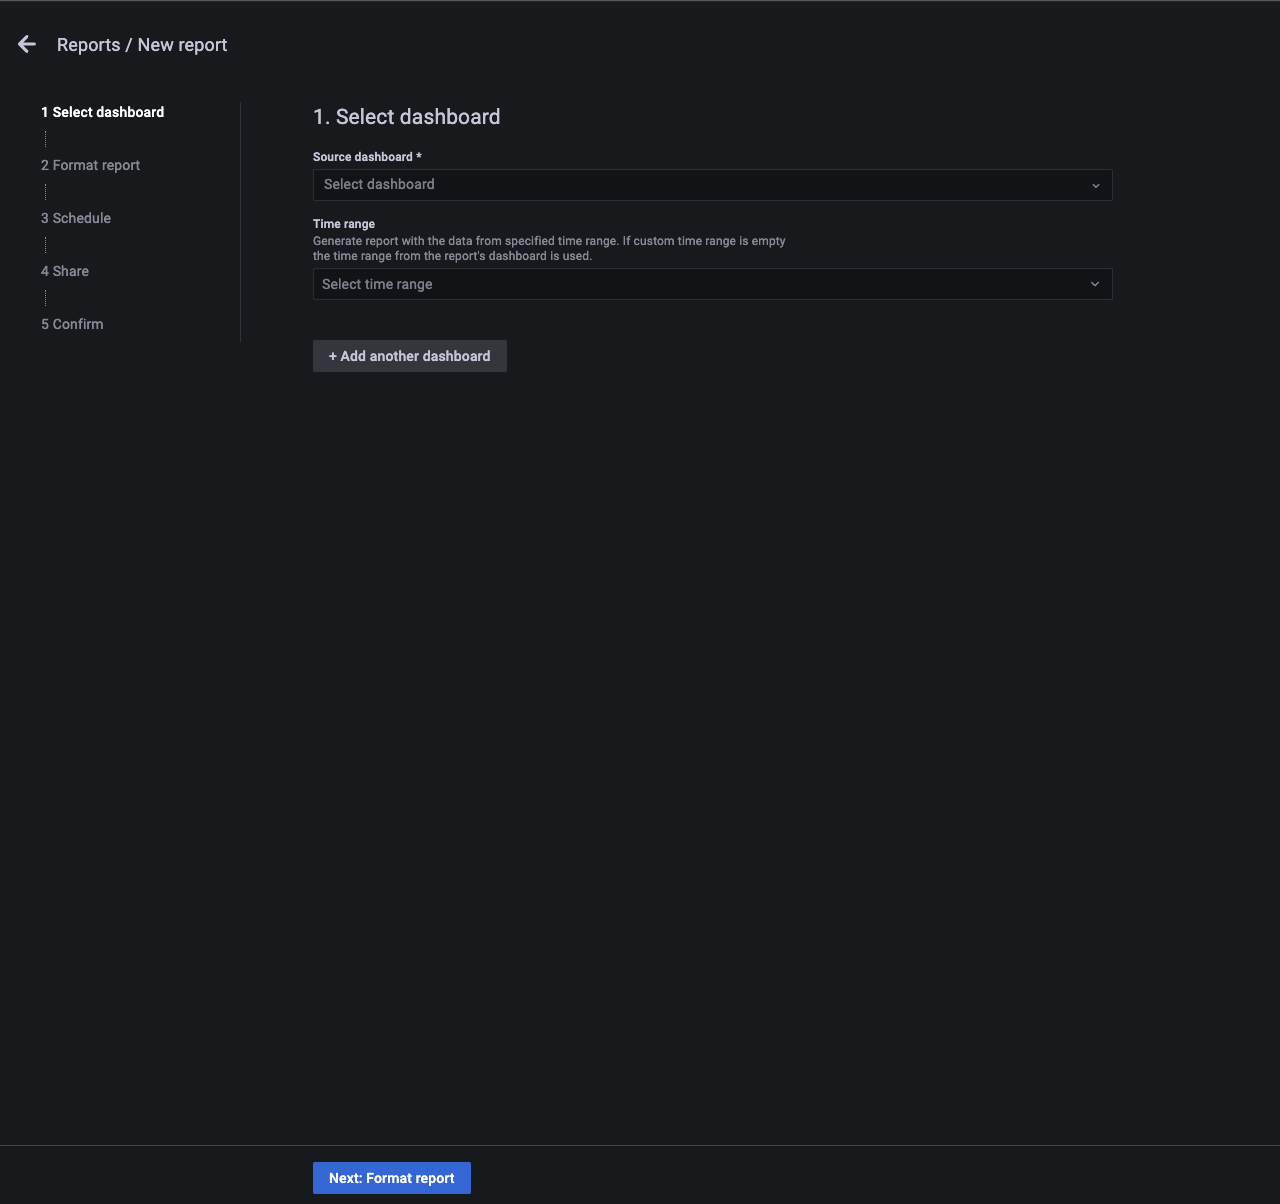
Select report dashboard.
- Source dashboard: Select the dashboard from which you want to generate the report.
- Time range: (optional) Use custom time range for the report. For more information, refer to Report time range.
- Add another dashboard: Add more than one dashboard to the report.
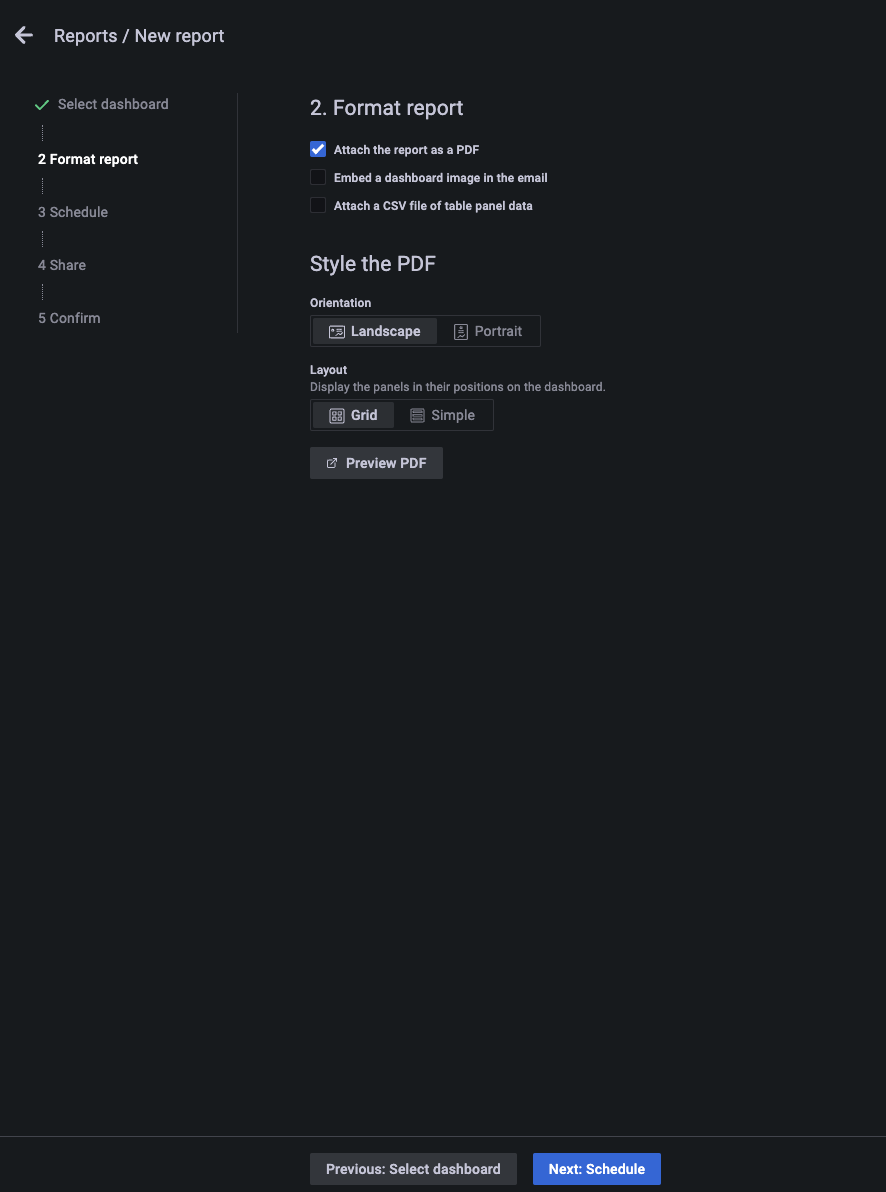
Format the report.
- Choose format options for the report: Select at least one option. Attach report as PDF, embed dashboard as an image, or attach CSV file of table panel data.
- If you selected the PDF format option:
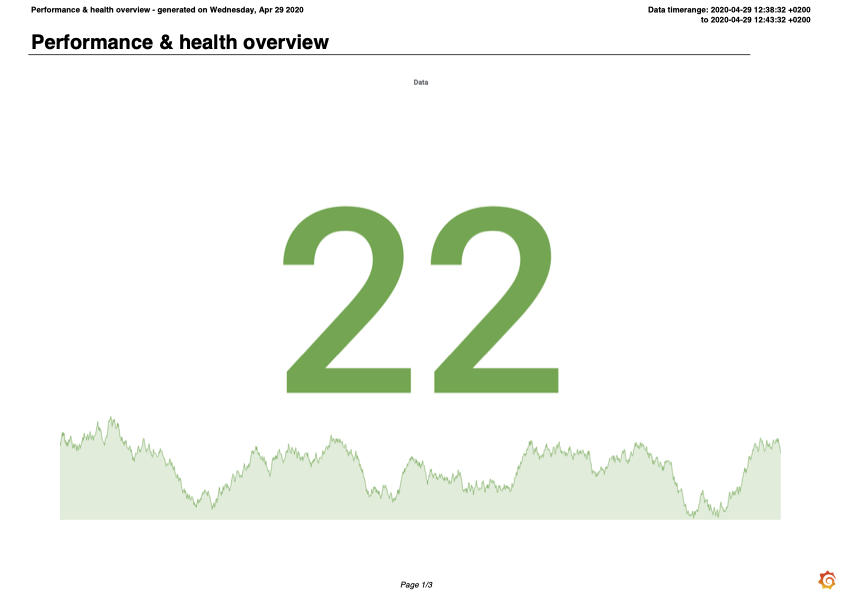
- Select an orientation for the report: Portrait or Landscape.
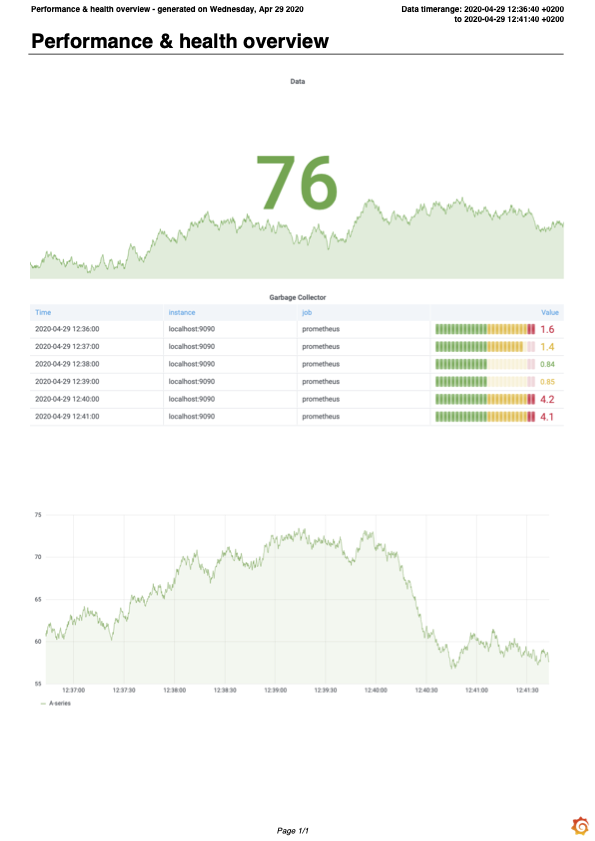
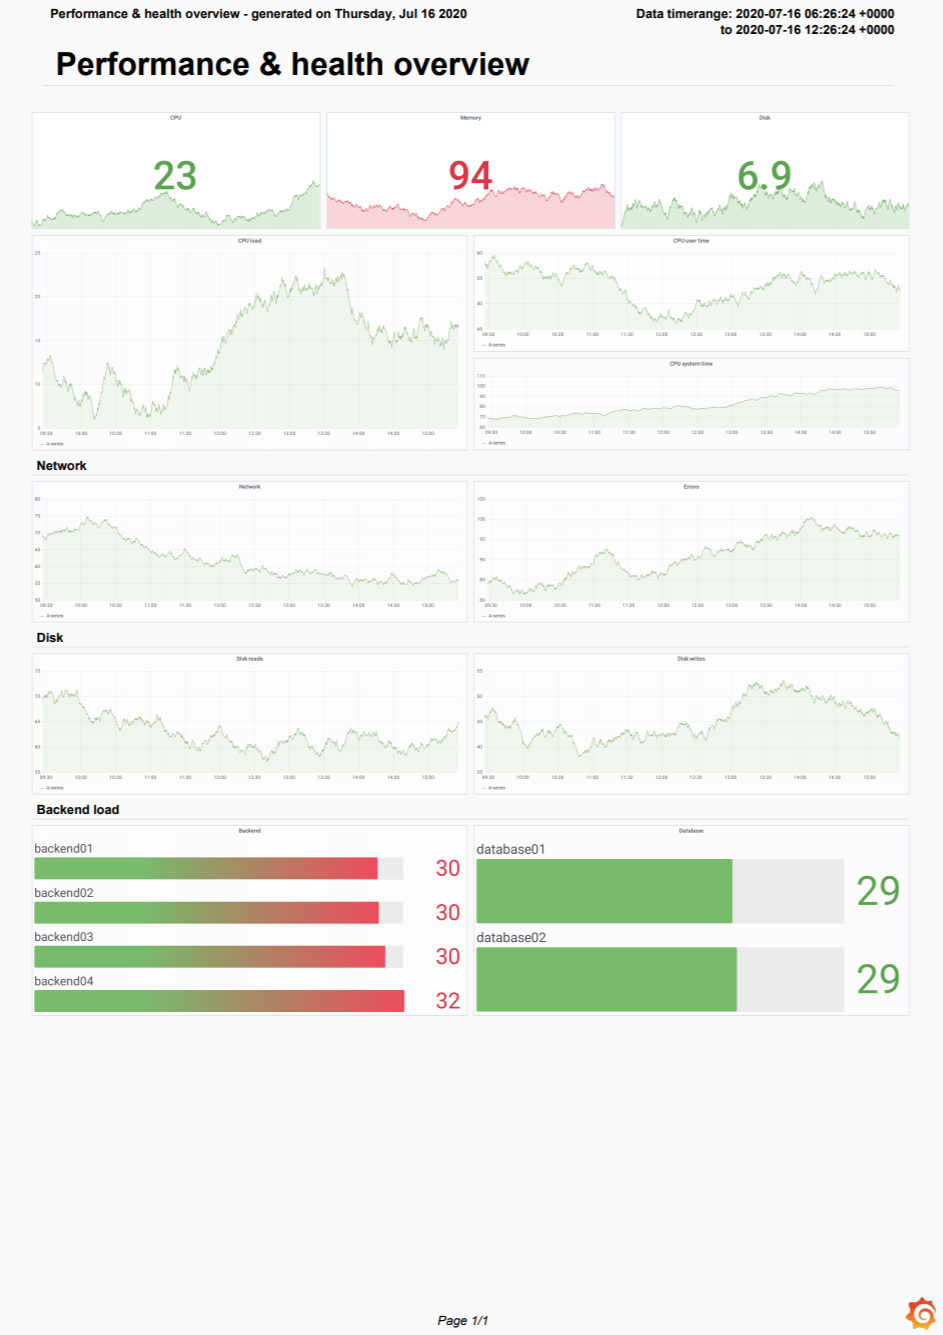
- Select a layout for the generated report: Simple or Grid. The simple layout renders each panel as full-width across the PDF. The grid layout renders the PDF with the same panel arrangement and width as the source dashboard.
- Click Preview PDF to view a rendered PDF with the options you selected.
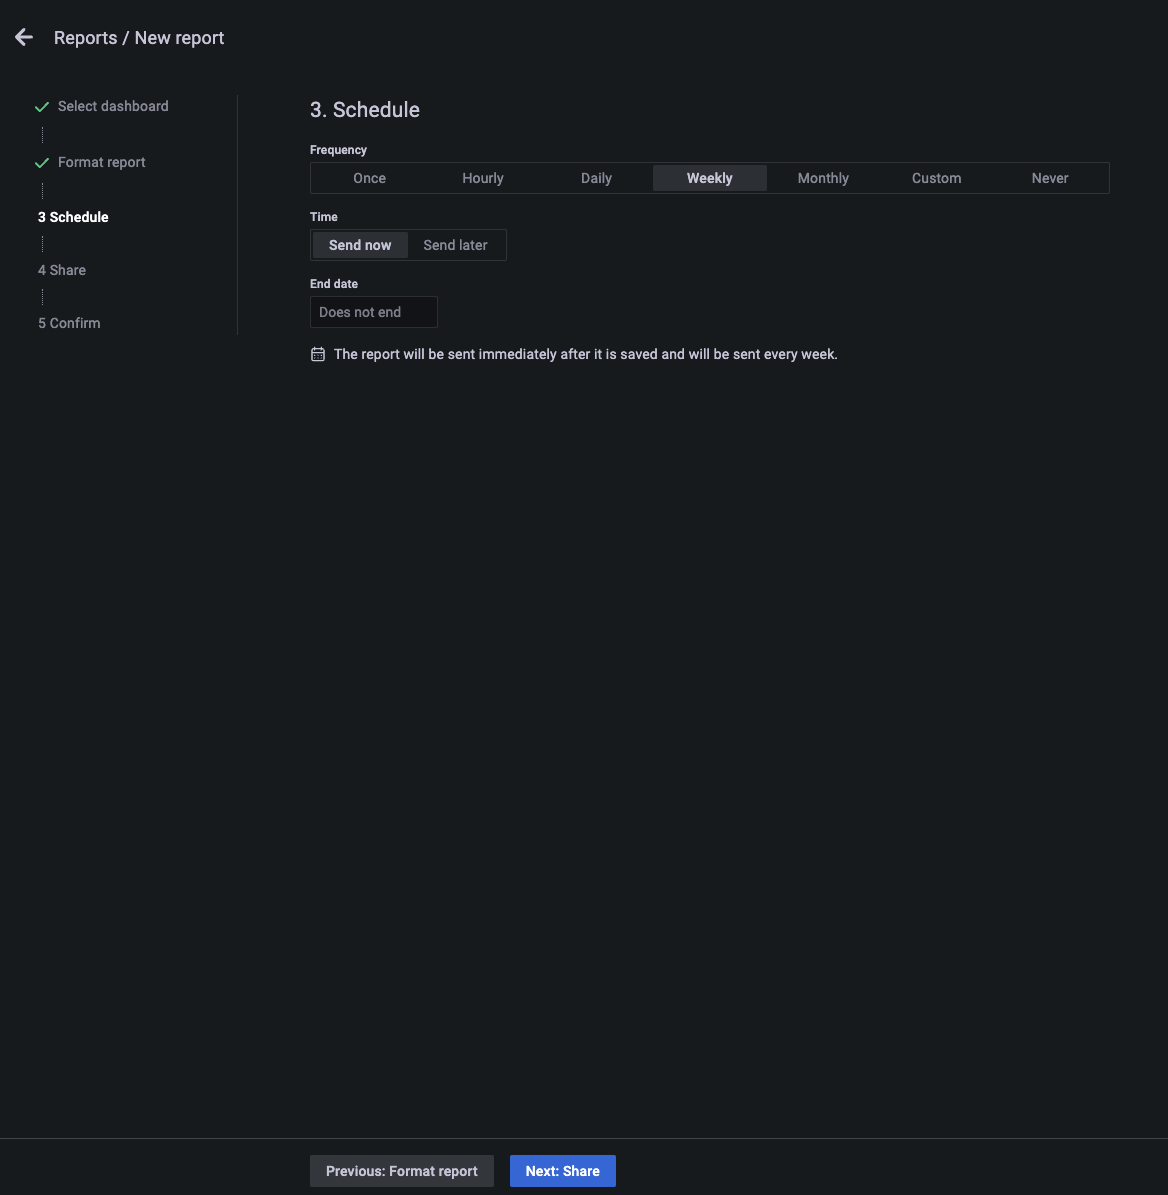
Schedule report.
- Enter scheduling information. Options vary depending on the frequency selected.
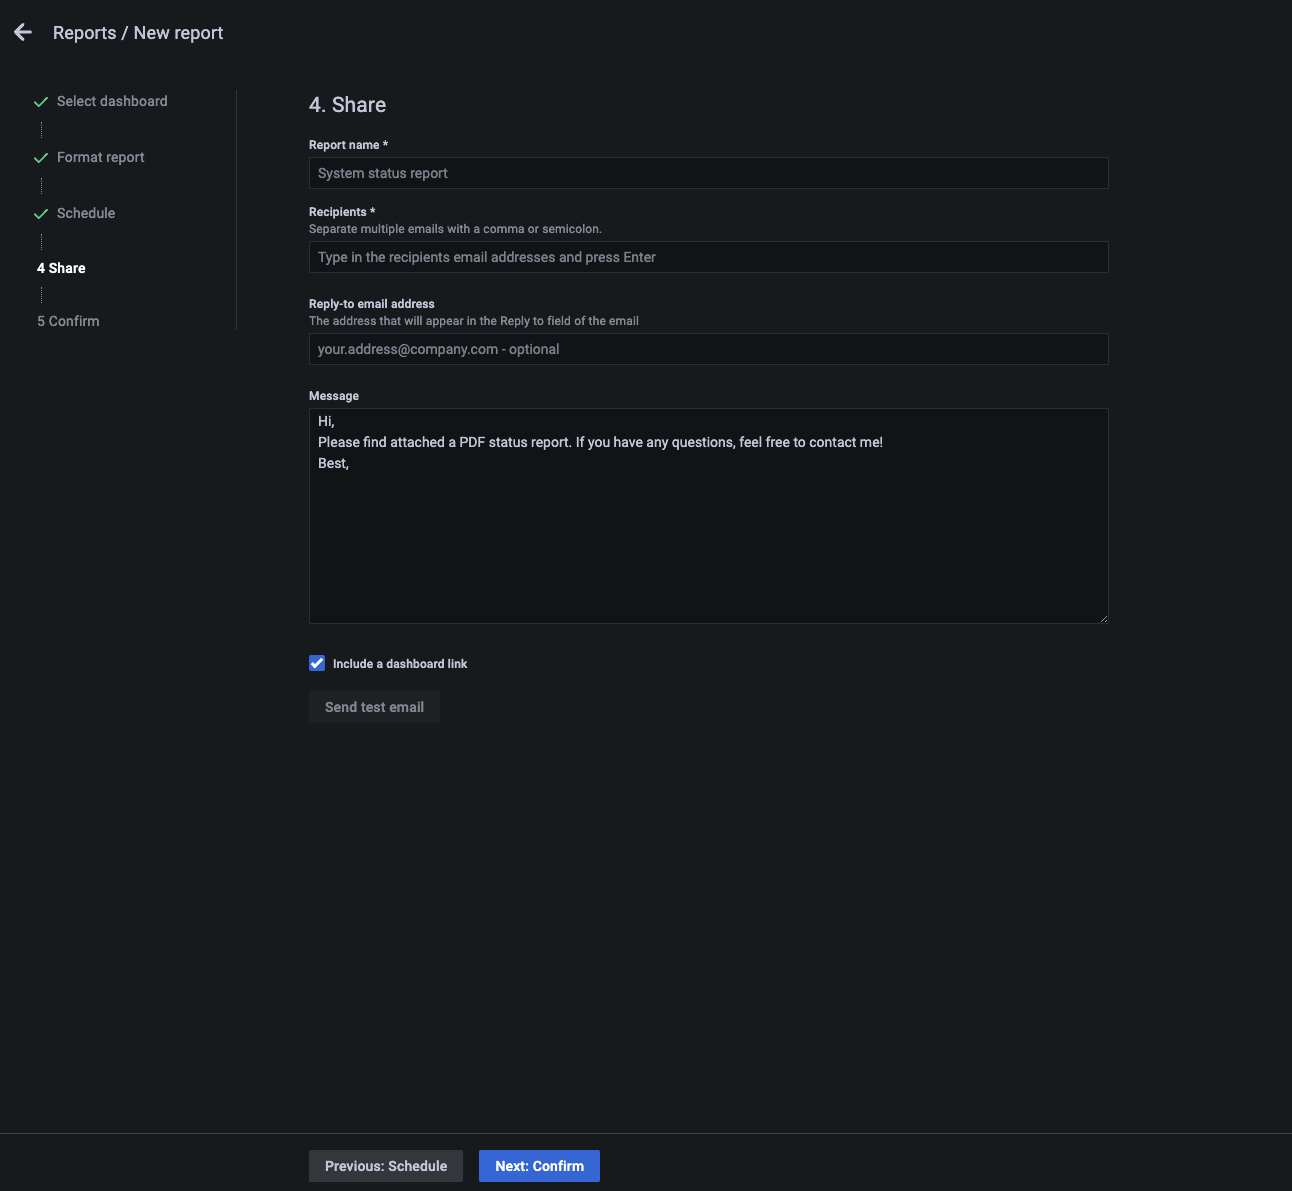
Enter report information. All fields are required unless otherwise indicated.
- Report name: Name of the report as you want it to appear in the Reports list. The report name populates the email subject line.
- Recipients: Enter the emails of the people or teams that you want to receive the report, separated by commas or semicolons.
- Reply to: (optional) The address that appears in the Reply to field of the email.
- Message: (optional) Message body in the email with the report.
- Include a dashboard link: Include a link to the dashboard from within the report email.
- Send test email: To verify that the configuration works as expected. You can choose to send this email to the recipients configured for the report, or to a different set of email addresses only used for testing.
Preview and save the report.
Choose template variables
Note: Available in Grafana Enterprise version 7.5 and later behind the
reportVariablesfeature flag, Grafana Enterprise version 8.0 and later without a feature flag, and Grafana Cloud Pro and Advanced.
You can configure report-specific template variables for the dashboard on the report page. The variables that you select will override the variables from the dashboard, and they are used when rendering a PDF file of the report. For detailed information about using template variables, refer to the Templates and variables section.
Note: The query variables saved with a report might become of date if the results of that query change. For example, if your template variable queries for a list of hostnames and a new hostname is added, then it will not be included in the report. If that occurs, the selected variables must be manually updated in the report. If you select the
Allvalue for the template variable or if you keep the dashboard’s original variable selection, then the report stays up-to-date as new values are added.
Render a report with panels or rows set to repeat by a variable
Note: Available in Grafana Enterprise version 8.0 and later, and Grafana Cloud Pro and Advanced.
You can include dynamic dashboards with panels or rows, set to repeat by a variable, into reports. For detailed information about setting up repeating panels or rows in dashboards, refer to Repeat panels or rows.
Caveats
- Rendering repeating panels for dynamic variable types (for example,
queryvariables) with selectedAllvalue is currently not supported. As a workaround, select all the values. - If you select different template variables in a report for a dashboard with repeating rows, you might see empty space or missing values at the bottom of the report. This is because the dimensions of the panels from the dashboard are used to generate the report. To avoid this issue
- use the dashboard’s original template variables for the report, or make a copy of the dashboard
- select the new set of template variables
- generate a report based on the copied dashboard.
- Rendering of the repeating panels inside collapsed rows in reports is not supported.
Report time range
Note: You can set custom report time ranges in Grafana Enterprise 7.2+ and Grafana Cloud Pro and Advanced.
By default, reports use the saved time range of the dashboard. You can change the time range of the report by:
- Saving a modified time range to the dashboard.
- Setting a time range via the Time range field in the report form. If specified, the custom time range overrides the time range from the report’s dashboard.
The page header of the report displays the time range for the dashboard’s data queries. Dashboards set to use the browser’s time zone use the time zone on the Grafana server.
If the time zone is set differently between your Grafana server and its remote image renderer, then the time ranges in the report might be different between the page header and the time axes in the panels. To avoid this, set the time zone to UTC for dashboards when using a remote renderer. Each dashboard’s time zone setting is visible in the time range controls.
Layout and orientation
We’re actively developing new report layout options. Contact us to get involved in the design process.
CSV export
Note: Available in Grafana Enterprise 8+ with the Grafana image renderer plugin v3.0+, and Grafana Cloud Pro and Advanced.
You can attach a CSV file to the report email for each table panel on the selected dashboard, along with the PDF report. By default, CSVs larger than 10Mb are not sent which keeps email servers from rejecting the email. You can increase or decrease this limit in the reporting configuration.
This feature relies on the same plugin that supports the image rendering features.
When the CSV file is generated, it is temporarily written to the csv folder in the Grafana data folder.
A background job runs every 10 minutes and removes temporary CSV files. You can configure how long a CSV file should be stored before being removed by configuring the temp-data-lifetime setting. This setting also affects how long a renderer PNG file should be stored.
Scheduling
Note: Available in Grafana Enterprise version 8.0 and later, and Grafana Cloud Pro and Advanced. The scheduler was significantly changed in Grafana Enterprise version 8.1.
Scheduled reports can be sent once, or repeated on an hourly, daily, weekly, or monthly basis, or sent at custom intervals. You can also disable scheduling by selecting Never, for example to send the report via the API.
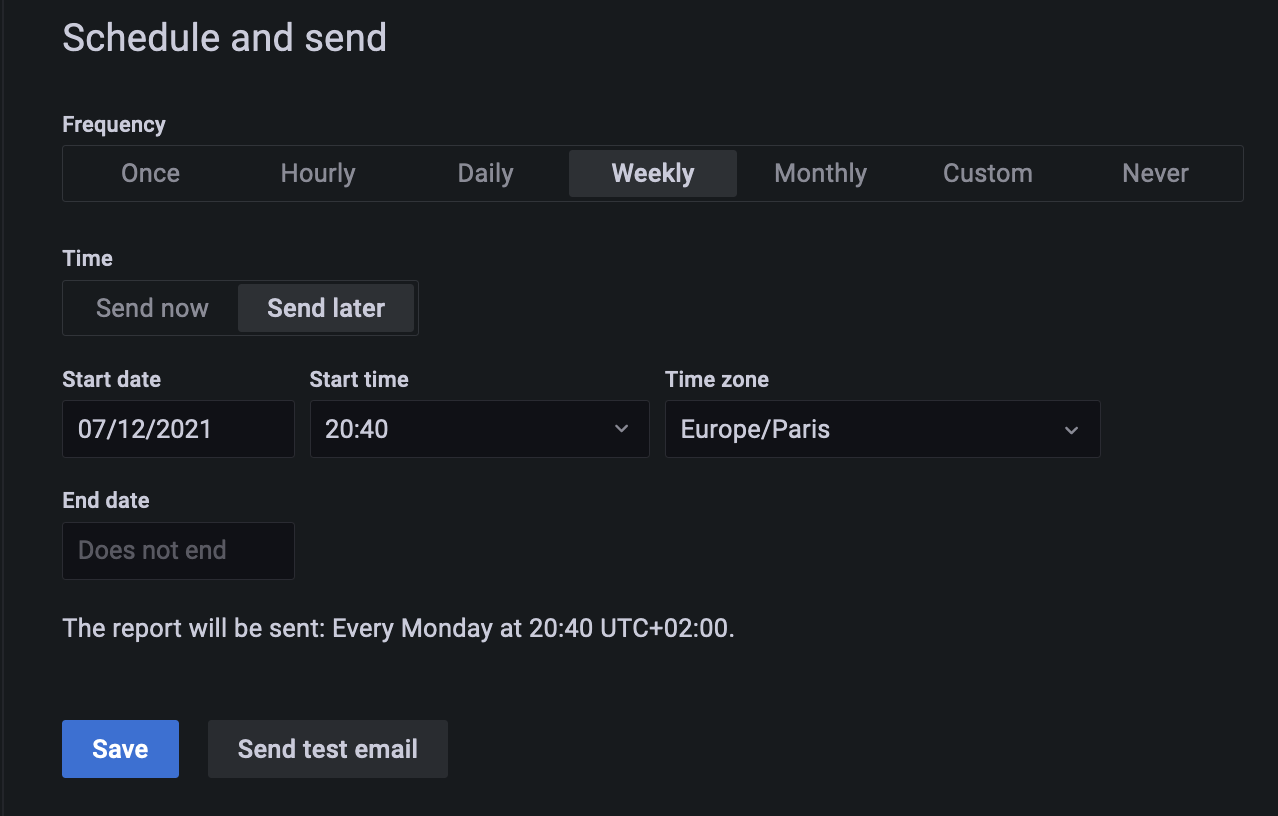
Send now or schedule for later
Send now sends the report immediately after you save it. To stop sending the report at some point in the future, add an end date. If you leave the end date empty, the report is sent out indefinitely.
Send later schedules a report for a later date. Thus, the start date and time are required fields. If you leave the end date empty, the report is sent out indefinitely.
Send only from Monday to Friday
For reports that have an hourly or daily frequency, you can choose to send them only from Monday to Friday.
Send on the last day of the month
When you schedule a report with a monthly frequency, and set the start date between the 29th and the 31st of the month, the report is only sent during the months that have those dates. If you want the report to be sent every month, select the Send on the last day of the month option instead. This way, the report is sent on the last day of every month regardless of how many days there are in any given month.
Send a test email
Note: Available in Grafana Enterprise version 7.0 and later, and Grafana Cloud Pro and Advanced.
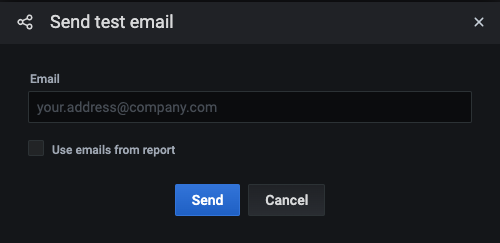
- In the report, click Send test email.
- In the Email field, enter the email address or addresses that you want to test, separated by a semicolon. If you want to use email addresses from the report, then select the Use emails from report check box.
- Click Send.
The last saved version of the report will be sent to selected emails. You can use this to verify emails are working and to make sure the report is generated and displayed as you expect.
Pause a report
Note: Available in Grafana Enterprise version 8.0 and later, and Grafana Cloud Pro and Advanced.
You can pause sending reports from the report list view by clicking the pause icon. The report will not be sent according to its schedule until it is resumed by clicking the resume button on the report row.
Add multiple dashboards to a report
Note: Available in Grafana Enterprise version 9.0 and later, and Grafana Cloud Pro and Advanced.
You can add more than one dashboard to a report. Additional dashboards will be rendered as new pages in the same PDF file, or additional images if you chose to embed images in your report email. You cannot add the same dashboard to a report multiple times.
Embed a dashboard as an image into a report
Note: Available in Grafana Enterprise version 9.0 and later, and Grafana Cloud Pro and Advanced.
You can send a report email with an image of the dashboard embedded in the email instead of attached as a PDF. In this case, the email recipients can see the dashboard at a glance instead of having to open the PDF.
Export dashboard as PDF
You can generate and save PDF files of any dashboard.
Note: Available in Grafana Enterprise.
In the upper-right corner of the dashboard that you want to export as PDF, click the Share dashboard icon.
On the PDF tab, select a layout option for the exported dashboard: Portrait or Landscape.
Click Save as PDF to render the dashboard as a PDF file.
Grafana opens the PDF file in a new window or browser tab.
Send a report via the API
You can send reports programmatically with the send report endpoint in the HTTP APIs.
Rendering configuration
When generating reports, each panel renders separately before being collected in a PDF. You can configure the per-panel rendering timeout and number of concurrently rendered panels.
To make a panel more legible, you can set a scale factor for the rendered images. However, a higher scale factor increases the file size of the generated PDF.
You can also specify custom fonts that support different Unicode scripts. The DejaVu font is the default used for PDF rendering.
These options are available in the configuration file.
[reporting]
# Use this option to enable or disable the reporting feature. When disabled, no reports are generated, and the UI is hidden. By default, reporting is enabled.
enabled = true
# Set timeout for each panel rendering request
rendering_timeout = 10s
# Set maximum number of concurrent calls to the rendering service
concurrent_render_limit = 4
# Set the scale factor for rendering images. 2 is enough for monitor resolutions
# 4 would be better for printed material. Setting a higher value affects performance and memory
image_scale_factor = 2
# Set the maximum file size in megabytes for the CSV attachments
max_attachment_size_mb = 10
# Path to the directory containing font files
fonts_path =
# Name of the TrueType font file with regular style
font_regular = DejaVuSansCondensed.ttf
# Name of the TrueType font file with bold style
font_bold = DejaVuSansCondensed-Bold.ttf
# Name of the TrueType font file with italic style
font_italic = DejaVuSansCondensed-Oblique.ttf
Report settings
Note: Available in Grafana Enterprise version 7.2 and later, and Grafana Cloud Pro and Advanced.
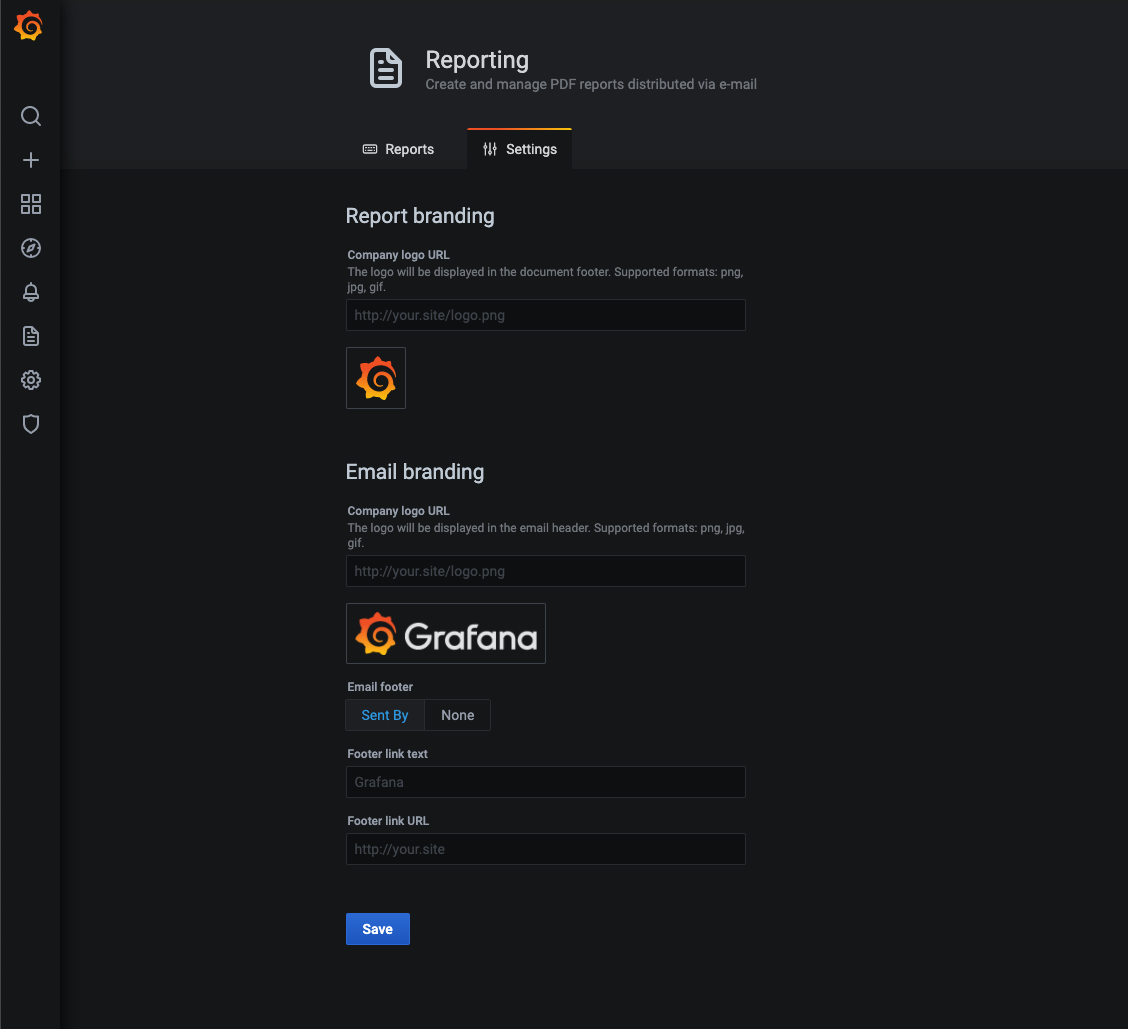
You can configure organization-wide report settings in the Settings tab on the Reporting page. Settings are applied to all the reports for current organization.
You can customize the branding options.
Report branding:
- Company logo URL: Company logo displayed in the report PDF. Defaults to the Grafana logo.
Email branding:
- Company logo URL: Company logo displayed in the report PDF. Defaults to the Grafana logo.
- Email footer: Toggle to enable the report email footer. Select Sent by or None.
- Footer link text: Text of the link in the report email footer. Defaults to
Grafana. - Footer link URL: Link of the report email footer.
Troubleshoot reporting
To troubleshoot and get more log information, enable debug logging in the configuration file. Refer to Configuration for more information.
[log]
filters = report:debug