Important: This documentation is about an older version. It's relevant only to the release noted, many of the features and functions have been updated or replaced. Please view the current version.
Using MySQL in Grafana
Only available in Grafana v4.3+. This data source is not ready for production use, currently in development (alpha state).
Grafana ships with a built-in MySQL data source plugin that allow you to query any visualize data from a MySQL compatible database.
Adding the data source
- Open the side menu by clicking the Grafana icon in the top header.
- In the side menu under the
Dashboardslink you should find a link namedData Sources. - Click the
+ Add data sourcebutton in the top header. - Select MySQL from the Type dropdown.
Database User Permissions (Important!)
The database user you specify when you add the data source should only be granted SELECT permissions on
the specified database & tables you want to query. Grafana does not validate that the query is safe. The query
could include any SQL statement. For example, statements like USE otherdb; and DROP TABLE user; would be
executed. To protect against this we Highly recommmend you create a specific mysql user with
restricted permissions.
Example:
 CREATE USER 'grafanaReader' IDENTIFIED BY 'password';
 GRANT SELECT ON mydatabase.mytable TO 'grafanaReader';
You can use wildcards (*) in place of database or table if you want to grant access to more databases and tables.
Macros
To simplify syntax and to allow for dynamic parts, like date range filters, the query can contain macros.
We plan to add many more macros. If you have suggestions for what macros you would like to see, please open an issue in our GitHub repo.
The query editor has a link named Generated SQL that show up after a query as been executed, while in panel edit mode. Click
on it and it will expand and show the raw interpolated SQL string that was executed.
Table queries
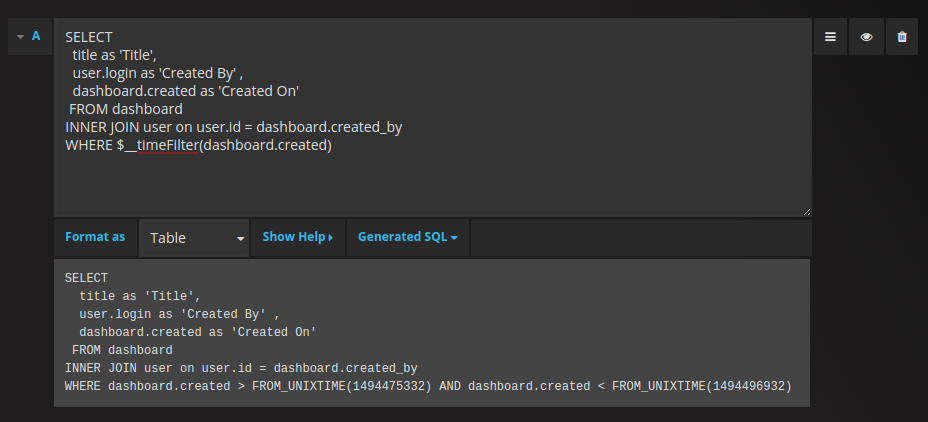
If the Format as query option is set to Table then you can basically do any type of SQL query. The table panel will automatically show the results of whatever columns & rows your query returns.
Query editor with example query:

The query:
SELECT
  title as 'Title',
  user.login as 'Created By' ,
  dashboard.created as 'Created On'
 FROM dashboard
INNER JOIN user on user.id = dashboard.created_by
WHERE $__timeFilter(dashboard.created)
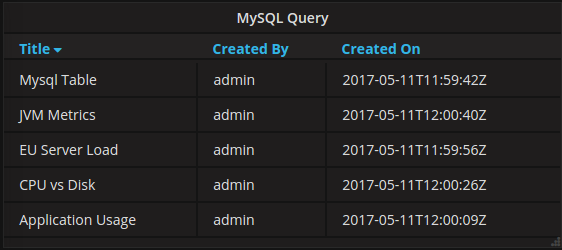
You can control the name of the Table panel columns by using regular as SQL column selection syntax.
The resulting table panel:

Time series queries
If you set Format as to Time series, for use in Graph panel for example, then there are some requirements for
what your query returns.
- Must be a column named
time_secrepresenting a unix epoch in seconds. - Must be a column named
valuerepresenting the time series value. - Must be a column named
metricrepresenting the time series name.
Example:
SELECT
  min(UNIX_TIMESTAMP(time_date_time)) as time_sec,
  max(value_double) as value,
  metric1 as metric
FROM test_data
WHERE   $__timeFilter(time_date_time)
GROUP BY metric1, UNIX_TIMESTAMP(time_date_time) DIV 300
ORDER BY time_sec asc
Currently, there is no support for a dynamic group by time based on time range & panel width. This is something we plan to add.
Templating
You can use variables in your queries but there are currently no support for defining Query variables
that target a MySQL data source.
Alerting
Time series queries should work in alerting conditions. Table formatted queries is not yet supported in alert rule conditions.


