
Important: This documentation is about an older version. It's relevant only to the release noted, many of the features and functions have been updated or replaced. Please view the current version.
Traces in Explore
You can use Explore to query and visualize traces from tracing data sources. Supported data sources include:
Here are some references to learn more about traces and how you can use them:
- Introduction to tracing
- Trace structure
- Traces and telemetry
- Using traces to find solutions to problems
- Best practices for tracing
Query editors
You can query and search tracing data using a data source’s query editor. Note that data sources in Grafana have unique query editors.
For information on how to use the query editor to create queries for tracing data sources, refer to the documentation for each individual data source.
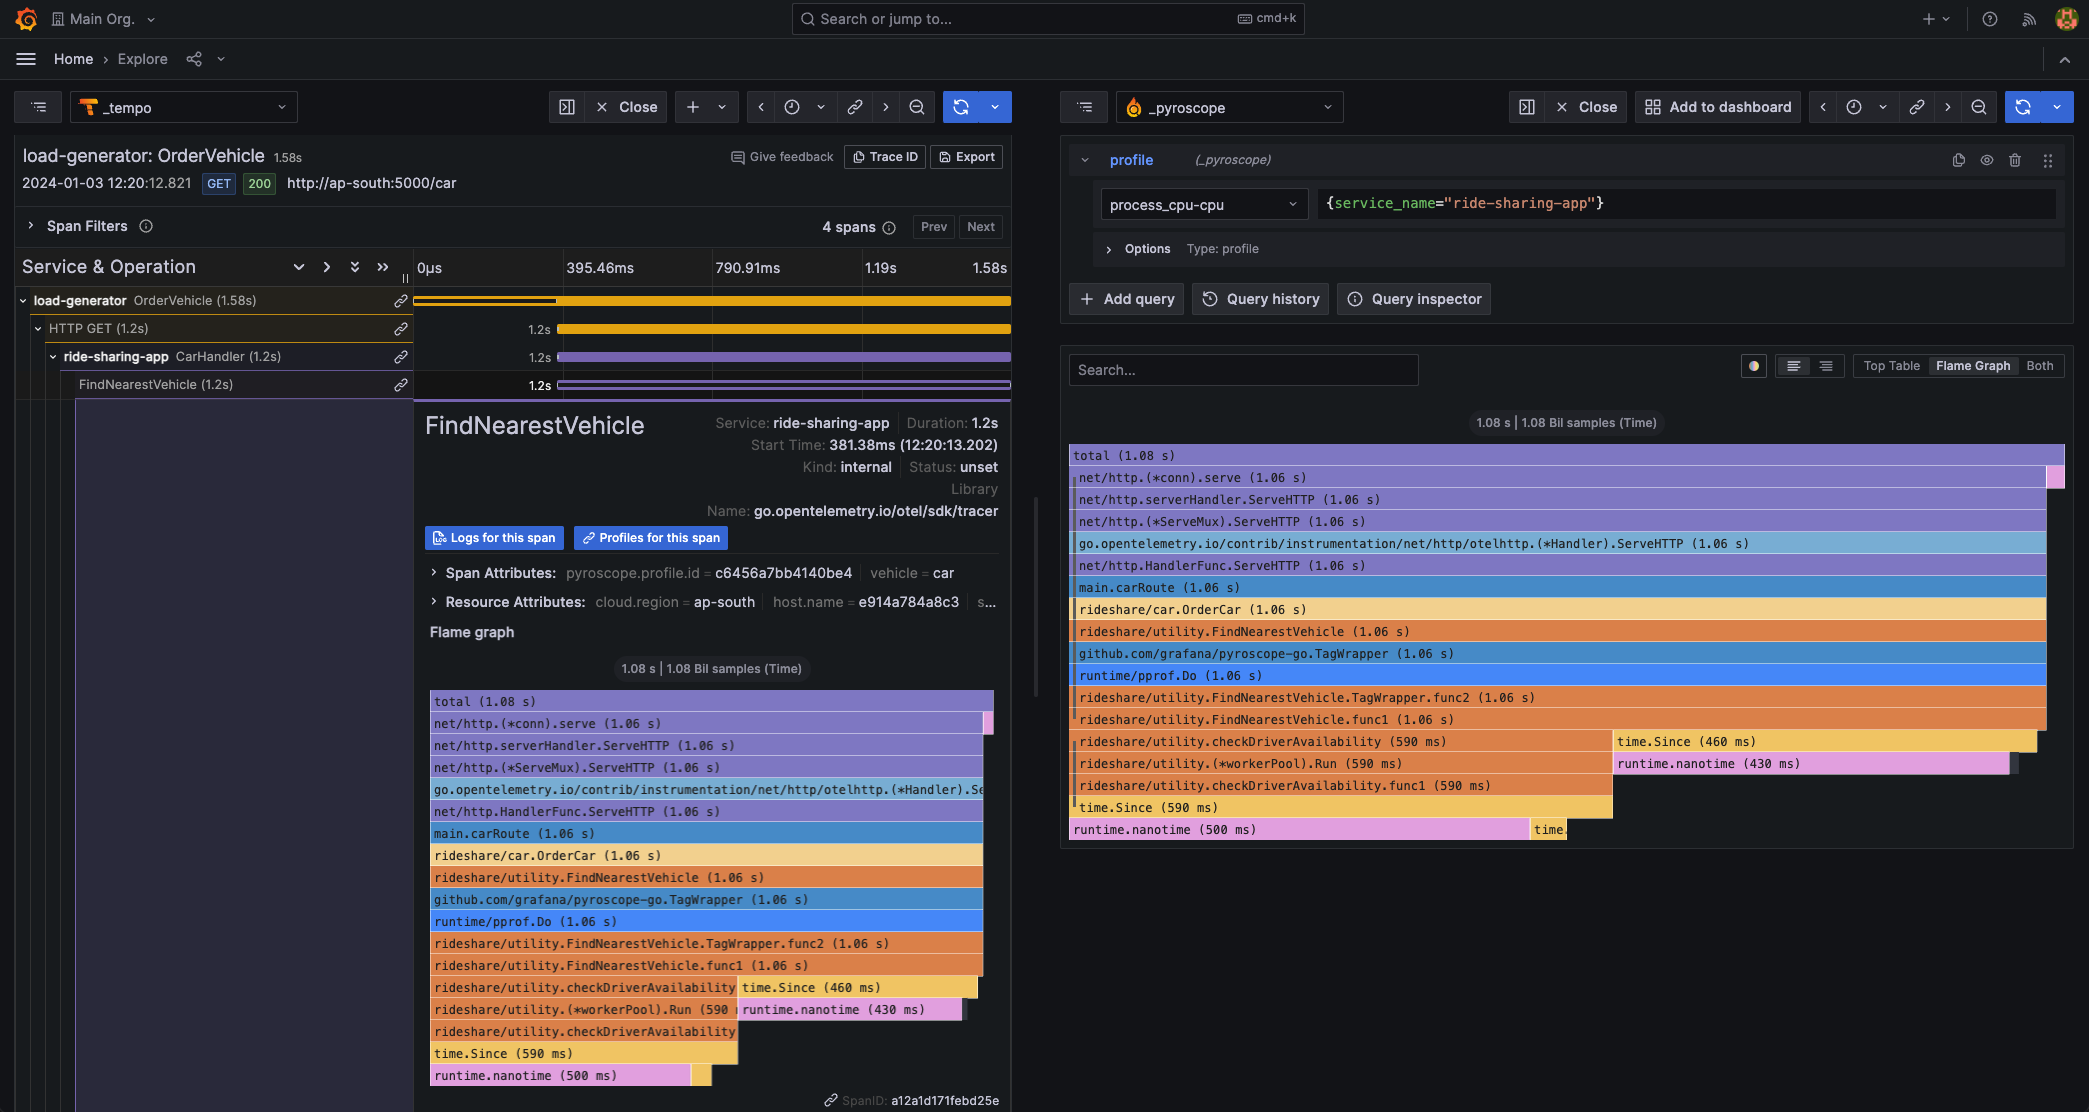
Trace view
Grafana’s trace view provides an overview of a request as it travels through your system. The following sections provide detail on various elements of the trace view.

Header
The trace view header includes the following:
- Header title - Shows the name of the root span and trace ID.
- Search - Highlights spans containing the searched text.
- Metadata - Various metadata about the trace.

Minimap
Minimap displays a condensed view of the trace timeline. Drag your mouse over the minimap to zoom into a smaller time range. This also updates the main timeline, making it easier to view shorter spans When zoomed in, hovering over the minimap displays Reset selection, which resets the zoom.

Timeline
Timeline shows list of spans within the trace. Each span row consists of the following components:
- Expand children - Expands or collapses all the children spans of the selected span.
- Service name - Name of the service logged the span.
- Operation name - Name of the operation that this span represents.
- Span duration bar - Visual representation of the operation duration within the trace.
Click anywhere on the span row to reveal span details.

Span details
Traces are composed of one or more spans. A span is a unit of work within a trace that has a start time relative to the beginning of the trace, a duration and an operation name for the unit of work. It usually has a reference to a parent span, unless it’s the first span, the root span, in a trace. It frequently includes key/value attributes that are relevant to the span itself, for example the HTTP method used in the request, as well as other metadata such as the service name, sub-span events, or links to other spans.
You can expand any span in a trace and view the details, including the span and resource attributes.
For more information about spans and traces, refer to Introduction to tracing in the Tempo documentation.
Span details include:
Span attributes - Key/value pairs that provides context for spans. For example, if the span deals with calling another service via HTTP, an attribute could include the HTTP URL (maybe as the span attribute key
http.url) and the HTTP status code returned (as the span attributehttp.status_code).Resource attributes - Key/value pairs that describe the context of how the span was collected.
Refer to Span and resource attributes for more detail.

Span filters
Span filters allow you to refine the spans displayed in the trace timeline viewer. The more filters you add, the more specific the filtered spans become. Click on a trace to access Span filters.
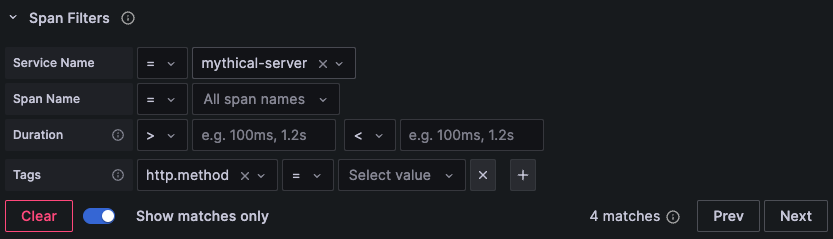
You can add one or more of the following filters:
- Service name - Filter by selecting a service name from the dropdown.
- Span name - Filter by selecting a span name from the dropdown.
- Duration - Filter by duration. Accepted units include ns, us, ms, s, m, h.
- Tags - Filter by tags, process tags, or log fields in your span.
To only show the spans you have matched, toggle Show matches only.
Refer to Span filters for more in depth information.
Watch the following video to learn more about filtering trace spans in Grafana:
Trace to logs
You can navigate from a span in a trace view directly to logs relevant for that span. This feature is available for the Tempo, Jaeger, and Zipkin data sources. Refer to each individual data source’s documentation for configuration instructions.
Click the document icon to open a split view in Explore with the configured data source and query relevant logs for the span.

Trace to metrics
You can navigate from a span in a trace view directly to metrics relevant for that span. This feature is available for the Tempo, Jaeger, and Zipkin data sources.
Refer to each individual data source’s documentation for configuration instructions. For Tempo, refer to Trace to metrics configuration.
Trace to profiles
Using Trace to profiles, you can use Grafana’s ability to correlate different signals by adding the functionality to link between traces and profiles.
For Tempo refer to Trace to profiles for configuration instructions.
Node graph
You can also expand the node graph for a displayed trace. If the data source supports it, this displays spans of the trace as nodes in the graph, or provides additional context, such as a service graph based on the current trace.
Refer to Node graph for additional information.
Note
The node graph requires data to be returned from the data source in a specific format to display correctly. Refer to Data API, Nodes data frame structure and Node graph data requirements for additional information and configuration instructions.

Service graph
A service graph visualizes span metrics, including rates, error rates, and durations (RED), along with service relationships. Once the requirements are configured, this pre-configured view is immediately available.
For additional information refer to the following documentation:
- Service Graph and Service Graph view
- Service graph view in Tempo documentation


