Prometheus2.0 (by FUSAKLA)
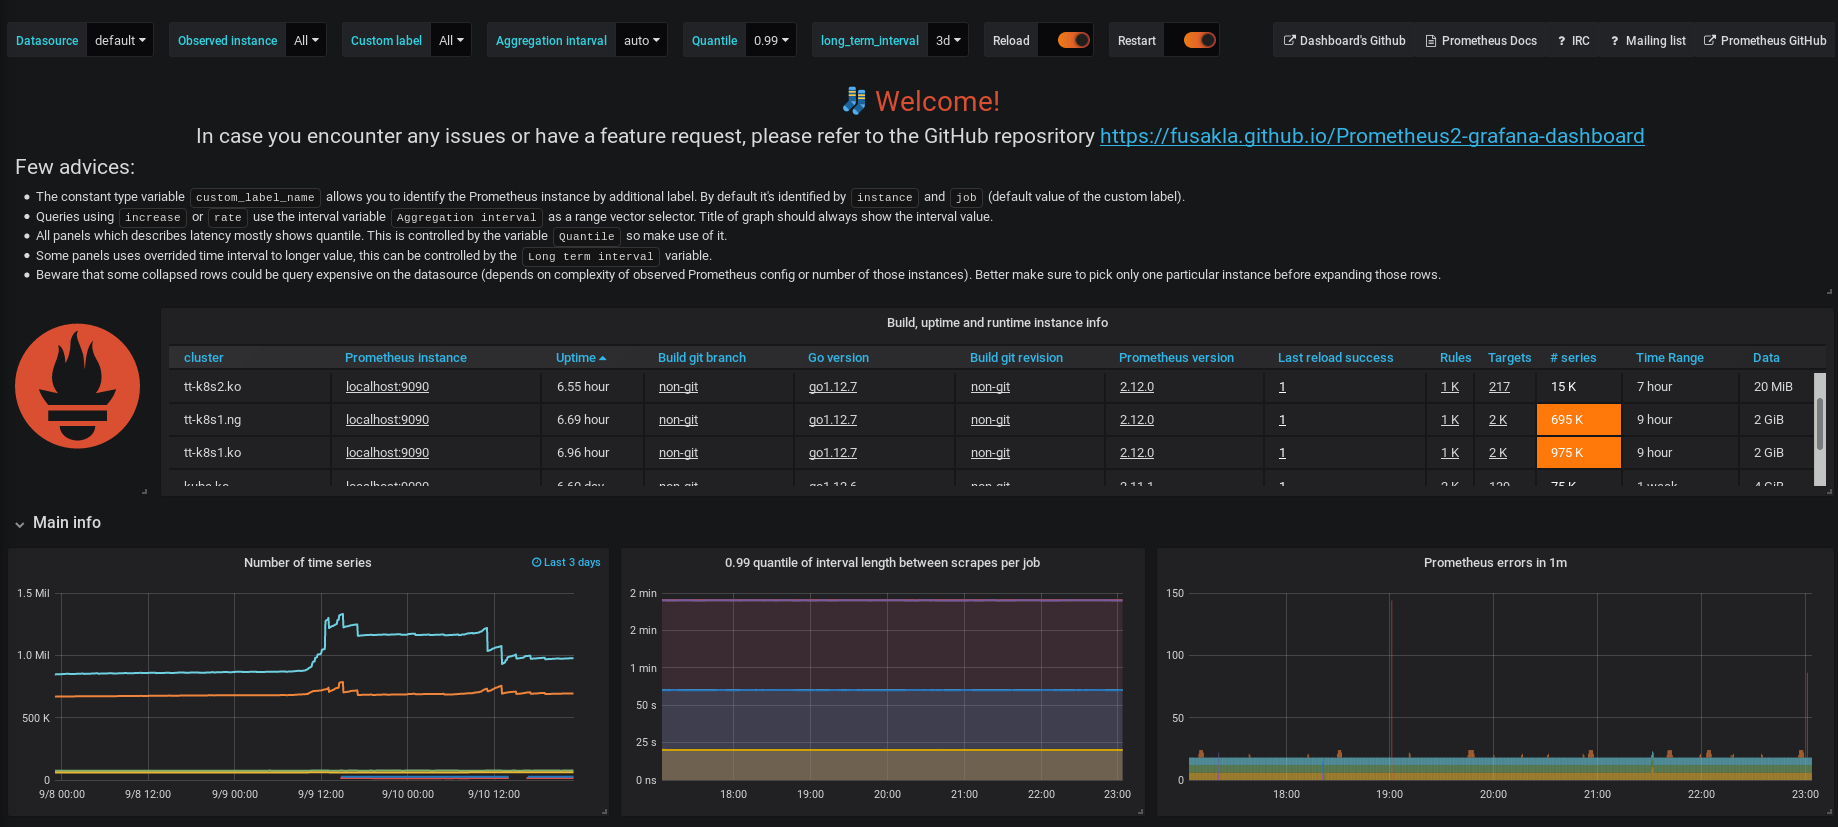
Dashboard providing insight to Prometheus monitoring system status and it's runtime info.
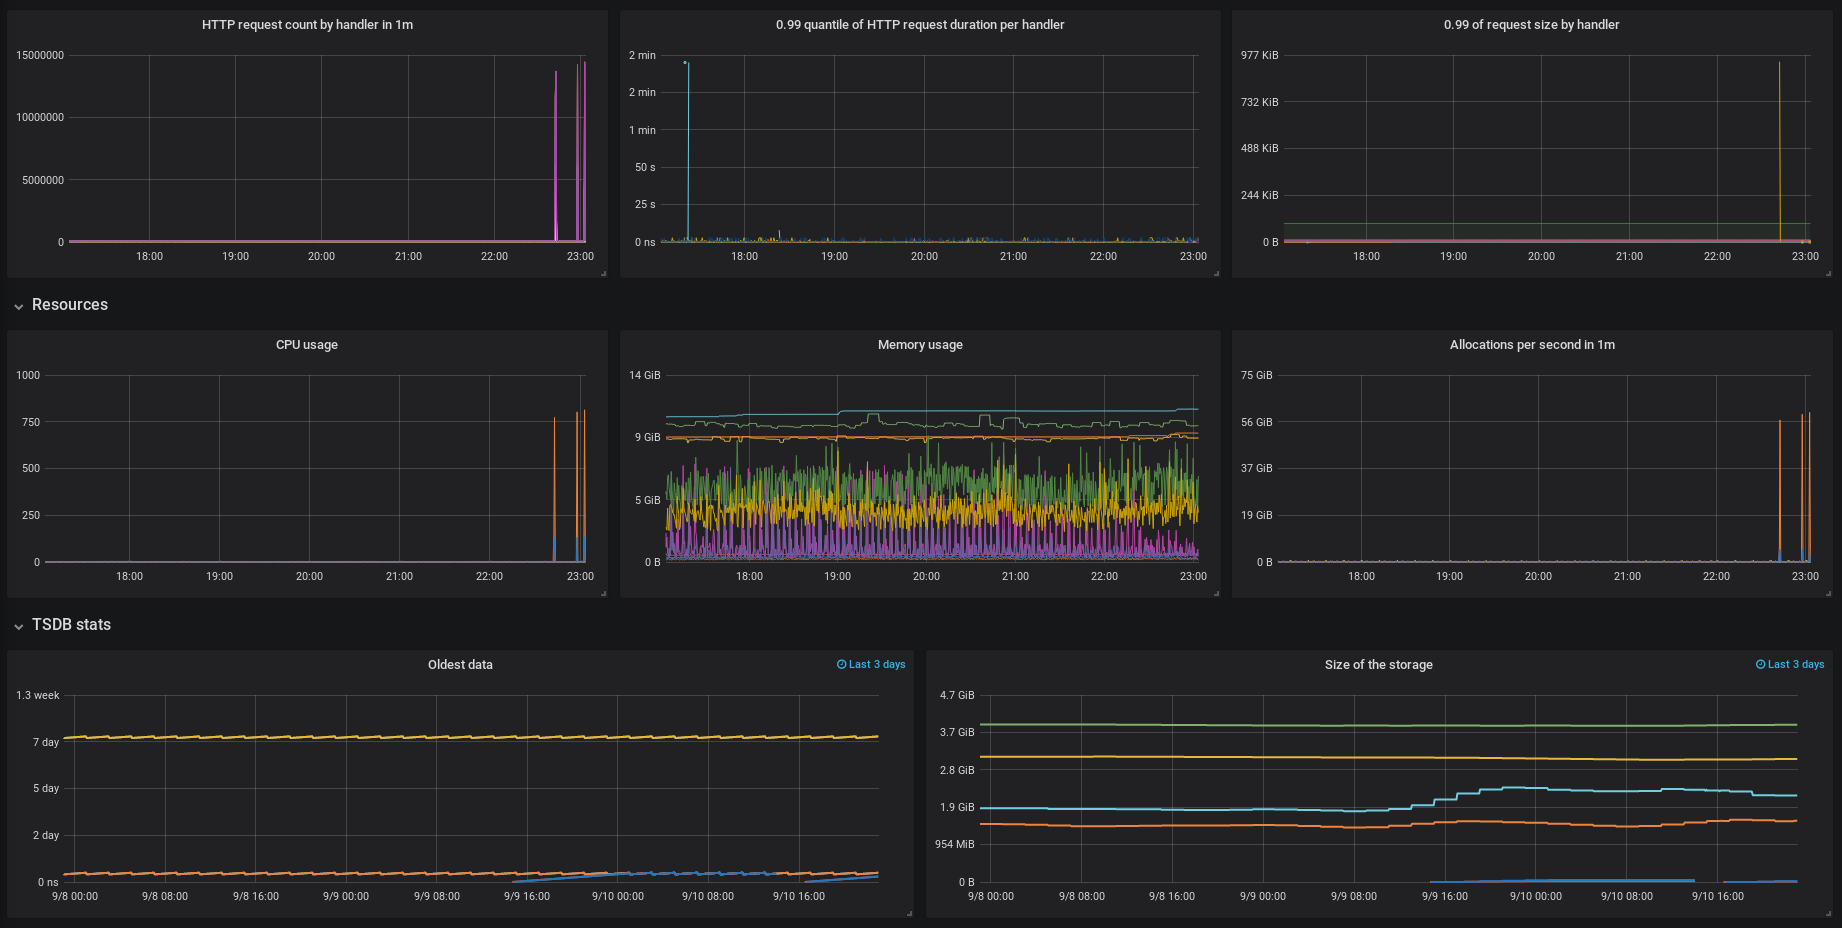
Prometheus 2.0 Grafana dashboard
Dashboard aiming on operating multiple Prometheus instances. It should give you generic view of your monitoring cluster status but also in case of any issues provide deep insight into Prometheus internal metrics.
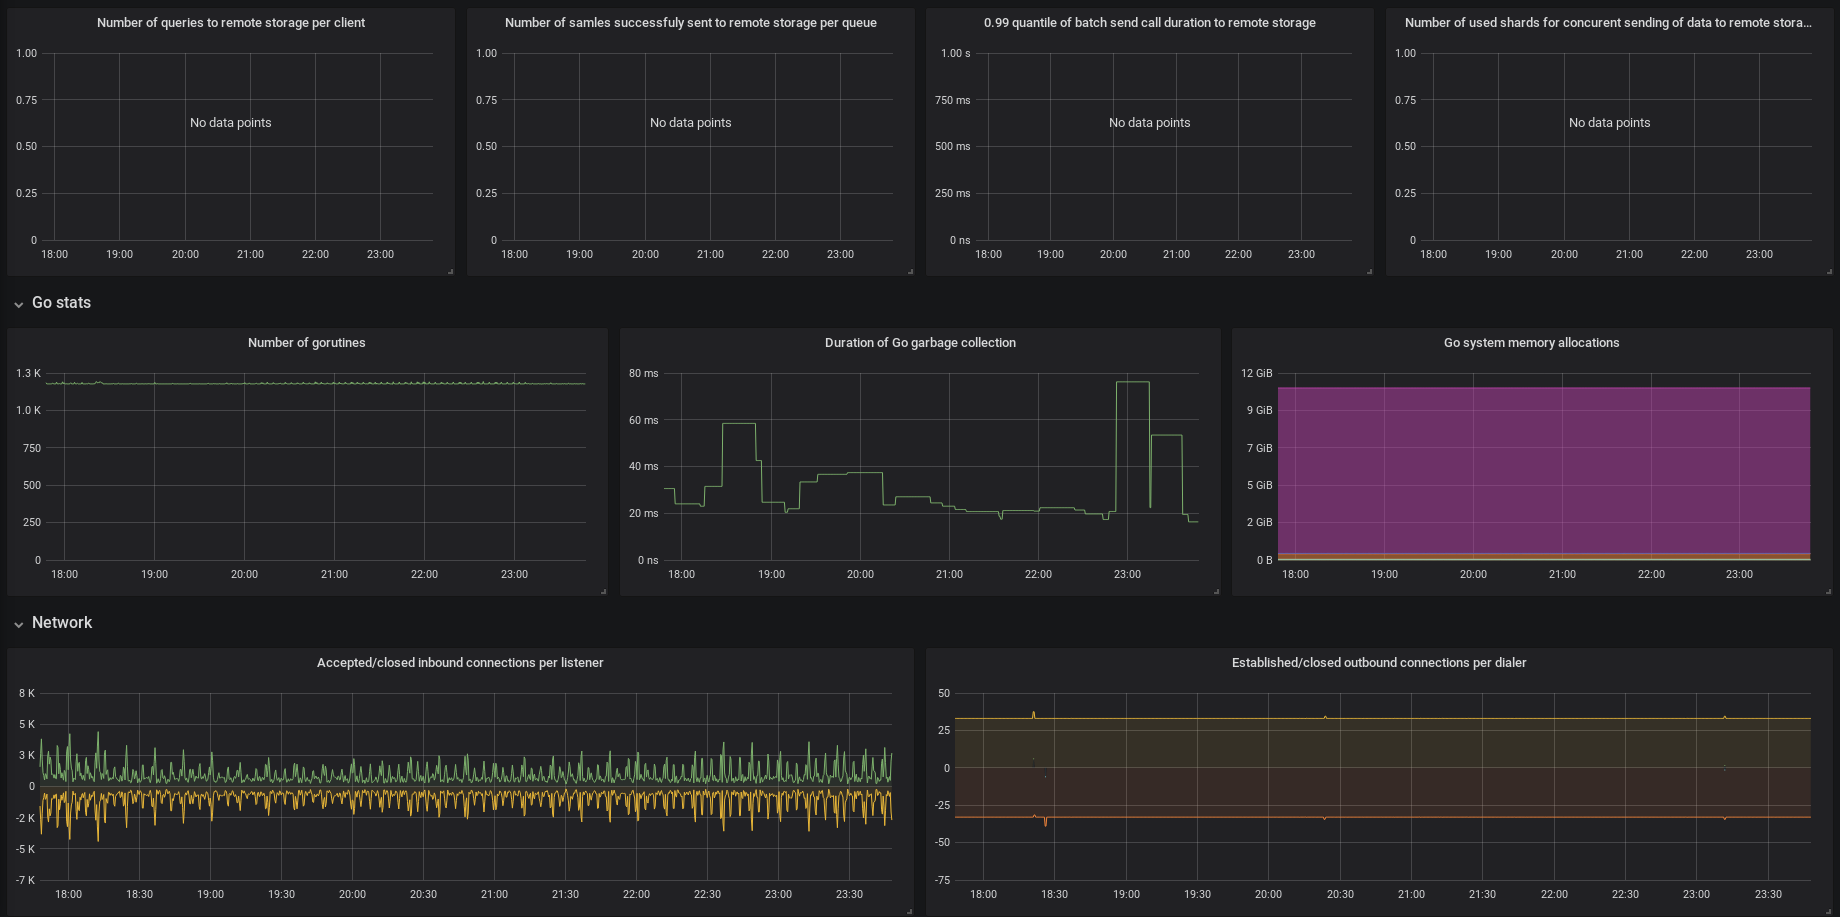
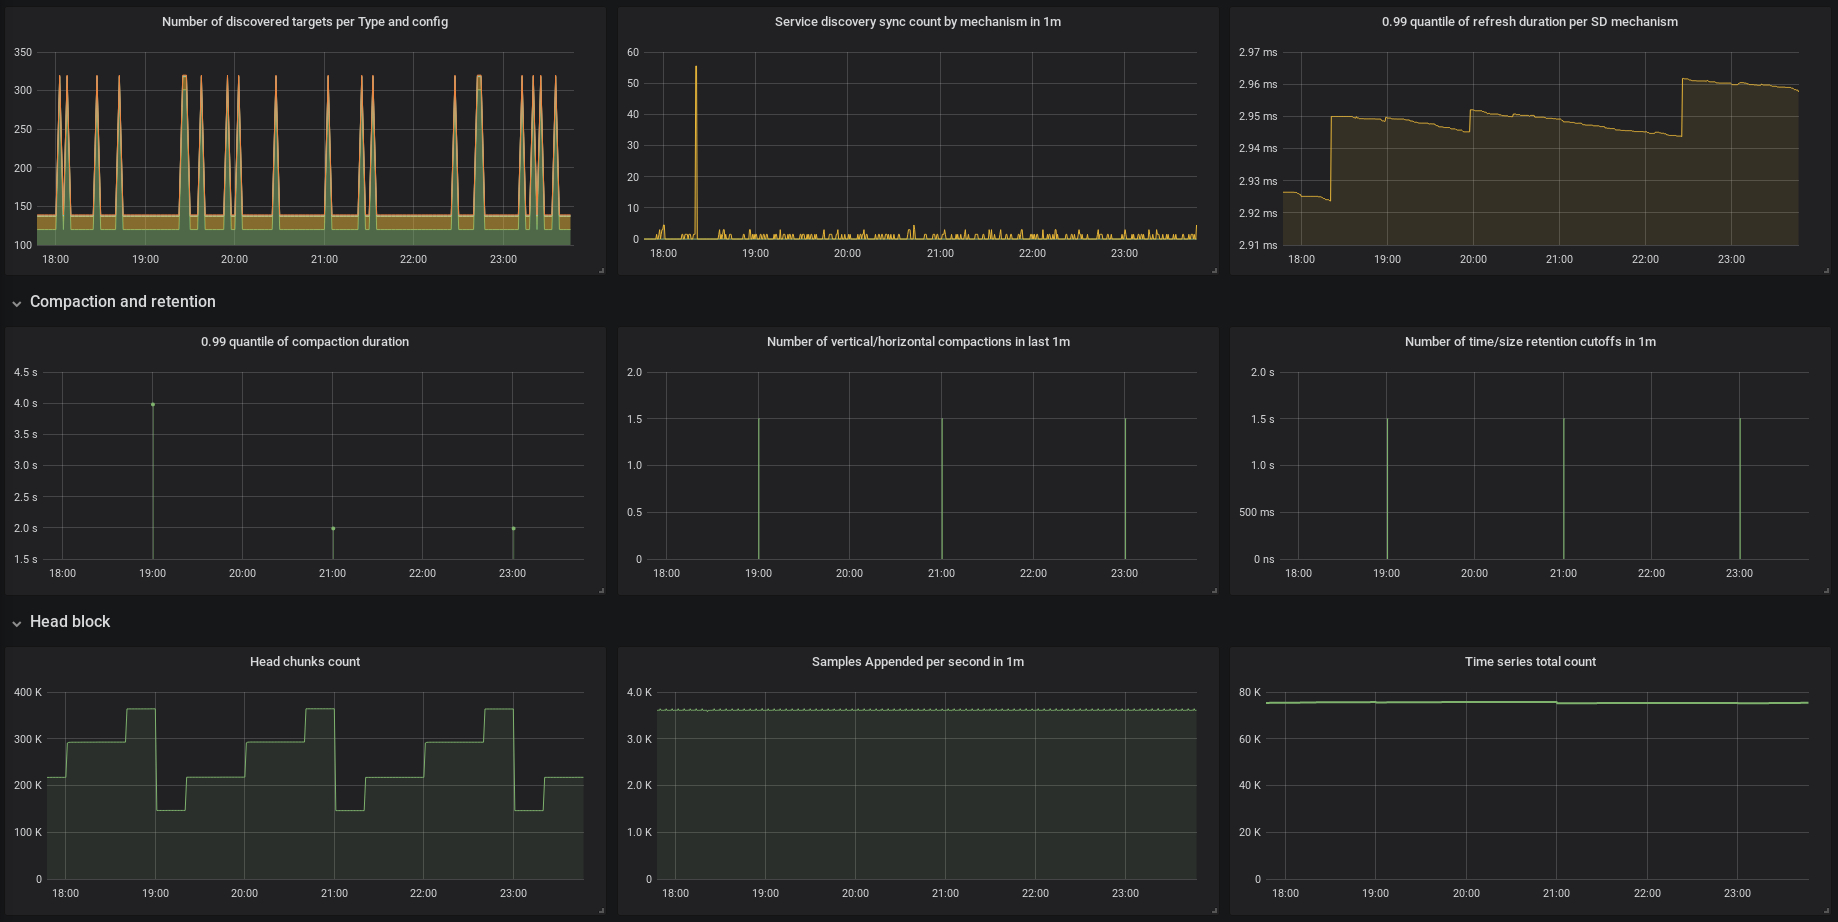
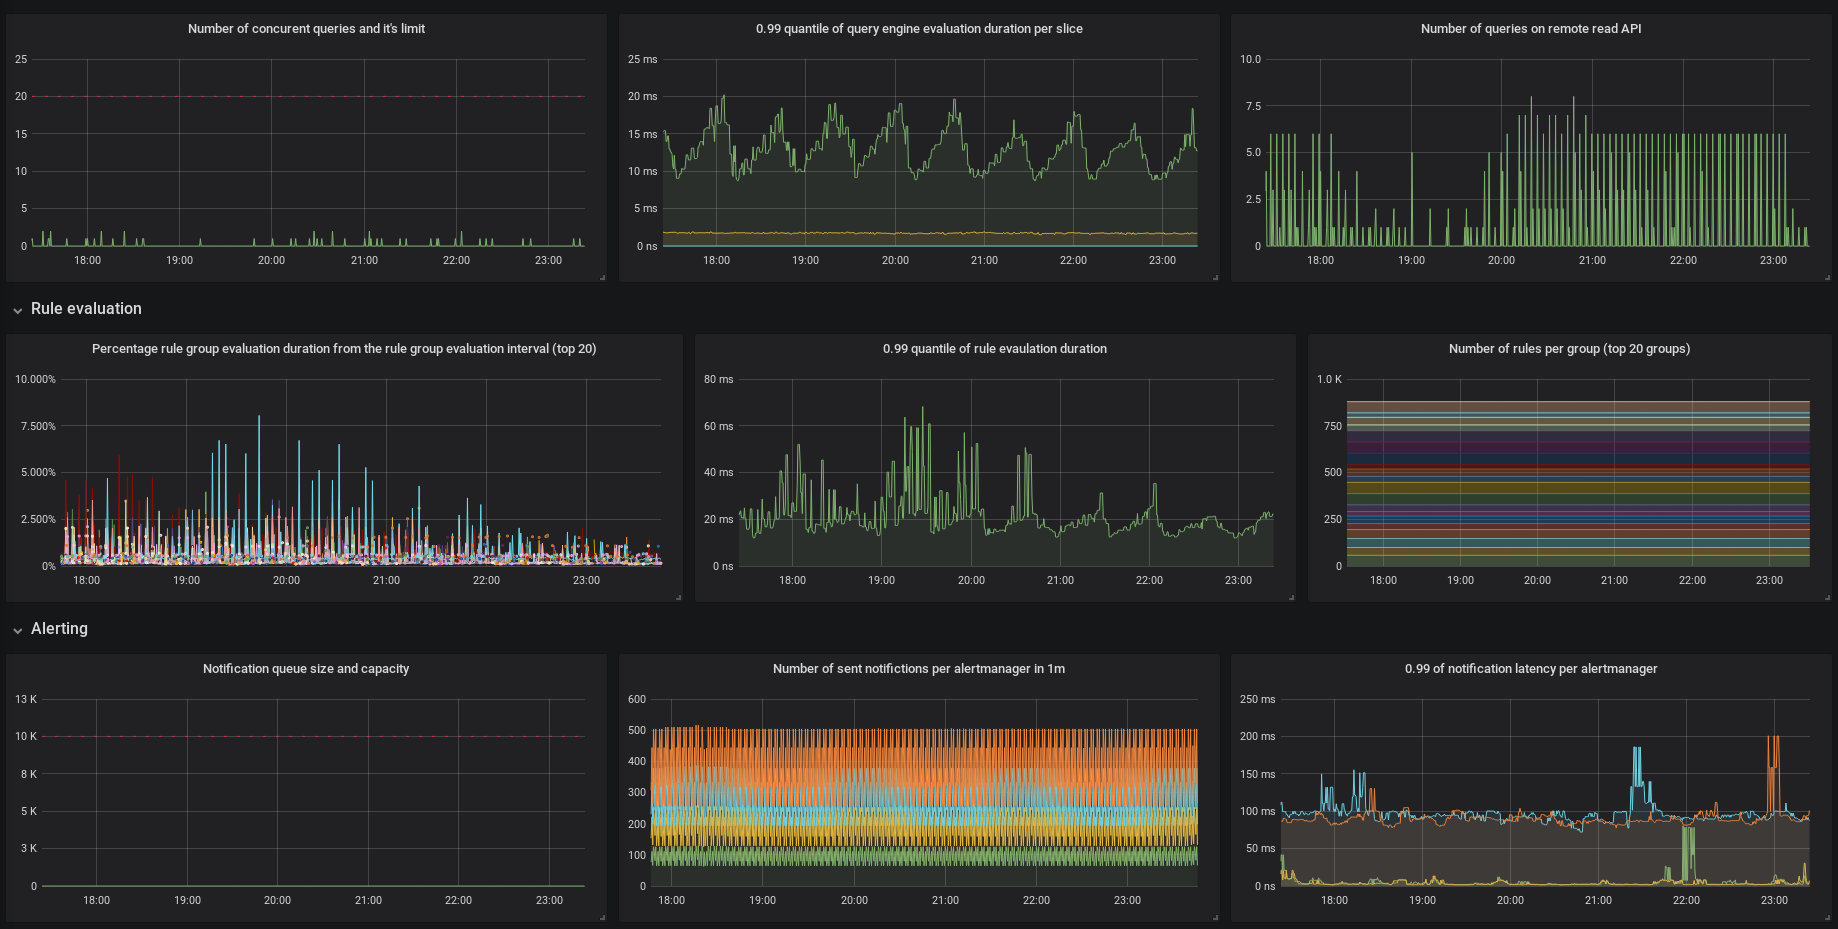
Most of the graphs are grouped into rows thematically, which are collapsed so they won't be loaded until you expand them. Bear in mind that some of those could be more query intensive so better try them out on smaller time range first.
Github repository https://github.com/FUSAKLA/Prometheus2-grafana-dashboard
Installation
There are two ways to install this dashboard
- Copy the
JSONdefinition of dashboard and paste it in the Import dialog in Grafana - Load the dashboard directly form Grafana.com website using dashboard ID
3681or on link https://grafana.com/dashboards/3681
Provisioning
If you use dashboard provisioning,
there is unfortunately an issue with loading the dashboard which uses variables.
This could cause issues such as unexpected character inside braces: '$'. Hopefully this will get fixed in Grafana soon.
Until then you need to modify the manifest and replace the VAR_DATASOURCE and VAR_CUSTOM_LABEL_NAME on your own.
Sorry for the inconvenience :/
Usage
- The constant type variable
custom_label_nameallows you to identify the Prometheus instance by additional label. By default it's identified byinstanceandjob(default value of the custom label). - Queries using
increaseorrateuse the interval variableAggregation intervalas a range vector selector. Title of graph should always show the interval value. - All panels which describes latency mostly shows quantile. This is controlled by the variable
Quantileso make use of it. - Some panels uses time interval override to longer value, this can be controlled by the
Long term intervalvariable. - Beware that some collapsed rows could be query expensive on the datasource (depends on complexity of observed Prometheus config or number of those instances). Better make sure to pick only one particular instance before expanding those rows.
Screenshots


Updating the dashboard
There is a script to show difference between metrics of running Prometheus instance and those used by the dashboard.
- Run the Prometheus instance for example
docker run -d -p 9090:9090 prom/prometheus:master. - You need
curlandjq, so please make sure you have those installed. - Run the script
./inspect_metrics.sh. - You should get an output with listing of differences.
Issues and contributing
If you encounter any issues with the dashboard or would like to enhance it anyhow, please raise an issue on the github repo and I'd be happy to discuss it!
Data source config
Collector config:
Upload an updated version of an exported dashboard.json file from Grafana
| Revision | Description | Created | |
|---|---|---|---|
| Download |