Uyuni / SUSE Manager Server
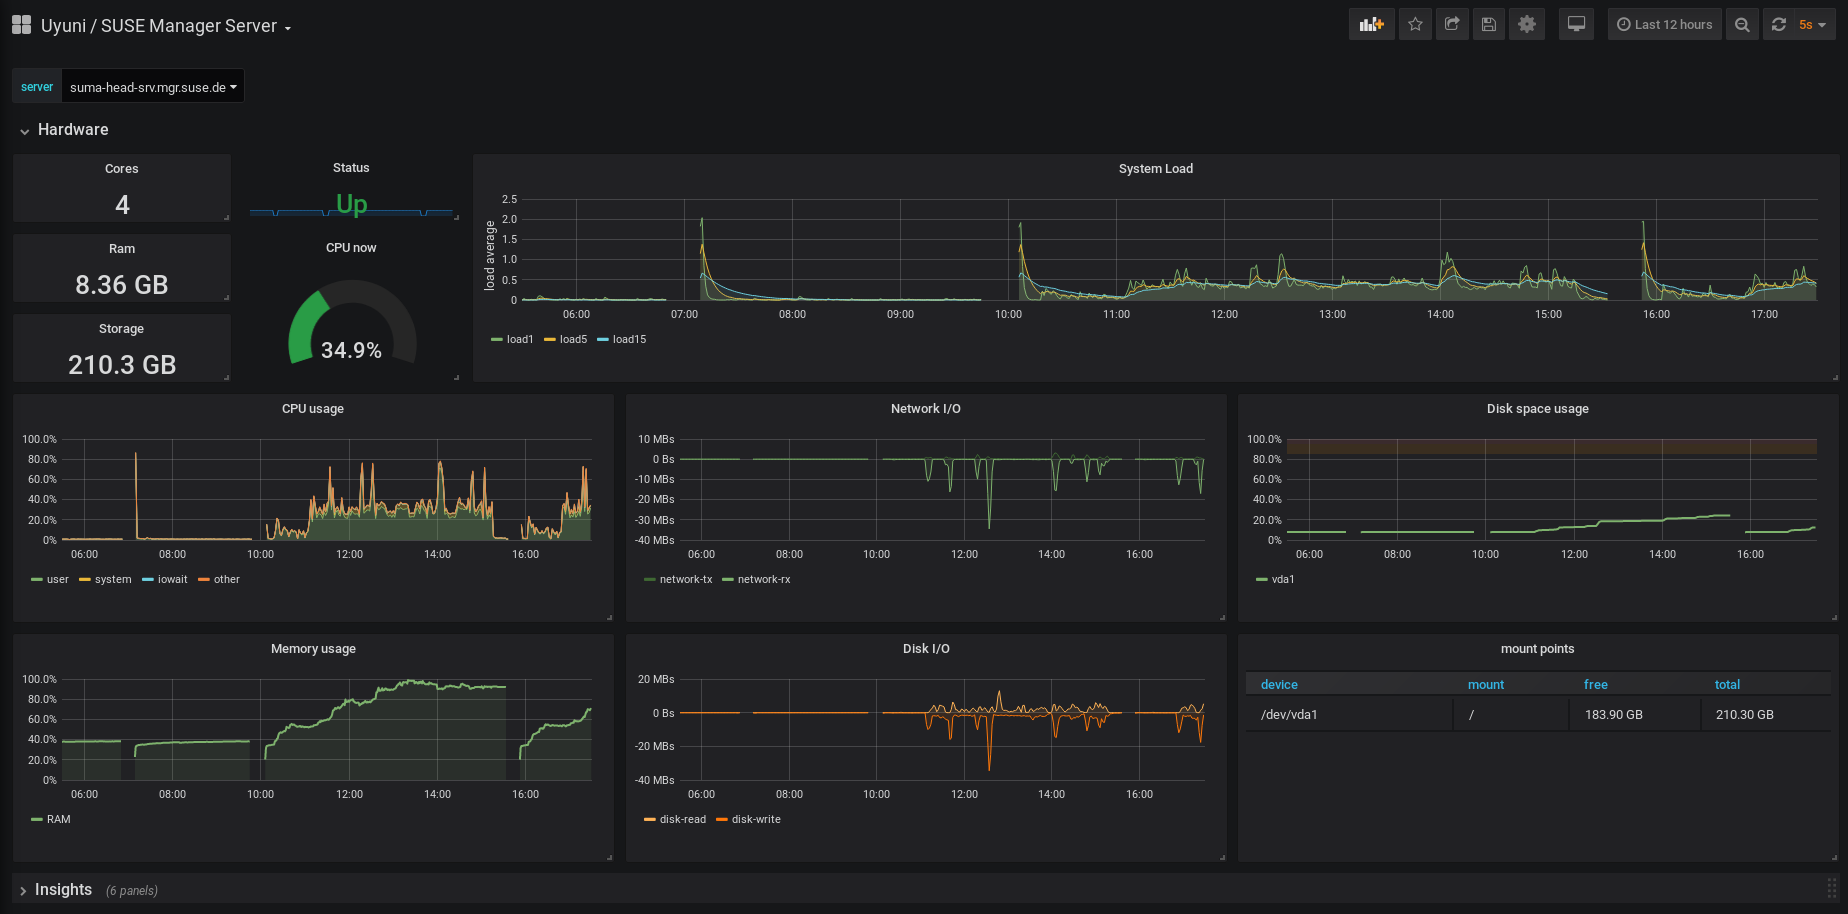
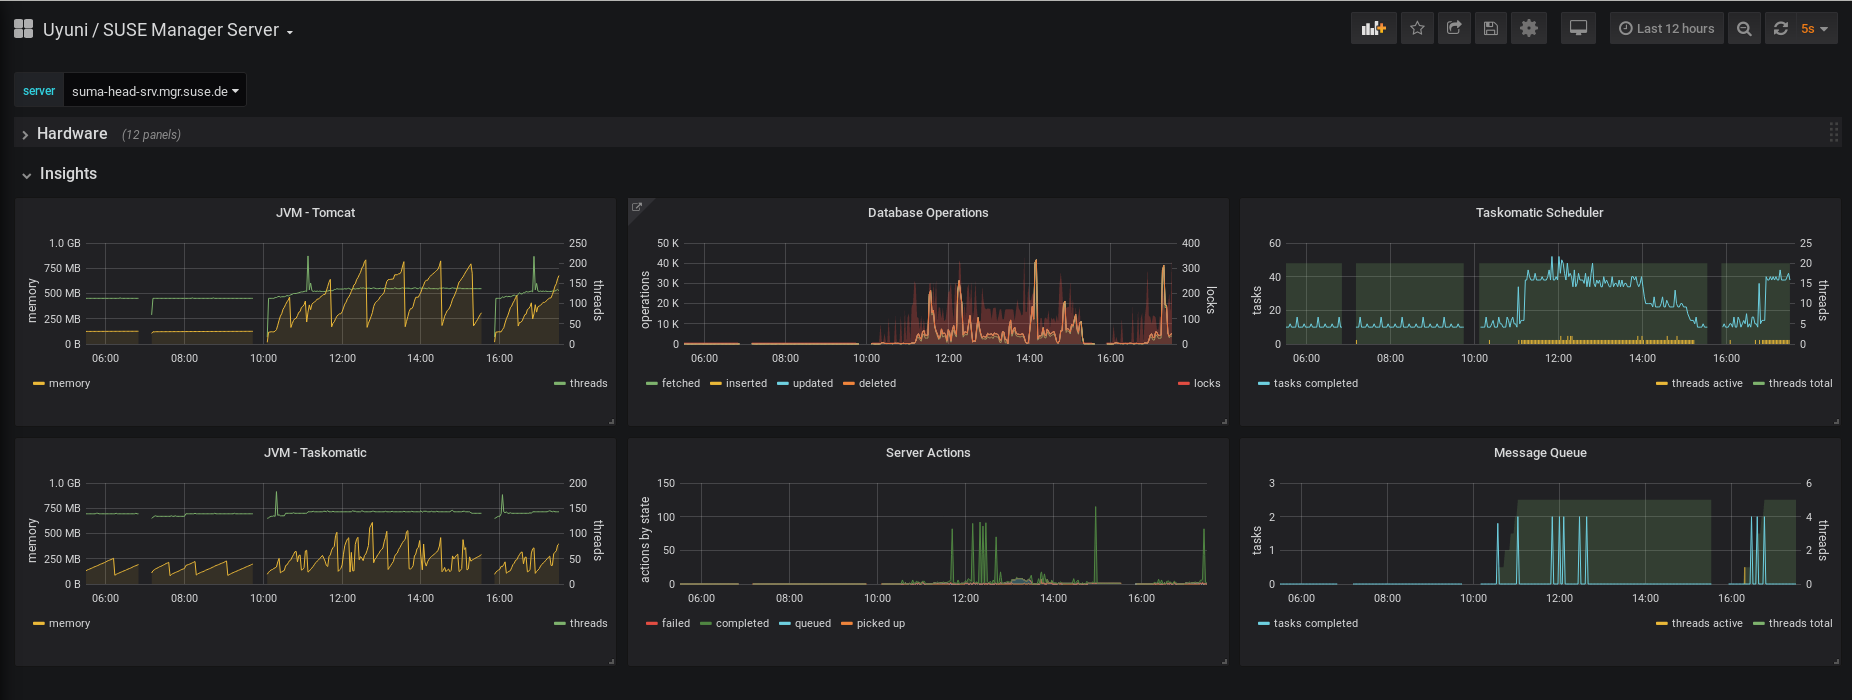
This dashboard shows insights about Uyuni / SUSE Manager servers and includes metrics from:
- Node exporter
- PostgreSQL exporter
- JMX exporter
- Internal metrics
The dashboard requires that an existing Prometheus is configured to collect Uyuni / SUSE Manager metrics. The 'job' constant should be set according to the settings you have on your Prometheus scrape targets. It assumes exporters are running on their default ports.
Example Prometheus scrape target config:
- job_name: 'uyuni-server'
  static_configs:
    - targets:
      - 'uyuni-server.local:9100'  # Node exporter
      - 'uyuni-server.local:9187'  # PostgreSQL exporter
      - 'uyuni-server.local:5556'  # JMX exporter (Tomcat)
      - 'uyuni-server.local:5557'  # JMX exporter (Taskomatic)
      - 'uyuni-server.local:9800'  # Taskomatic
    - targets:
      - 'uyuni-server.local:80'    # Message queue
      labels:
        __metrics_path__: /rhn/metrics
Data source config
Collector type:
Collector plugins:
Collector config:
Revisions
Upload an updated version of an exported dashboard.json file from Grafana
| Revision | Description | Created | |
|---|---|---|---|
| Download |
cert-manager
Easily monitor cert-manager, the certificate controller for Kubernetes and OpenShift, with Grafana Cloud's out-of-the-box monitoring solution.
Learn more