
Telemetry pipeline management at any scale: Fleet Management in Grafana Cloud is generally available
We announced Fleet Management in Grafana Cloud last year to solve the pain points that come with managing dozens, hundreds, or even thousands of telemetry collectors across departments and environments. And today we’re excited to announce that Fleet Management is generally available for all Grafana Cloud users who need help managing telemetry collector deployments at scale.
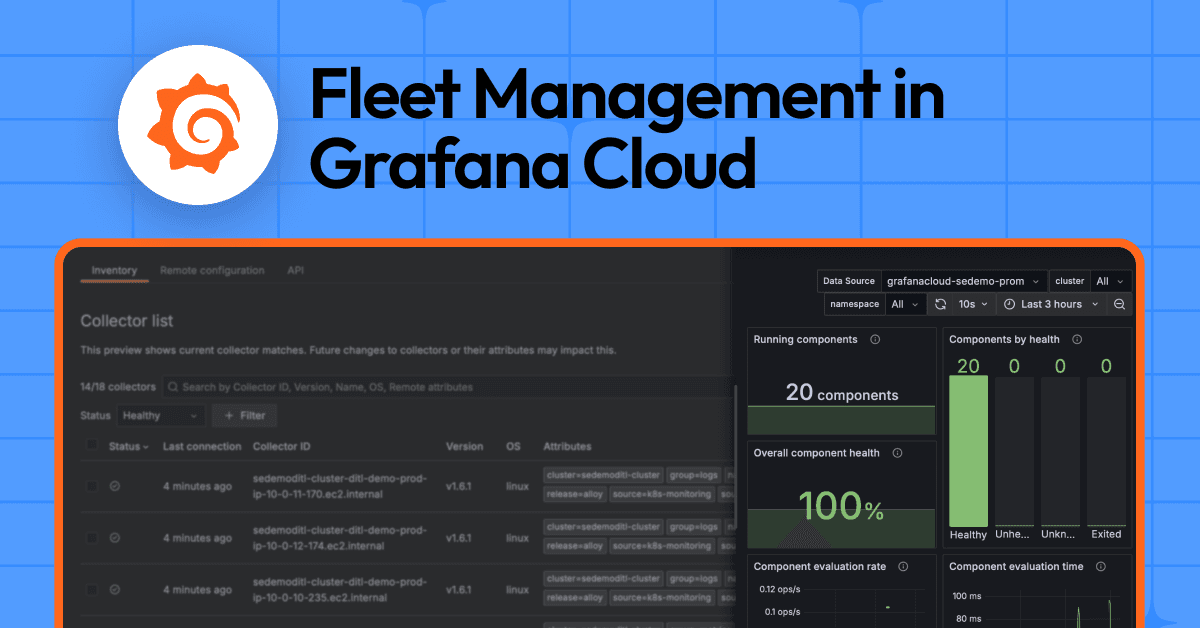
In one centralized interface, you can monitor the health of all your collectors, assign configuration pipelines based on attributes (like environment or role), and remotely update configurations across your entire fleet. In practice, this means no more logging into individual machines or maintaining giant config files for each environment—Fleet Management brings everything into one place.
Centralizing collector management has huge benefits. You get a single control hub to roll out changes safely and consistently, and gain complete visibility into each collector’s status, metrics, and logs, making it much easier to identify and resolve issues fast. Equally important, Fleet Management lets you optimize data collection and costs by toggling telemetry pipelines on or off as needed. For example, you might disable a high-volume debug logging pipeline until it’s required for troubleshooting, then re-enable it on-demand—all through Fleet Management.
And after a successful public preview where more than 4,000 Grafana Cloud stacks gave it a try across 23,000+ collectors, organizations such as Tarbell Management Group are already seeing the benefits.
“Managing everything within Fleet Management makes configuring collectors effortless,” says Brian Gates, IT Systems Engineer at Tarbell Management Group. “The correct configuration is applied automatically across our infrastructure, whether it’s a point-of-sale system, a user PC, or a Kubernetes service”
Fleet Management’s full release comes with several key enhancements to further streamline observability at scale. Let’s explore how these updates make Fleet Management an even better solution for observability pipelines, as well as some of the creative ways organizations are putting it to use today.
Key enhancements in general availability
Fleet Management tackles the complexity of large-scale observability and gives you the tools to keep monitoring effective and efficient, even as you deploy more services and collectors. Its GA release includes improvements and new features that build on the preview we launched late last year. Based on your feedback and a lot of real-world testing, we’ve added capabilities to automate deployments with Terraform, speed up setup with 100 pre-made observability pipelines, and better support Kubernetes environments. Here are the highlights of what’s new.
Terraform provider for Fleet Management resources
You can now manage Fleet Management resources as code. Grafana’s Terraform provider (version 3.19.0+) supports Fleet Management, allowing you to streamline collector setup and ensure configuration consistency across environments.
With these Terraform resources, you can:
- Define and version-control collector and pipeline configurations as code, ensuring repeatability and reducing drift.
- Keep collector inventory in sync by pre-registering collectors and updating attributes programmatically.
- Eliminate manual, error-prone configuration management by automating the provisioning of pipelines and remote configuration.
Note: While the Terraform provider manages collector configurations and inventory, deploying Grafana Alloy instances themselves is handled separately. For Kubernetes environments, teams can use the generic Helm Provider to deploy the Grafana Kubernetes Monitoring Helm chart as detailed here to efficiently deploy and manage Alloy collectors.
100 pre-built observability pipeline templates
You can now incorporate more than 100 curated monitoring templates directly into your fleet configuration workflow. Optimized to collect only essential telemetry, these customizable pipelines cover popular technologies like Redis, Kafka PostgreSQL, Node.js, Jenkins, MongoDB, Docker, and many more.
With a single click you can choose a technology and Fleet Management will automatically populate a pipeline with target discovery, filtered metrics, and even export configuration for your telemetry backend including credentials. This should drastically reduce setup time, as there’s no need to learn and reinvent custom configs for common data sources—the heavy lifting is done for you.
This means you can enable end-to-end monitoring for a new service in minutes, confident that you’re using Grafana’s recommended best practice for that use case. This catalog of observability pipelines combined with Fleet Management’s remote configuration gives you the best of both worlds: preconfigured monitoring content and the flexibility to tweak or scale it as needed, all from the central UI.
Enhanced Kubernetes support
Setting up and running collectors with Fleet Management on Kubernetes is now simpler and more robust. With out-of-the-box monitoring on Kubernetes, you can immediately observe and troubleshoot the health and state of collectors without additional setup.
By deploying collectors using the Kubernetes Monitoring Helm chart, the collector.id gets set automatically, based on the environment. Inactive collectors should no longer accumulate in the UI after pod restarts for common use cases.
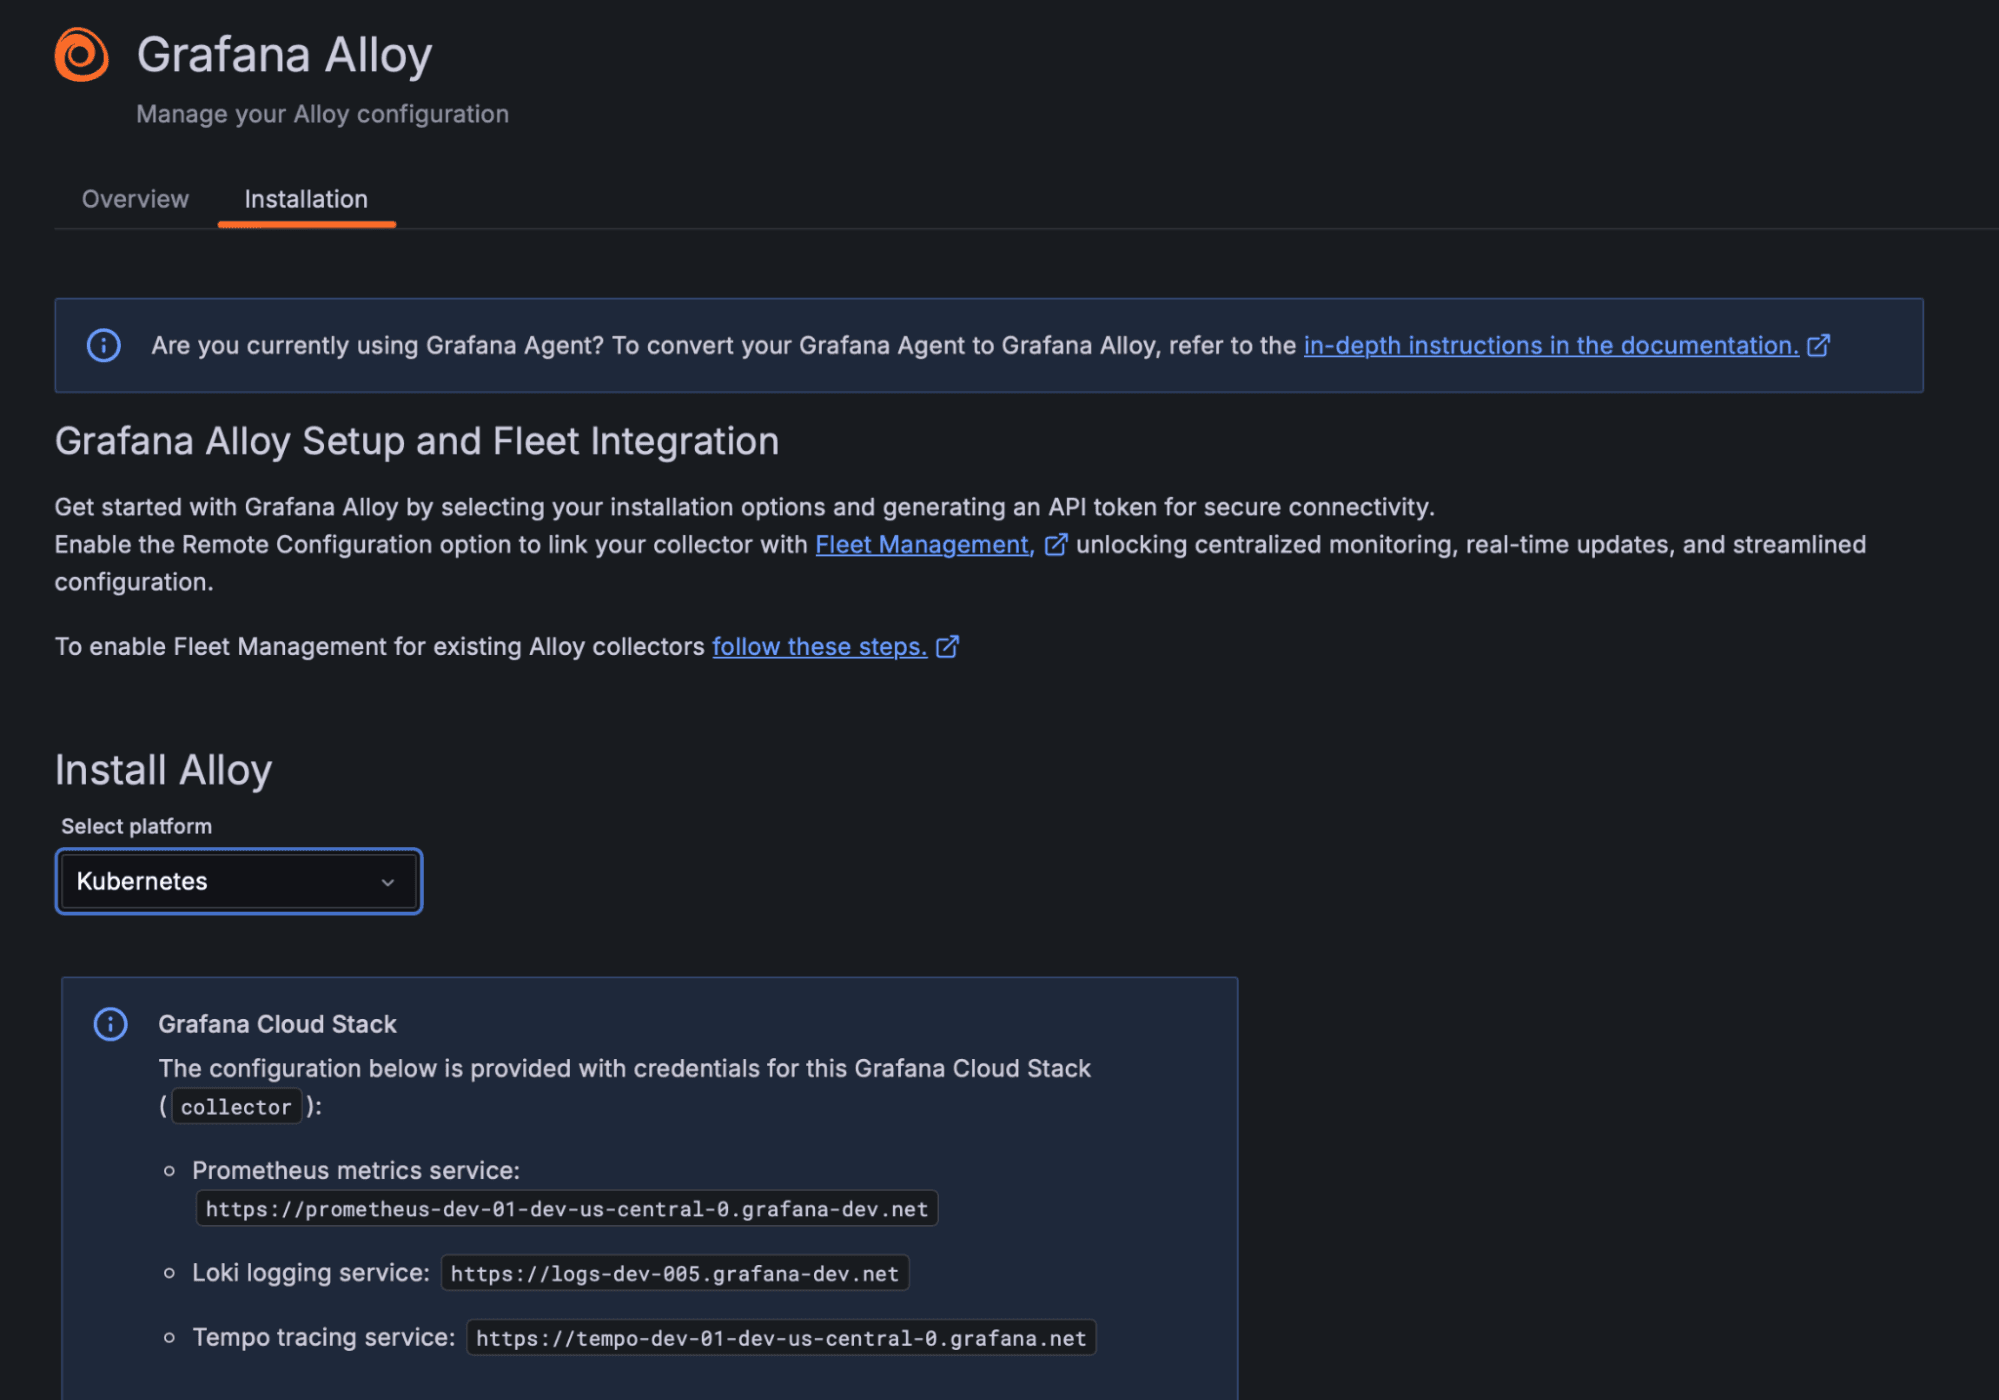
This keeps your fleet inventory tidy by preventing defunct or offline collectors from lingering in the UI. Together, these enhancements ensure that Kubernetes-based deployments are easier to manage: you have instant visibility into collector health and no longer need to manually prune ephemeral instances.
Note: The
collector.idfor singleton deployments includes a unique pod name that changes with each restart, resulting in a new collector instance in Fleet Management. The old collectors become inactive and remain in your inventory until you delete them. Additional settings to clean up inactive collectors will be rolled out soon after GA.
How teams are working smarter with Fleet Management
Organizations are already using Fleet Management in innovative ways to optimize observability, reduce operational overhead, and improve data collection strategies. Next, let’s look at some of the most impactful and creative ways we’re seen teams leverage Fleet Management.
Optimizing costs with on-demand data collection
High-verbosity telemetry like debug logs, traces, and continuous profiling can drive up costs if collected continuously. Instead, teams are creating on-demand configuration pipelines that remain disabled by default and only activate when needed.
A team running high-scale services wanted to capture profiling data only when diagnosing excessive resource consumption. They implemented a disabled profiling pipeline:
- A continuous profiling pipeline is created but disabled (
enabled=false). - When an issue arises, the profiling pipeline is enabled via API, dynamically applying it to affected services.
- Once the investigation is complete, the profiling pipeline is deactivated, reducing unnecessary data collection costs.
Similarly, teams handling high-cardinality logs and traces are using Fleet Management to dynamically enable detailed telemetry pipelines only during incidents, ensuring rich forensic data is collected when required, while still keeping costs under control.
Automating incident response with API-triggered data collection
Some teams are fully automating observability responses to incidents using Fleet Management’s API:
- Predefined “incident response” pipelines are stored in Fleet Management but kept deactivated.
- When an incident occurs, an API call activates the necessary telemetry pipelines, enabling high-resolution logs, traces, or profiles on impacted services.
- Once the incident is resolved, a final API call disables the pipelines, restoring normal data collection settings.
This event-driven approach ensures that teams capture critical telemetry only when needed, reducing noise, lowering costs, and improving the efficiency of incident response workflows.
Multi-environment, multi-team consistency
A large organization with many teams and environments uses Fleet Management to maintain consistency in observability while still catering to each team’s needs. They define global pipeline templates (using the pre-built pipelines and custom configs) for various use cases—infrastructure metrics, application logs, security auditing, etc.—and then use attribute-based assignments to apply those pipelines selectively.
For example, any collector with env: dev might get a lightweight metrics pipeline and no tracing (to conserve resources), whereas collectors with env: prod receive the full monitoring suite including metrics, logs, traces, and profile collection. Similarly, different teams have collectors tagged by team or service, and Fleet Management auto-applies the relevant pipelines (database teams get the MySQL integration pipelines, ops team gets node exporter metrics, and so on).
This creative setup means every new collector that joins Fleet Management with the proper tags will immediately configure itself with the correct pipelines for its role. The platform team can update a pipeline template once (say, tune a metric threshold or add a new log filter) and that change propagates to all matching collectors instantly.
By leveraging Fleet Management in this way, the organization achieves enterprise-wide observability standards without forcing each team to manually maintain their configs. It’s a huge time saver and greatly improves reliability, since all collectors stay in sync with best practices defined centrally.
Observability as code for fleet-wide consistency
Many teams have fully integrated Fleet Management into their CI/CD pipeline using Terraform. Each time a new service or environment is deployed, their Terraform scripts automatically preregister a new collector, apply standard attributes, and assign the correct configuration pipeline. If a developer spins up a new microservice, it automatically inherits the necessary monitoring pipelines based on its role, environment, and team ownership.
- Version-controlled configuration pipelines ensure every collector gets the right telemetry setup from day one.
- Updates to pipelines are reviewed and deployed via Git, reducing risk and ensuring consistency across all environments.
- Fleet-wide bulk configuration updates can be applied instantly, ensuring observability best practices remain intact across services.
This infrastructure-as-code approach eliminates manual configuration drift and makes observability provisioning fully automated, auditable, and repeatable.
Streamlining workflows with reusable configuration pipelines
Manually creating different versions of the same pipeline for different environments or teams can be inefficient. Instead, teams are reusing standard pipelines while dynamically adjusting their configuration using environment variables and collector attributes.
For example, rather than creating multiple Prometheus scrape pipelines for different targets, you can use a single pipeline with dynamically assigned scrape endpoints:
prometheus.scrape "example" {
  targets = [
    {"__address__" = sys.env("<TARGET_LOCATION>")}
  ]
  forward_to = [prometheus.remote_write.prod]
}
Similarly, telemetry labels (such as team ownership or environment) are automatically applied based on collector attributes, eliminating the need for separate pipelines per team:
discovery.relabel "example" {
  targets = prometheus.exporter.self.example.targets

  rule {
    target_label  = "owner"
    replacement   = sys.env("<TEAM_OWNER>")
  }

  rule {
    target_label  = "env"
    replacement   = sys.env("")
  }
}
This approach reduces configuration duplication and ensures pipelines remain modular, adaptable, and easier to maintain across large fleets.
Minimizing risk with staged rollouts and controlled pipeline deployment
Instead of deploying configuration changes fleet-wide all at once, teams are using staged rollouts to safely introduce and validate new pipelines before full production rollout.
- Step 1: Deploy the new pipeline to development collectors using a matching attribute, e.g.,
env=~dev. - Step 2: If stable, expand rollout to staging by modifying the match expression:
env=~dev|staging. - Step 3: Introduce the pipeline to a limited production region (
prod-eu), ensuring a controlled transition. - Step 4: Once validated, enable the pipeline across all production environments (
prod-us).
At any point in the process, teams can disable the pipeline instantly via the Fleet Management UI or API, ensuring rapid rollback in case of issues.
This strategy significantly reduces deployment risk and ensures observability pipelines are validated incrementally before full production rollout.
A/B, canary, and blue-green deployment strategies for observability configurations
Fleet Management users are also applying controlled deployment patterns for testing and progressive rollouts:
- A/B Testing. Assign attributes like
test=GROUP-Aandtest=GROUP-Bto different sets of collectors, apply separate pipelines to each group, and compare telemetry results before finalizing configurations. - Canary Deployments. Deploy new pipelines to a small subset of collectors first (e.g., 5% of production instances), monitor behavior, and gradually expand rollout by modifying matching attributes.
- Blue-Green Deployments. Tag environments as
deploy=BLUEanddeploy=GREEN, and toggle configurations between them to minimize disruption during updates.
By using attribute-based pipeline matching, these strategies reduce risk and allow teams to roll out new configurations incrementally, safely, and with full control.
Check out our documentation to get more tips for optimizing your observability setup with Fleet Management.
Get started with Fleet Management today
It’s clear that Fleet Management unlocks a new level of control and flexibility. Teams are empowered to experiment and tailor how they collect telemetry, whether it’s automating everything as code, dialing data volumes up or down on demand, or unifying monitoring across disparate systems.
If your organization is facing the challenges with scaling observability, now is the perfect time to explore Fleet Management. With the Terraform provider, pre-built pipelines, and Kubernetes-focused updates, Grafana Cloud’s Fleet Management makes it easier than ever to keep your observability stack consistent, manageable, and cost-efficient, no matter how much you grow.
Give it a try and see how it can simplify managing your collector fleet, so you can focus on getting insights from your data rather than wrangling the tools that collect it. Fleet Management is available to all Grafana Cloud Admins in the Connections > Collector section of the UI.
- Already using Fleet Management? Your GA upgrade is automatic—start using the Terraform Provider, pre-built pipelines, and Kubernetes support today.
- New to Fleet Management? Get started in just a few steps:
- Get started with a new Grafana Alloy installation
- Onboard your existing collectors for remote configuration
- New to Grafana Cloud?
- Sign up for a forever-free account today.
- Follow the steps outlined above for those new to Fleet Management.
For full implementation details and best practices, see our Fleet Management documentation.

