
How to quickly gain operational insights using Grafana Cloud monitoring solutions
Grafana Cloud is the easiest way to start collecting and visualizing your telemetry data. With the fully managed, cloud-hosted platform, even novice observability practitioners can get up and running right away — and Grafana Cloud’s solutions for monitoring dozens of data sources are a big reason why.
In this blog post, we’ll dive into the details of these Grafana Cloud monitoring solutions, including what they are, the kinds of insights they provide, and how Grafana Alloy plays a role.
What are Grafana Cloud monitoring solutions?
So, what are Grafana Cloud monitoring solutions, exactly? So glad you asked. Solutions — or integrations, as they’re also known — offer a curated package of Grafana dashboards and best-practice alerting defaults. As of publication, there are over 100 popular observability targets in the collection, including Linux hosts, databases, Kubernetes clusters, and NGINX servers. With Grafana Cloud, you can stand up a pre-configured Prometheus and Grafana-based observability stack in minutes.
Solutions are also opinionated, so you don’t have to experience decision fatigue in order to gain valuable insights into the health and performance of your infrastructure. Part of that opinionated package is a pre-defined, tested configuration of Grafana Alloy, designed to collect the telemetry for your infrastructure.
They’re listed under “Integrations” in the Grafana Cloud connections console. (Don’t have a Grafana Cloud account yet? You can sign up for our forever-free tier today!)
What is Grafana Alloy?
Grafana Alloy is our open source distribution of the OpenTelemetry Collector. In the context of a solution, Alloy is responsible for collecting and forwarding telemetry data to the appropriate Grafana Cloud backends.
In many cases, this means the Alloy process will instantiate one or more Prometheus Exporters, or OpenTelemetry Collectors, to effectively extract telemetry data from your infrastructure.
Most solutions include visualizations and insights for logs, so you’ll often need to install Alloy on the host where your service is running to allow access to those logs. This means you might have many distributed installations of Alloy, even for the same solution. Take the solution for monitoring Windows, for example: It allows you to get insights into your entire fleet of Windows systems, where each individual node would have a discrete installation of Alloy.
You are not limited to using Alloy only for Grafana Cloud’s monitoring solutions, of course. Alloy can be configured to collect and forward telemetry from multiple sources. For example, you could deploy a single Alloy instance and scrape metrics from several Prometheus-compatible endpoints.
To learn more about Alloy, you can refer to our technical docs.
What kinds of insights can I expect?
Now let’s look at the sort of insights you can get. Most often, you’ll interact with the out-of-the-box dashboards that the solution provide.
Dashboards
The dashboards are typically designed to provide an overview of your entire fleet of a particular service. If you spot something at the overview level that you want to explore further, each dashboard is equipped with granular variables that let you narrow the scope to specific instances of your service.

This will often include linking to other dashboards in the same monitoring solution, which will show a more detailed view of a given domain. For example, you could drill down to see the CPU and overall system health for a single Windows instance.
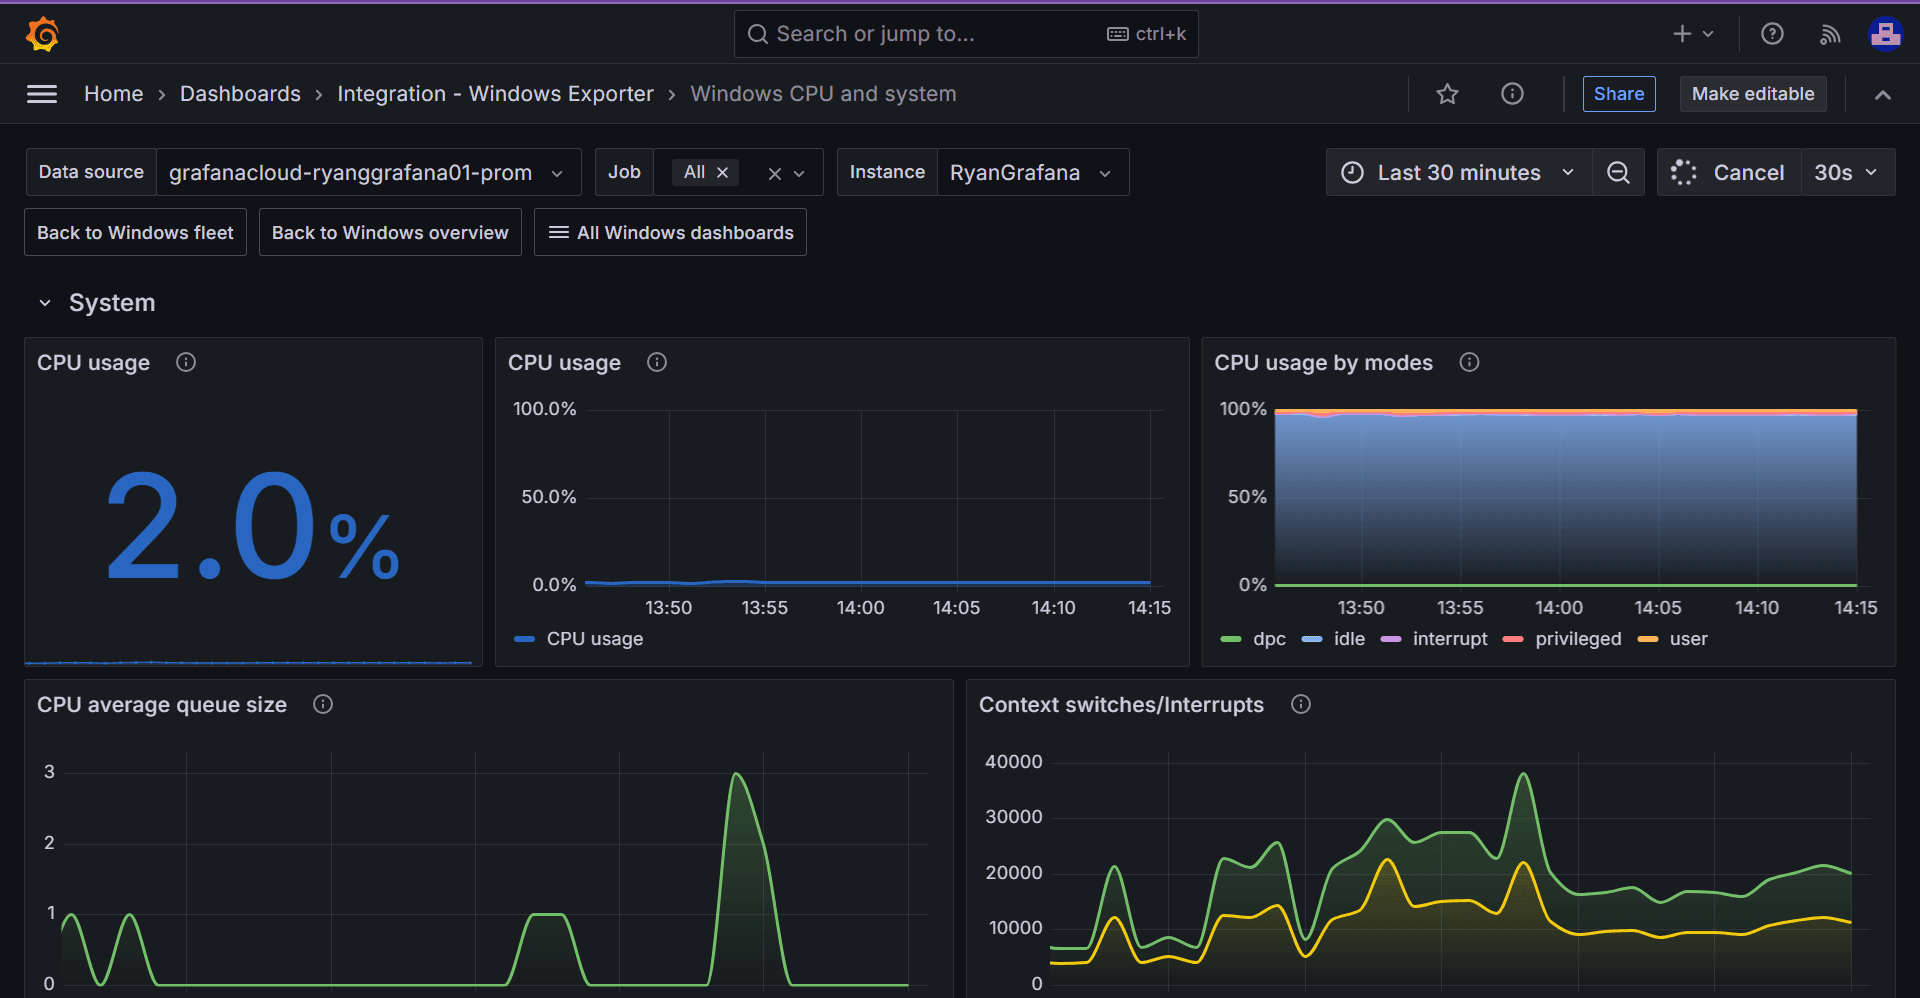
The visualizations will always show the telemetry data in its most useful form, given the service that’s being observed. For example, in the Windows screenshots above, the USE method is heavily utilized. For more service-oriented solutions, the RED method is often used. To learn more about these and other common observability methods, check out our technical docs.
Alerts
Solutions also include detailed alerts for common failure modes. Pictured below, as an example, are the alerts included in our solution for monitoring MySQL.
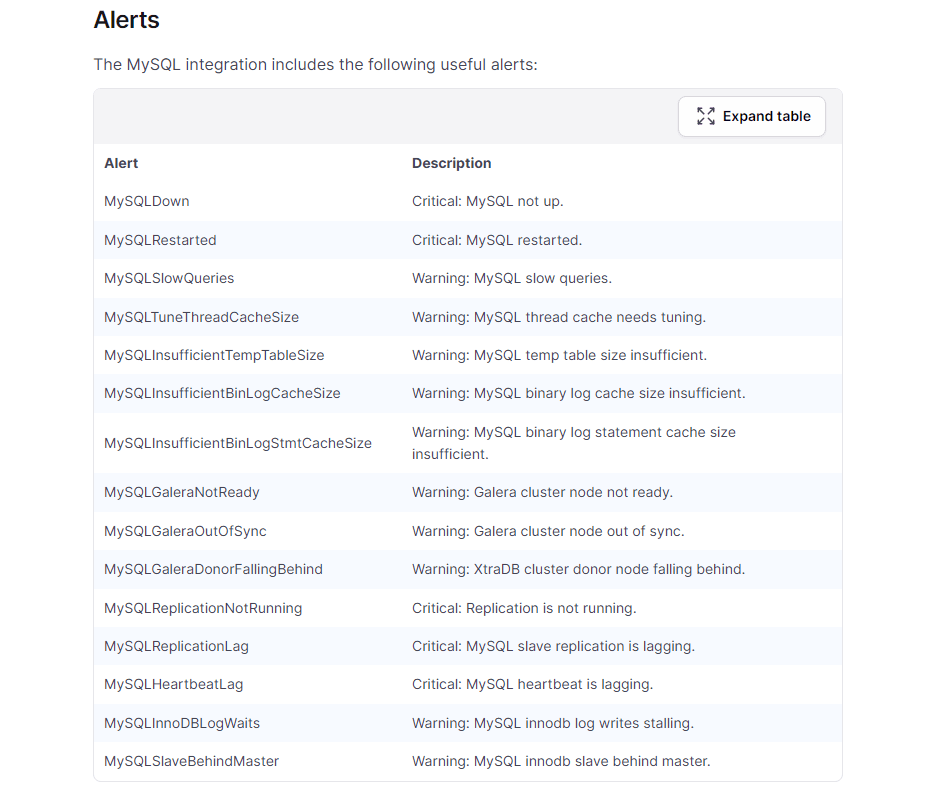
The included alerts are thoughtfully designed to scale with the service and traffic that you’re running. For example, you might get an alert when a large percentage of requests are resulting in errors, rather than receive a static number or rate. This distinction is important; one hundred errors per second may be catastrophic for a service that sees just a few hundred requests per second, but it’s “in the noise” for a service that handles tens of thousands of requests per second.
You’re not limited to just the alerts that are bundled with the monitoring solution. Once you’ve set up Grafana Alloy and start collecting metrics, you’re free to set up alerts that might be more tailored to your specific requirements or SLAs.
Why should I use Grafana Cloud monitoring solutions?
Overall, Grafana Cloud’s monitoring solutions allow you to set up an observability stack quickly. You don’t need previous experience, and you don’t even need to know much about observability. They exist to help novice and experienced users alike get a comprehensive view of the infrastructure that runs their applications. They also offer a runway to deeper and more tailored insights and user experience.
Grafana Cloud monitoring solutions offer:
- An opinionated path for collecting and storing telemetry data, reducing decision fatigue and allowing you to get started quickly
- Preconfigured dashboards to visualize that telemetry
- Curated alerting rules to help you get started, and spot common problems
To get started with Grafana Cloud monitoring solutions today, check out our technical docs.
Grafana Cloudis the easiest way to get started with metrics, logs, traces, dashboards, and more. We have a generous forever-free tier and plans for every use case. Sign up for free now!

