
All about span events: what they are and how to query them
If you’re already familiar with distributed tracing, you know that spans are the building blocks of traces. But are you sleeping on what span events can do for you?
First, you may need a wake-up call as to what a span event even is. While spans represent units of work or operation within a trace, a span event is a unique point in time during the span’s duration. While spans help build the structural hierarchy of your services, span events can provide a deeper level of granularity to help debug your application faster and maintain optimal performance.
Why use span events instead of just adding more spans or span attributes? While you can always add more spans, span events are much more lightweight and won’t significantly increase the size of your traces. Span attributes are also lightweight, but they lack the ability to store timestamps, which is where events really shine.
In this blog post, we’ll cover when to add span events to gain different insights and how to query span events using TraceQL in Grafana Cloud Traces.
When to add span events
Now that we understand the benefits of span events, here are some ways you can leverage events into your tracing strategy to help you gain more valuable insights from your tracing data.
Error tracking
Let’s be honest: People don’t typically check dashboards, logs, or traces when everything is running smoothly. But more eyes will pay attention when there is an alert that one of your pods is crashlooping because of an error in a function that is shared across multiple services with various entry points.
While traditional logs can capture errors, they sometimes lack the necessary context to help you fully chase down the issue. With tracing, however, you can record an exception event. This event becomes part of a span, which in turn is part of a comprehensive trace, allowing you to track the exact flow and sequence of actions leading up to the error.
Performance monitoring
A major benefit of using span events is their ability to capture precise timestamps. This allows us to measure the performance of specific steps within a span.
For instance, if a request is taking longer than expected, we can log all intermediate steps as span events. We can track the time to establish a connection with an external service, the time to acquire a read lock, or even the time to execute a database query. This detailed information can help us pinpoint whether the delay is due to network latency, a data locking issue, or the need for database query optimization.
Sampled structured logging
Unlike span attributes, span events can be viewed as structured logs. One advantage of using span events over traditional logs is that, because they are part of a trace, they allow us to easily follow the flow of execution.
Another often overlooked benefit is that tracing has richer sampling capabilities than logs. Let’s say you want to monitor the inputs and outputs of a function that is executed across multiple entry points. But in this scenario, you don’t need the information about all the entry points; you only need to know about one or two specific entry points. With tracing, we can control head sampling rates for different entry points, so that we can isolate the data for the entry points we want and at the rate in which we need.
How to query span events with TraceQL
The initial versions of TraceQL — the query language designed for selecting traces in Grafana Tempo, which also powers Grafana Cloud Traces — brought in the concept of scopes, supporting span, resource, and trace scopes. With the latest iteration, we’ve added support for event scope, allowing Tempo users to query for span events. More specifically, TraceQL now offers support for span event names and attributes.
Note: This new feature is currently available in Grafana Cloud Traces and will soon be available in the next Grafana Tempo OSS release, which we will announce soon.
Event name
To query for event names, simply use the syntax event:name. Below is an example query for spansets where there is at least one event with name value of updated database.
{ event:name = "updated database" }
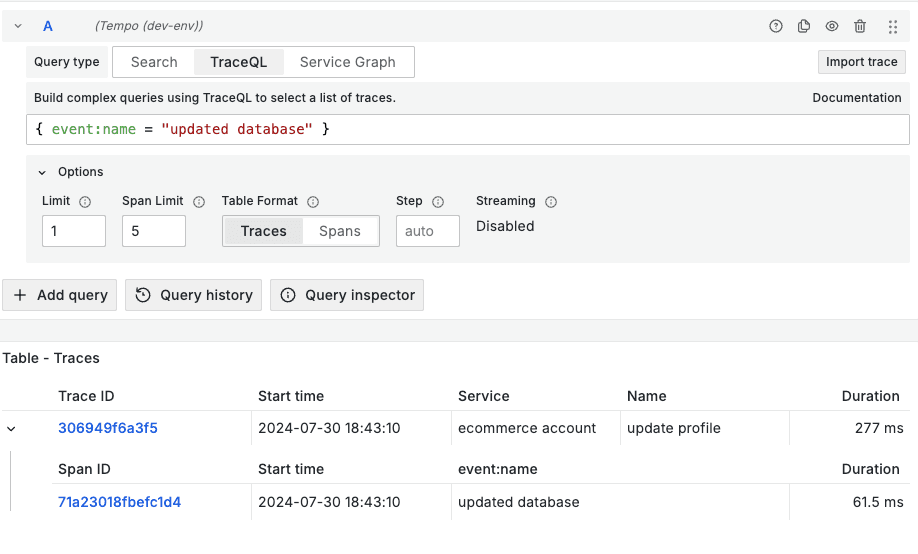
The query returned this matching trace where there is one span with one event matching the name updated database. By clicking on the span id, we can see more information about this event.
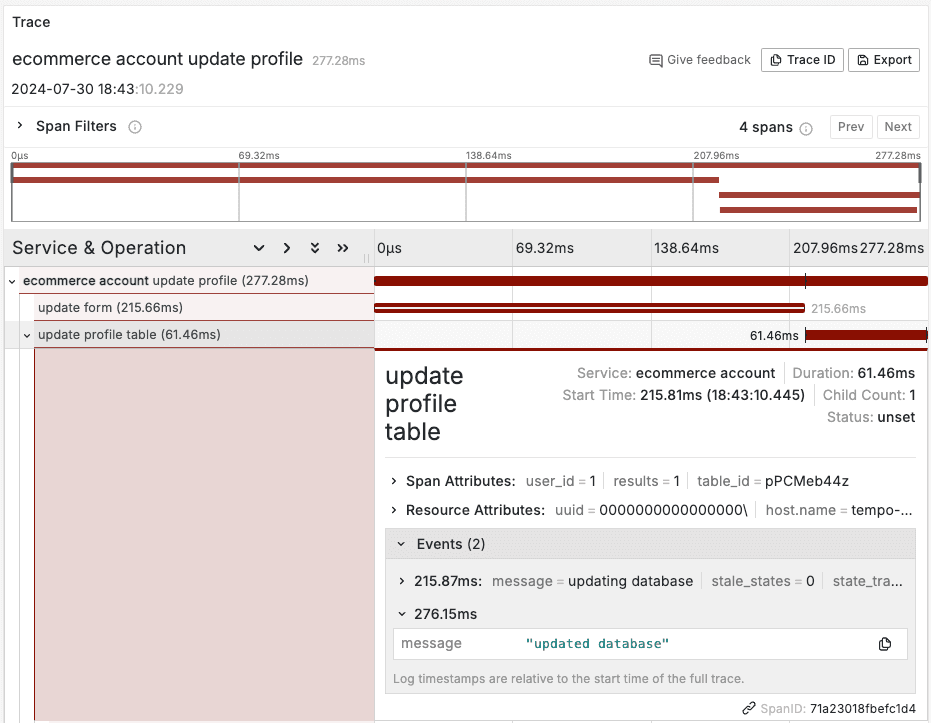
Here we can see that there were actually two events within this span. One event with the name updating database and another with the name updated database, which is the one we searched for. Based on the two events’ timestamps, we can see that it took about 60ms for the database operation to finish.
Event attribute
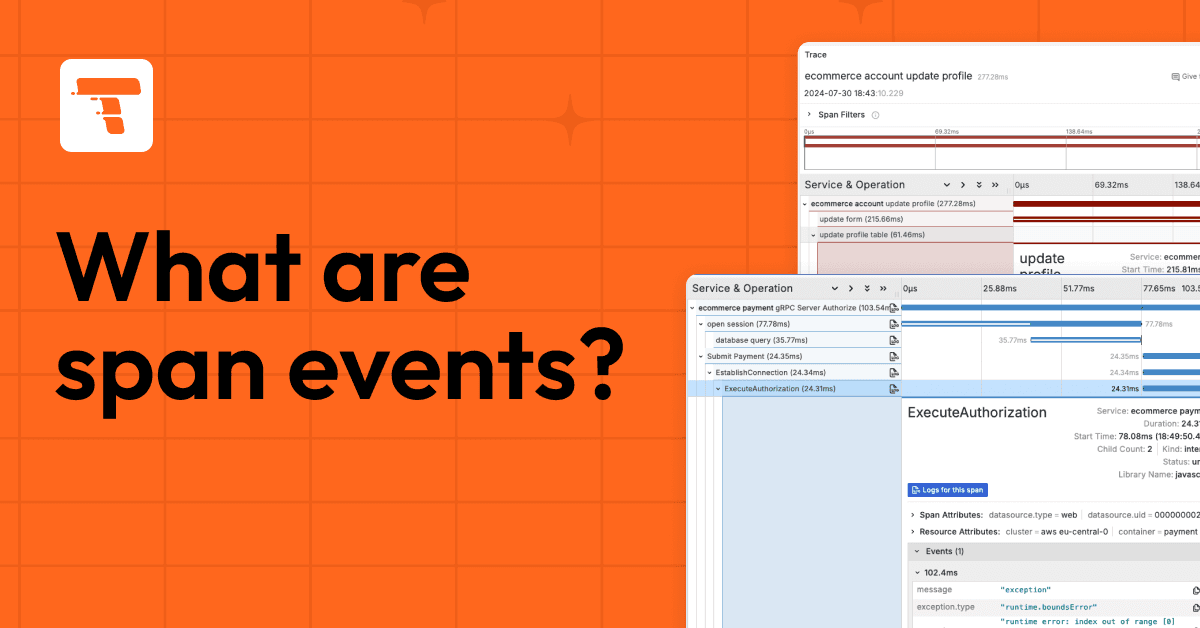
To query for event attributes, simply use the event. syntax. Below is an example of a query for an event attribute key called exception.message with the value partially matching index out of range.
{ event.exception.message =~ “.*index out of range.*” }
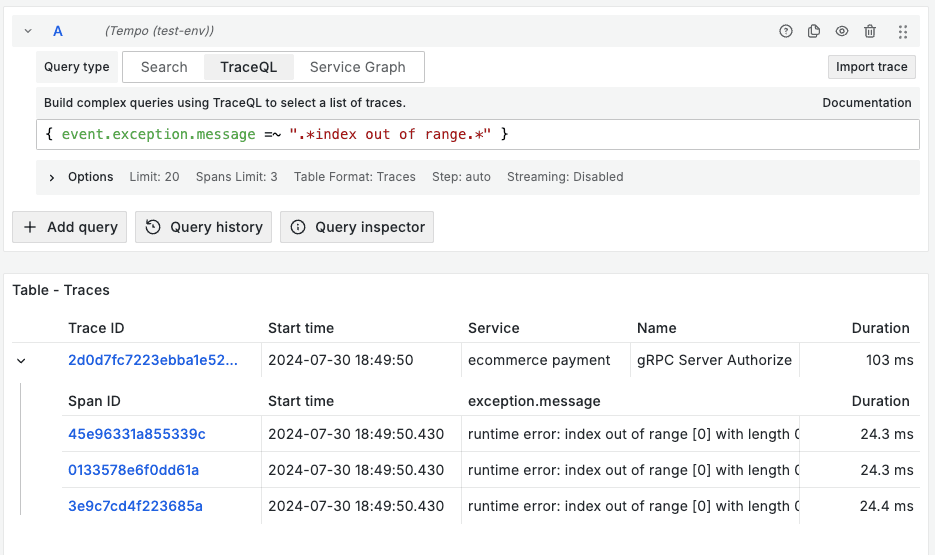
Here, we were able to find a matching trace with spans containing an event where the attribute exception.message partially matched index out of range. By clicking on the corresponding span id, we can see a detailed view of the trace.
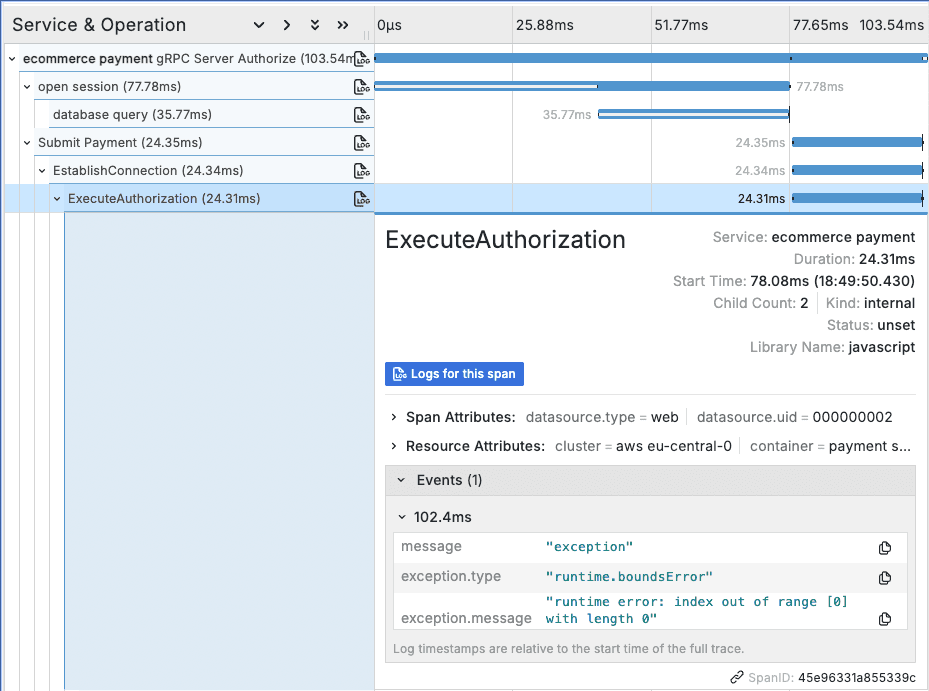
With the trace view open, we can see the sequence of steps that took place up until the error.
Learn more about span events and TraceQL
Integrating span events into your tracing strategy can help you improve your debugging and application performance. They add an extra layer of granularity without blowing up your trace size. Additionally, tracing offers richer sampling capabilities compared to traditional logs, allowing you to selectively capture relevant data within span events. With the latest updates to TraceQL, you can now query these events to help you monitor performance and troubleshoot issues. So, what are you waiting for?
To learn more about tracing and TraceQL, check out our on-demand webinar “Getting started with tracing and Grafana Tempo.”
You can also reach out to the Grafana Tempo team on the Grafana Labs Community Slack channel or find Grafana Tempo in GitHub.
*The easiest way to get started with tracing and TraceQL is with Grafana Cloud. We have a generous forever-free tier and plans for every use case. Sign up for free now!

